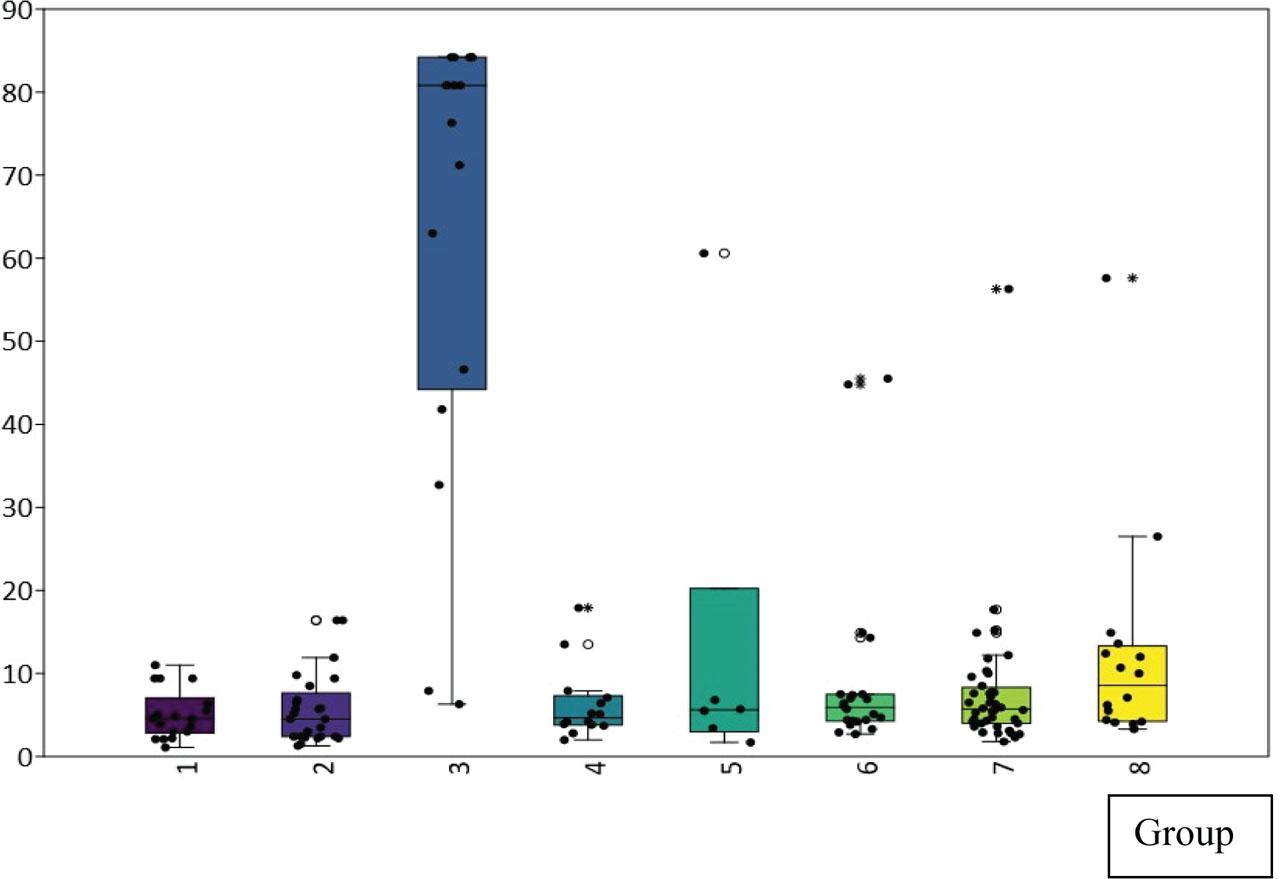
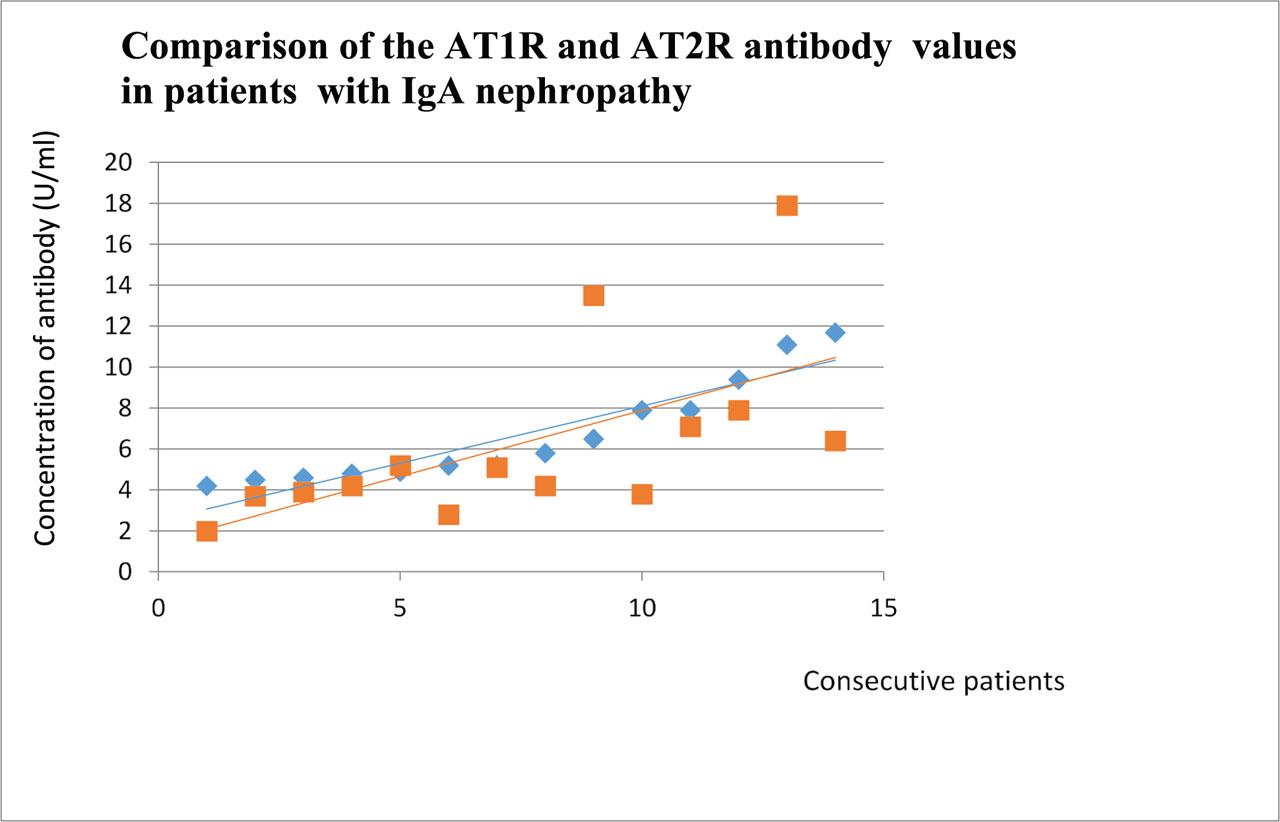
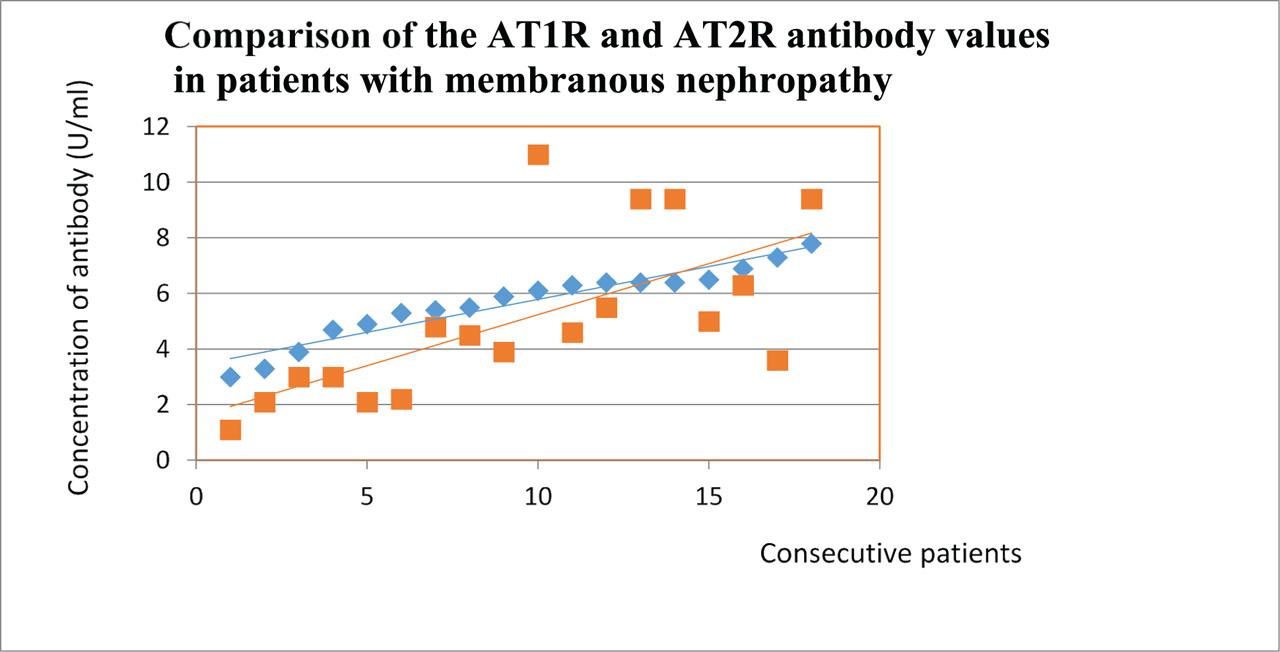
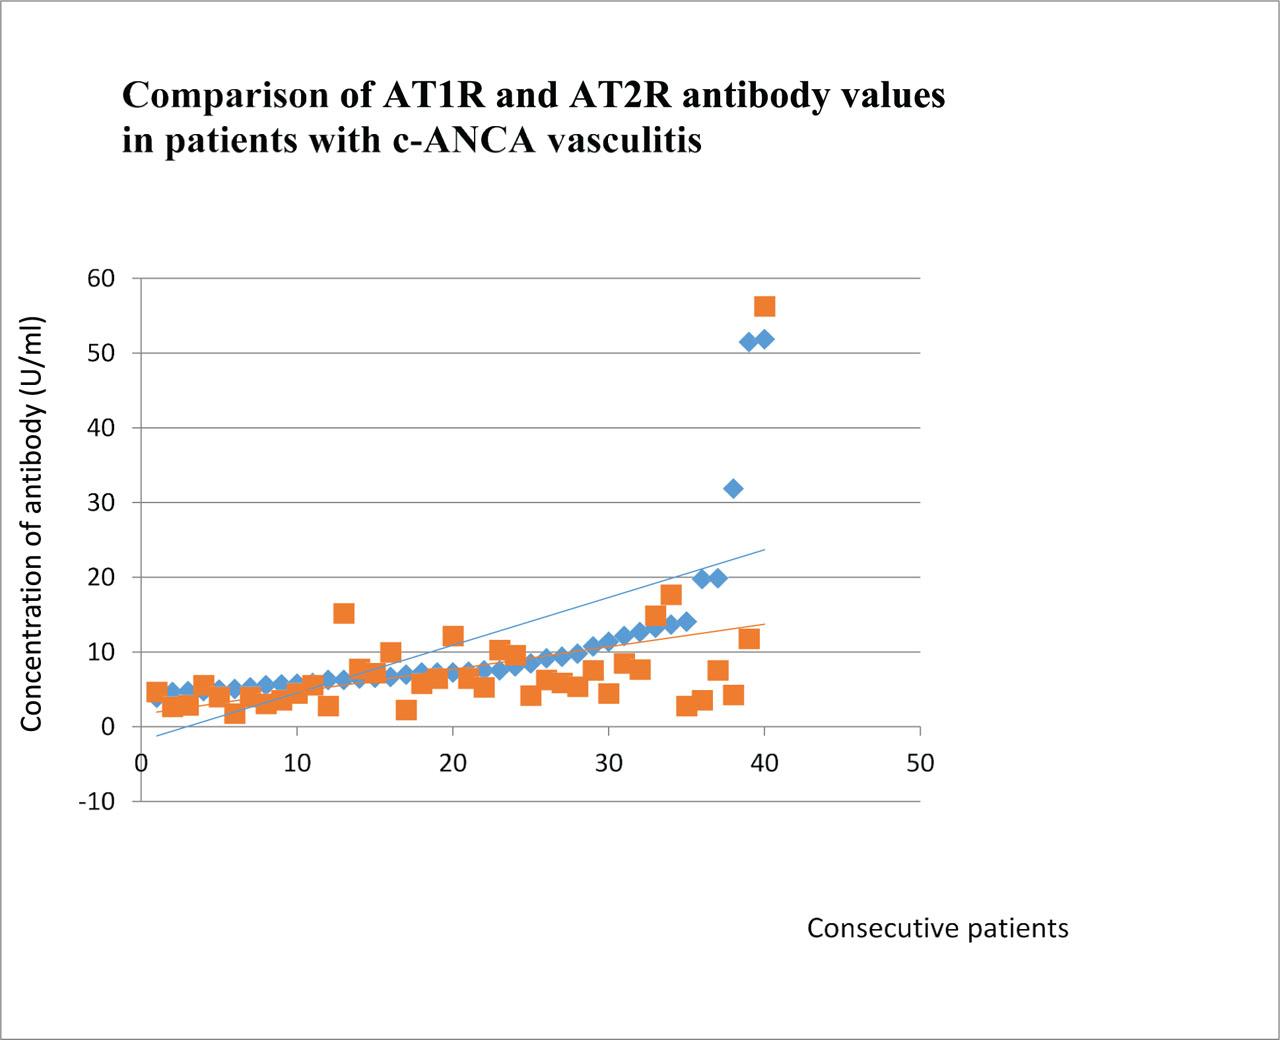
Have a personal or library account? Click to login

Figures & Tables

Fig 1.

AT2R antibody values in specific groups of patients, axis y: AT2R antibody concentration (U/mL), axis x: particular groups of patients: 1 – membranous nephropathy, 2 – focal and segmental glomerulosclerosis, 3 – lupus nephritis, 4 – IgA nephropathy, 5 – mesangialproliferative (non-IgA) glomerulonephritis, 6 – control group, 7 – c-ANCA vasculitis, and 8 – p-ANCA vasculitis. AT2R, angiotensin II type 2 receptor; c-ANCA, antineutrophil cytoplasmic antibodies.

Fig 2.

Comparison of the AT1R and AT2R antibody values in patients with IgA nephropathy. Patients are segregated according to the growing level of AT1R antibody. Blue dots represent values of AT1R antibody and red dots represent values of AT2R antibody. Blue line – trend line for the AT1R antibody and red line – trend line for the AT2R antibody. AT1R, angiotensin II type 1 receptor; AT2R, angiotensin II type 2 receptor.

Fig 3.

Comparison of the AT1R and AT2R antibody values in patients with membranous nephropathy. Patients are segregated according to the growing level of AT1R antibody. Blue dots represent values of AT1R antibody and red dots represent values of AT2R antibody. Blue line –trend line for the AT1R antibody and red line – trend line for the AT2R antibody. AT1R, angiotensin II type 1 receptor; AT2R, angiotensin II type 2 receptor.

Fig 4.

Comparison of the AT1R and AT2R antibody values in patients with c-ANCA vasculitis. Patients are segregated according to the growing level of AT1R antibody. Blue dots represent values of AT1R antibody and red dots represent values of AT2R antibody. Blue line –trend line for the AT1R antibody and red line – trend line for the AT2R antibody. AT1R, angiotensin II type 1 receptor; AT2R, angiotensin II type 2 receptor; c-ANCA, antineutrophil cytoplasmic antibodies.

Mean values of specific clinical parameters in the assessed patient groups

Creatinine (mg/dL)Proteinuria (g/24 h)Total protein (g/dL)Total albumin (g/dL)Age (years)
Membranous glomerulonephritis1.37 ± 0.574.23 ± 4.584.81 ± 0.702.79 ± 0.6452.00 ± 12.00
Focal segmental glomerulosclerosis1.32 ± 0.533.17 ± 3.115.20 ± 1.162.99 ± 0.9146.36 ± 15.00
Systemic lupus erythematosus1.21 ± 0.421.85 ± 1.705.60 ± 0.843.18 ± 0.5937.82 ± 13.00
IgA nephropathy1.19 ± 0.341.44 ± 1.295.57 ± 0.773.32 ± 0.6443.86 ± 15.00
Mesangial proliferative glomerulonephritis without IgA deposits1.01 ± 0.363.16 ± 2.544.68 ± 0.512.54 ± 0.6131.50 ± 13.00
c-ANCA vasculitis2.07 ± 1.541.72 ± 3.616.29 ± 0.443.63 ± 0.4655.00 ± 18.00
p-ANCA vasculitis3.93 ± 2.392.46 ± 3.086.09 ± 0.853.53 ± 0.4262.00 ± 12.00
Control group1.1 ± 0.250.00 ± 0.007.45 ± 0.854.40 ± 0.9046.00 ± 13.00

Median and mean AT2R antibody

Median AT2R antibody levels (U/mL)Mean AT2R antibody levels (U/mL)
Systemic lupus erythematosus (Group 3)80.8 (range: 6.3–84.2)64.12 ± 26.95
p-ANCA vasculitis (Group 8)8.55 (range: 3.3–57.6)12.28 ± 13.48
c-ANCA vasculitis (Group 7)5.7 (range: 1.8–56.3)7.83 ± 8.70
Mesangial proliferative (non-IgA) glomerulonephritis (Group 5)5.6 (range: 1.7–60.6)13.95 ± 22.93
IgA nephropathy (Group 4)4.65 (range: 2–17.9)6.26 ± 4.39
Membranous glomerulonephritis (Group 1)4.55 (range: 1.1–11)5.05 ± 2.95
Focal segmental glomerulosclerosis (Group 2)4.5 (range: 1.3–16.4)5.71 ± 4.28
Control group (Group 6)5.9 (range: 2.7–45.5)9.72 ± 11.88
Language: English
Submitted on: Jan 24, 2024
Accepted on: Jun 24, 2024
Published on: Aug 19, 2024
Published by: Hirszfeld Institute of Immunology and Experimental Therapy
In partnership with: Paradigm Publishing Services
Publication frequency: 1 times per year

© 2024 Maciej Szymczak, Harald Heidecke, Marcelina Żabińska, Dagna Rukasz, Krzysztof Wiśnicki, Krzysztof Kujawa, Katarzyna Kościelska-Kasprzak, Magdalena Krajewska, Mirosław Banasik, published by Hirszfeld Institute of Immunology and Experimental Therapy
This work is licensed under the Creative Commons Attribution-NonCommercial-NoDerivatives 4.0 License.