Have a personal or library account? Click to login
Abnormalities of Coagulation and Fibrinolysis Assessed by Thromboelastometry in an Endotoxic Shock Model in Piglets Treated with Nitric Oxide and Hydrocortisone Cover

Abnormalities of Coagulation and Fibrinolysis Assessed by Thromboelastometry in an Endotoxic Shock Model in Piglets Treated with Nitric Oxide and Hydrocortisone

Open Access
|Jun 2024

Figures & Tables

Fig 1.

Study design. All animals had endotoxin infusion for a total of 10 h. Administration of iNO was started 3 h after endotoxin infusion and continued until the end of the 20-h observation period. Hydrocortisone was given 3 h after the endotoxin infusion, and the dose was repeated at 8 h and 16 h. iNO and hydrocortisone were administered in the iNO(+) group, and not in the group iNO(−). iNO, inhaled nitric oxide.

Fig 2.

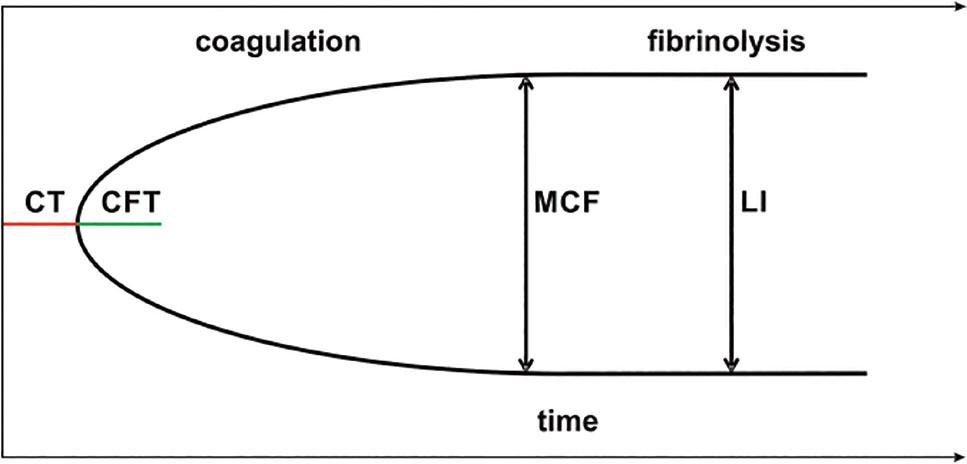
Thromboelastometry (ROTEM®) diagram. CT – represents time from the start of the test until the initiation of clotting; CFT – represents time from the initiation of clotting until a clot firmness of 20 mm was detected; MCF – represents the overall strength of the clot by the polymerized fibrin, thrombocytes, and factor XIII. LI – represents clot stability and a reduction in clot firmness after MCF. CFT, clot formation time; CT, clotting time; LI, lysis index; MCF, maximum clot firmness.

Fig 3.

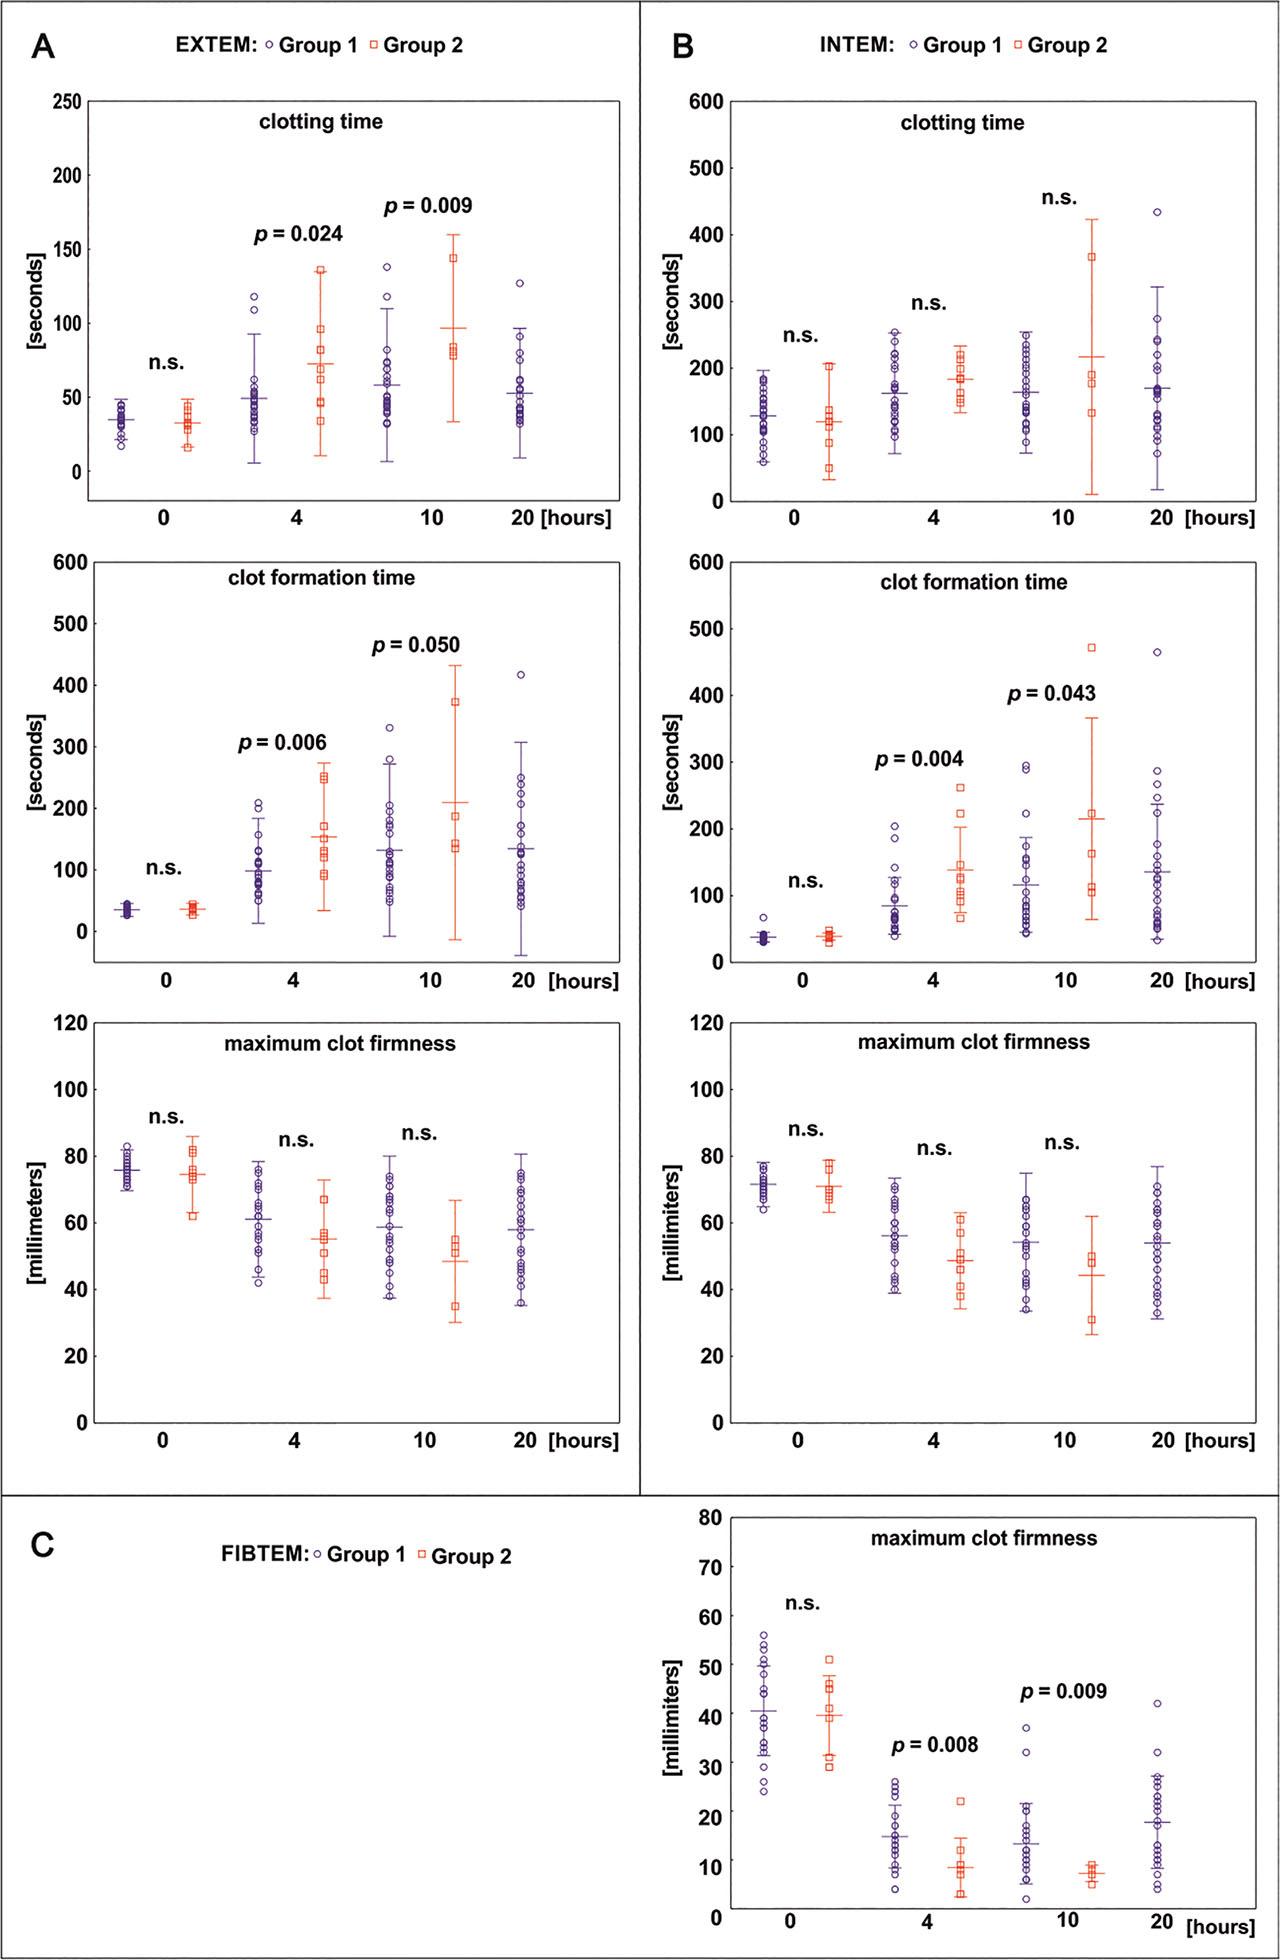
Coagulation parameters measured by thromboelastometry. The parameters of the EXTEM (a), INTEM (b), and FIBTEM (c) tests in Group 1 (survivors) were measured at baseline, and the 4th, 10th, and 20th h and in Group 2 (non-survivors), were measured at baseline, and the 4th and 10th h of the experiment. p-values represent differences between groups at each time point (p > 0.05, Mann–Whitney U test). n.s., not significant.

Fig 4.

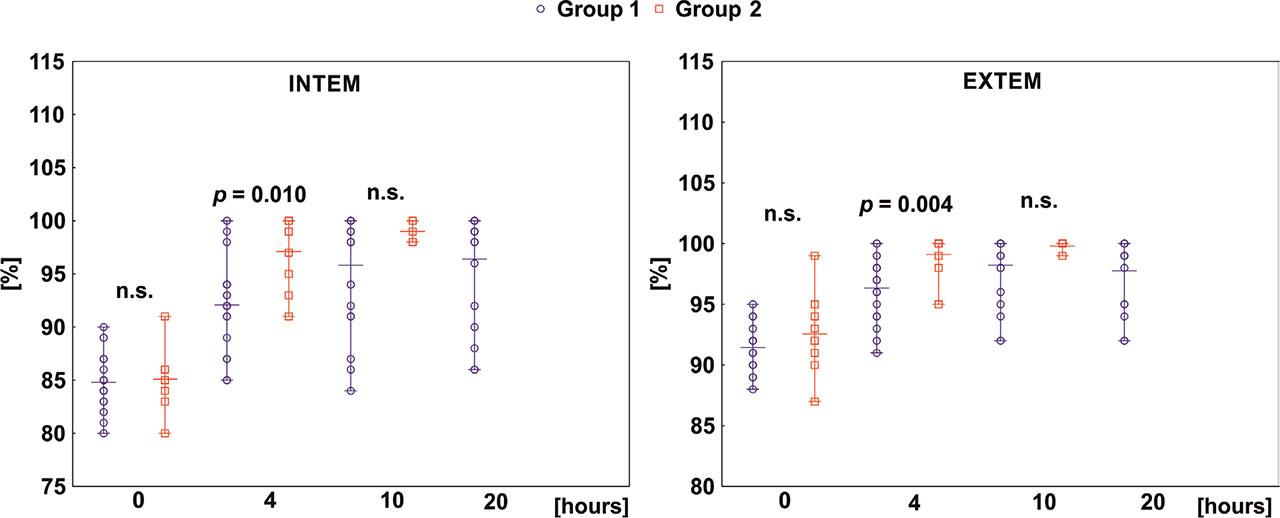
Fibrinolysis results measured by thromboelastometry. LI in Group 1 (survivors) and Group 2 (non-survivors) was measured at baseline, and the 4th, 10th, and 20th h of the experiment. p-values represent differences between groups at each time point (p > 0.05, Mann–Whitney U test). LI, lysis index; n.s., not significant.

Fig 5.

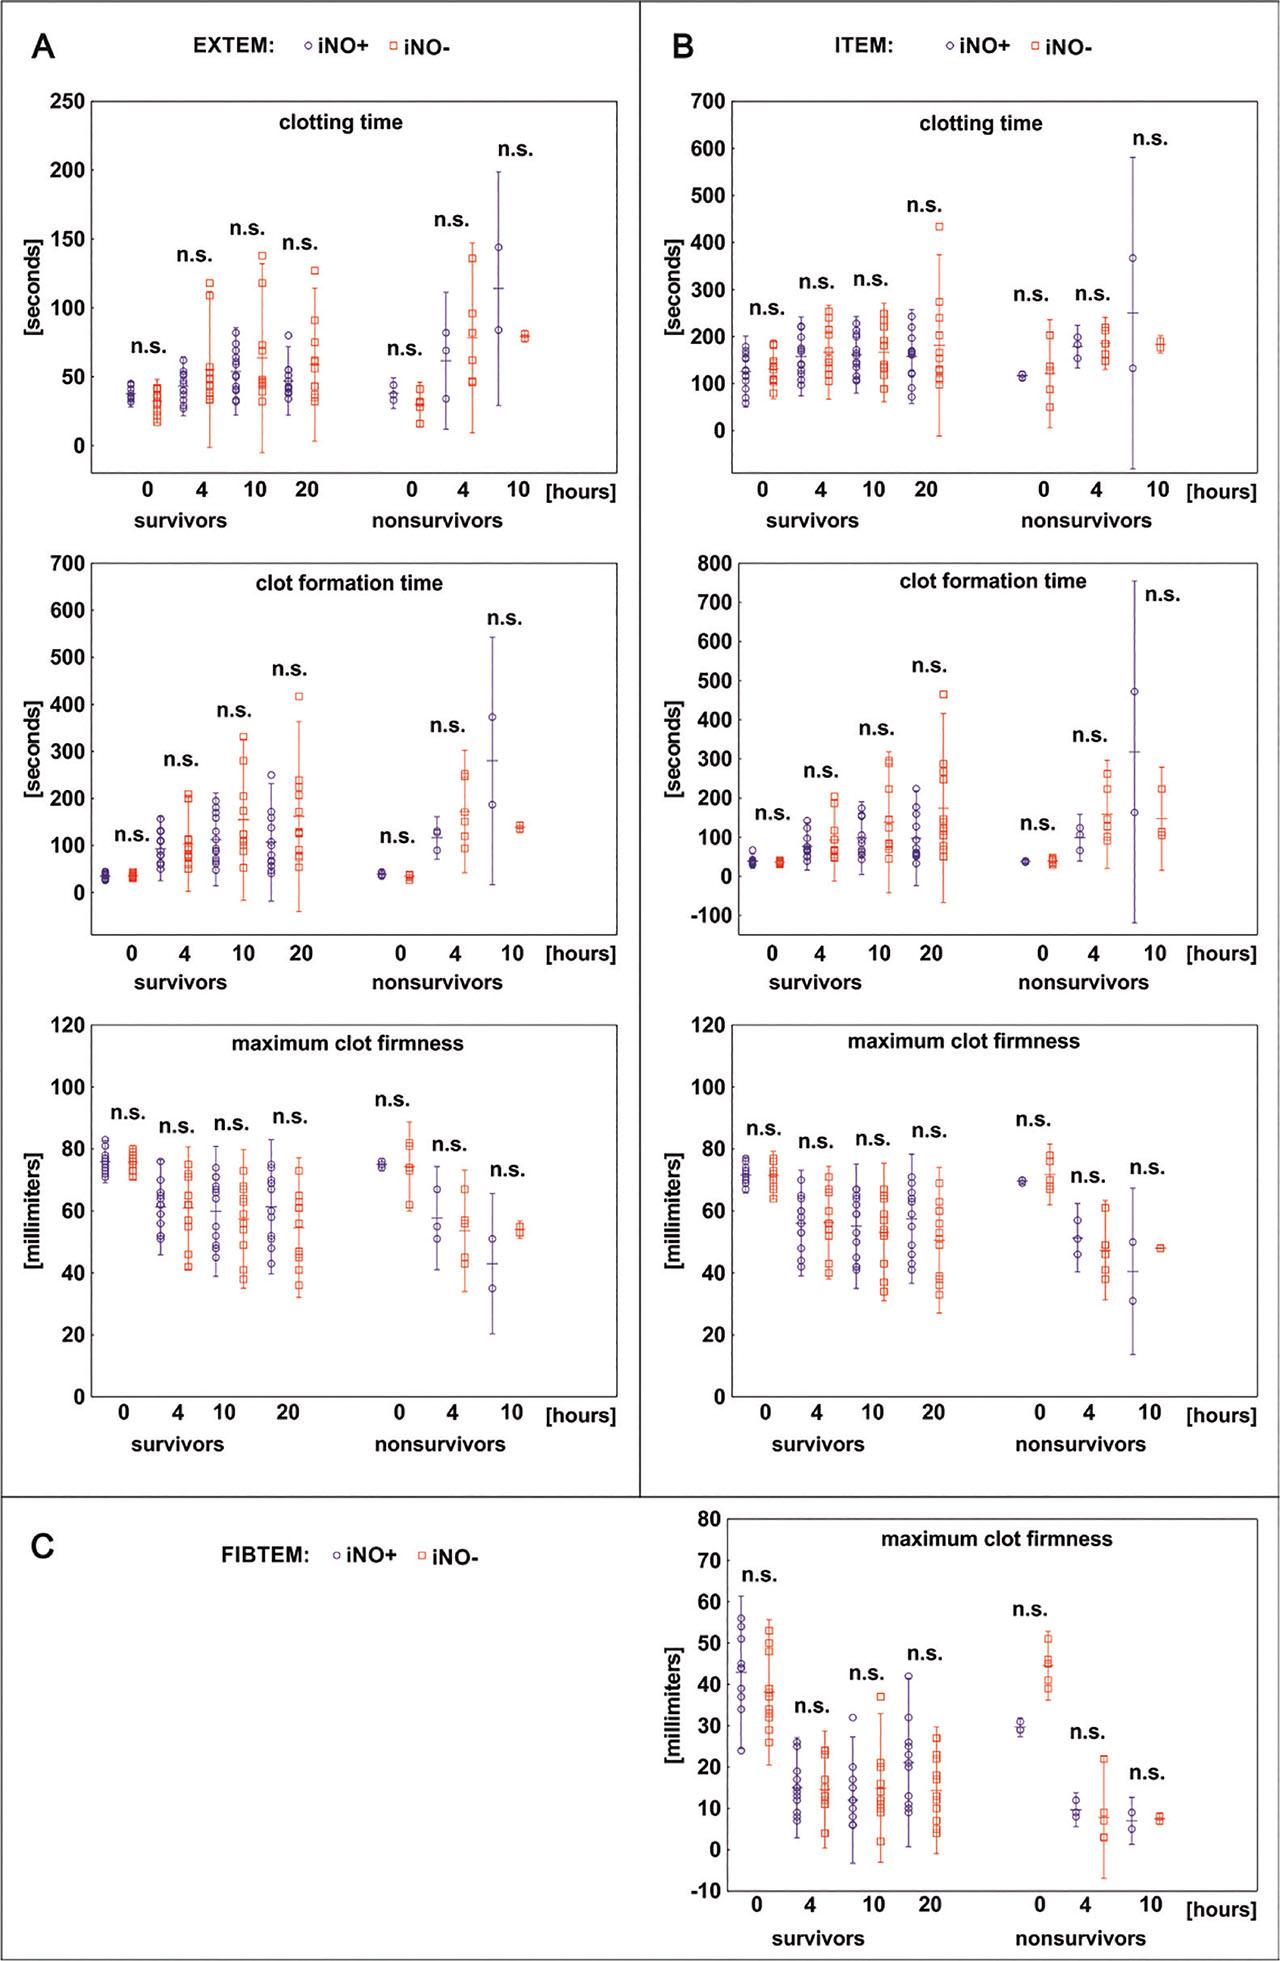
Coagulation parameters measured by thromboelastometry – the effect of iNO + hydrocortisone. The parameters of the EXTEM (a), INTEM (b), and FIBTEM (c). Tests in survivors were measured at baseline, and the 4th, 10th, and 20th h of the experiment, and in non-survivors, at baseline, and the 4th, and 10th h. iNO(+), animals were treated with iNO + hydrocortisone; iNO(−) animals were not treated with iNO + hydrocortisone; p-values refer to the comparison of iNO(+) vs. iNO(−) in each group at each time point (p > 0.05, Mann–Whitney U test). iNO, inhaled nitric oxide; n.s., not significant.

Changes in ROTEM parameters and other coagulation tests before (T0), during endotoxin infusion (T4 and T10), and after stopping of endotoxin administration (T20)

ParameterTimeAll (N = 34)Survivors (N = 25)Non-survivors (N = 9)p
EXTEM
CT (s)034.2 ± 1.234.9 ± 1.332.5 ± 2.60.318
456.9 ± 4.449.1 ± 4.274.8 ± 9.50.024
1065.1 ± 5.458.2 ± 5.296.6 ± 12.20.009
2052.0 ± 4.352.0 ± 4.30
CFT (s)035.4 ± 0.835.1 ± 1.136.3 ± 1.50.480
4113.1 ± 8.998.5 ± 8.3153.6 ± 19.90.006
10144.1 ± 14.5132.0 ± 14.2202.2 ± 43.30.050
20134.3 ± 17.6134.3 ± 17.6
MCF (mm)075.4 ± 0.675.8 ± 0.674.5 ± 1.90.623
459.3 ± 1.561.0 ± 1.654.4 ± 2.80.077
1057.1 ± 1.958.7 ± 2.149.6 ± 3.70.130
2057.9 ± 2.357.9 ± 2.3
LI (%)091.7 ± 0.491.4 ± 0.392.5 ± 1.10.315
497.0 ± 0.496.3 ± 0.599.1 ± 0.50.004
1098.5 ± 0.498.2 ± 0.599.8 ± 0.20.237
2097.7 ± 0.697.7 ± 0.6
INTEM
CT (s)0125.9 ± 6.1128.1 ± 6.8119.6 ± 13.50.570
4168.8 ± 7.3162.3 ± 9.2186.1 ± 8.80.114
10173.4 ± 10.2163.5 ± 8.8223.0 ± 37,70.224
20170.2 ± 15.5170.2 ± 15.5
CFT (s)037.8 ± 1.137.6 ± 1.438.5 ± 1.70.353
498.7 ± 9.184.5 ± 8.3138.4 ± 21.30.004
10133.1 ± 17.4116.0 ± 14.5215.2 ± 67.50.043
20135.7 ± 20.6135.7 ± 20.6
MCF (mm)071.4 ± 0.571.5 ± 0.671.0 ± 1.20.433
454.1 ± 1.456.1 ± 1.648.6 ± 2.30.057
1052.4 ± 1.954.2 ± 2.144.2 ± 3.40.872
2054.0 ± 2.354.0 ± 2.3
LI (%)084.8 ± 0.484.8 ± 0.585.1 ± 0.90.734
493.4 ± 0.892.0 ± 0.897.1 ± 1.10.010
1096.4 ± 0.995.8 ± 1.099.0 ± 0.40.360
2096.4 ± 1.196.4 ± 1.1
FIBTEM
MCF (mm)040.2 ± 1.440.5 ± 1.739.5 ± 2.70.930
413.0 ± 1.114.7 ± 1.28.4 ± 2.00.008
1011.2 ± 1.112.1 ± 1.37.2 ± 0.850.009
2017.7 ± 2.017.7 ± 2.0
Platelets (103/μL)0415.7 ± 16.8431.4 ± 18.6372.1 ± 34.40.097
4206.1 ± 22.3229.5 ± 28.8143.7 ± 17.50.045
10146.2 ± 14.5153.9 ± 18.2119.0 ± 8.40.434
20119.1 ± 16.7119.1 ± 16.7
Fibrinogen (mg · dL−1)03.1 ± 0.13.1 ± 0.13.3 ± 0.40.482
42.0 ± 0.12.1 ± 0.11.7 ± 0.20.024
101.6 ± 0.11.7 ± 0.11.2 ± 0.20.059
202.2 ± 0.12.2 ± 0.1

The basic variables of the pigs before endotoxin infusion

ParameterAll (N = 34)Survivors (N = 25)Non-survivors (N = 9)p
EXTEM
CT (s)34.2 ± 1.234.8 ± 1.332.5 ± 2.60.318
CFT (s)35.4 ± 0.835.1 ± 1.136.3 ± 1.50.480
MCF (mm)75.4 ± 0.675.8 ± 0.674.5 ± 1.90.623
LI (%)91.7 ± 0.491.4 ± 0.392.5 ± 1.10.315
INTEM
CT (s)125.9 ± 6.1128.1 ± 6.8119.6 ± 13.50.570
CFT (s)37.8 ± 1.137.6 ± 1.438.5 ± 1.70.353
MCF (mm)71.4 ± 0.571.5 ± 0.671.0 ± 1.20.433
LI (%)84.8 ± 0.484.8 ± 0.585.1 ± 0.90.734
FIBTEM
MCF (mm)40.2 ± 1.440.4 ± 1.739.5 ± 2.70.930
Platelets (103 • μL–1)415.7 ± 16.8431.4 ± 18.6372.1 ± 34.40.097
Fibrinogen (mg • dL–1)3.1 ± 0.13.1 ± 0.13.3 ± 0.40.482
Language: English
Submitted on: Sep 5, 2023
Accepted on: Apr 18, 2024
Published on: Jun 7, 2024
Published by: Hirszfeld Institute of Immunology and Experimental Therapy
In partnership with: Paradigm Publishing Services
Publication frequency: 1 times per year

© 2024 Barbara Adamik, Claes Frostell, Barbara Dragan, Urszula Paslawska, Stanislaw Zielinski, Robert Paslawski, Adrian Janiszewski, Marzena Zielinska, Stanislaw Ryniak, Johanna Albert, Waldemar Gozdzik, published by Hirszfeld Institute of Immunology and Experimental Therapy
This work is licensed under the Creative Commons Attribution-NonCommercial-NoDerivatives 4.0 License.