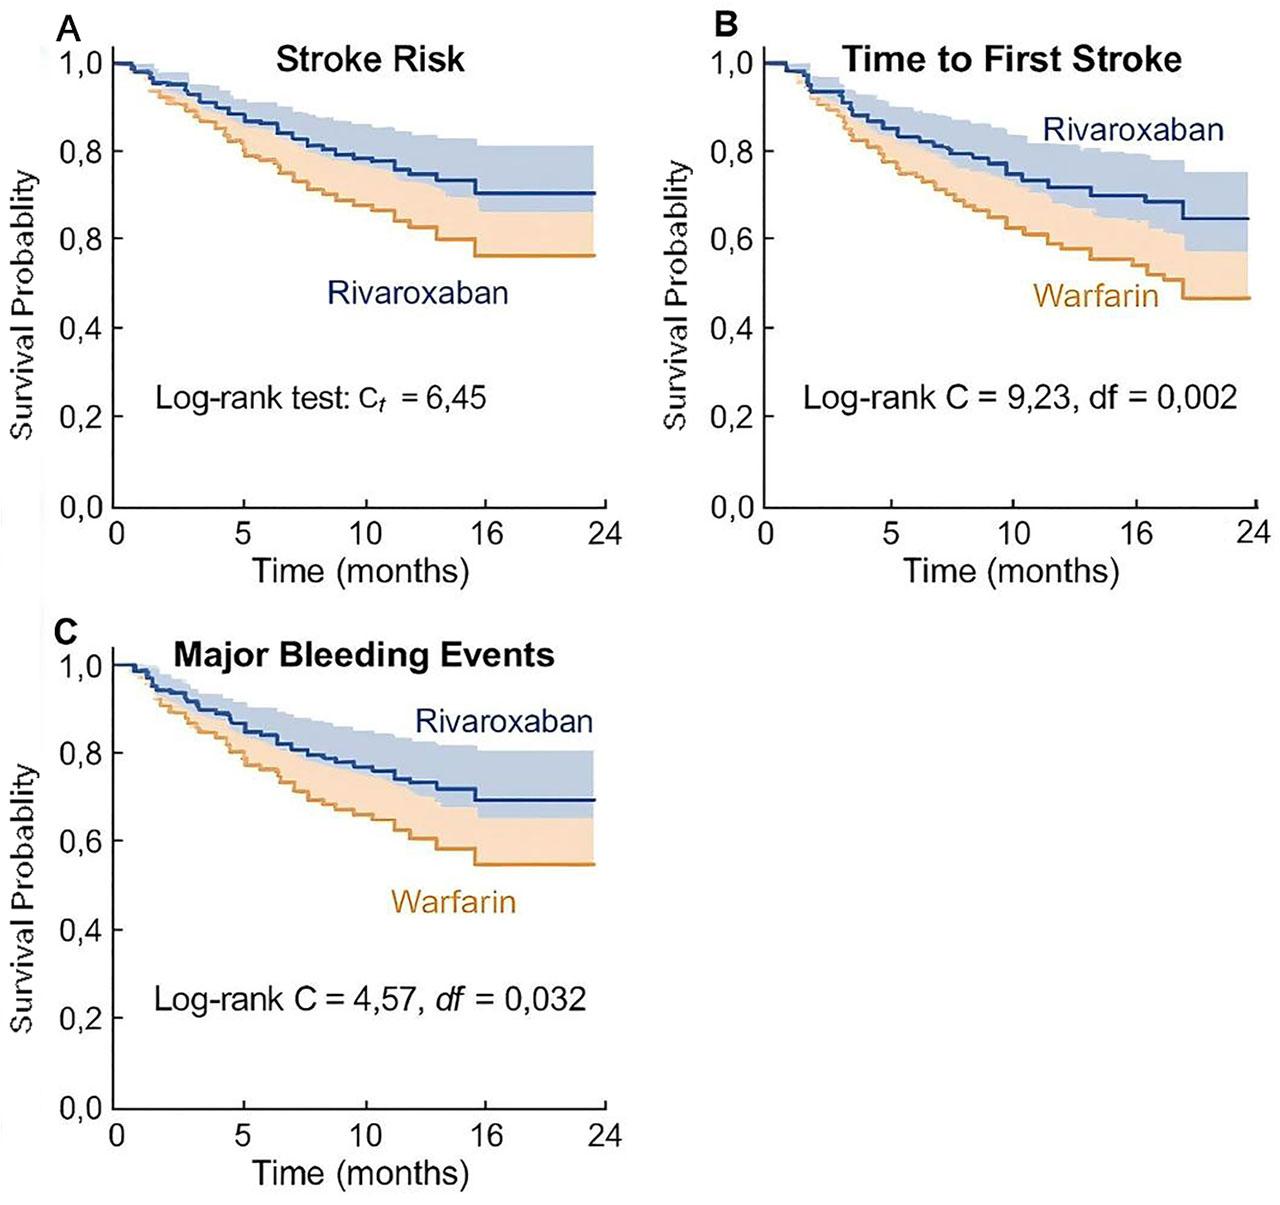
Figure 1.
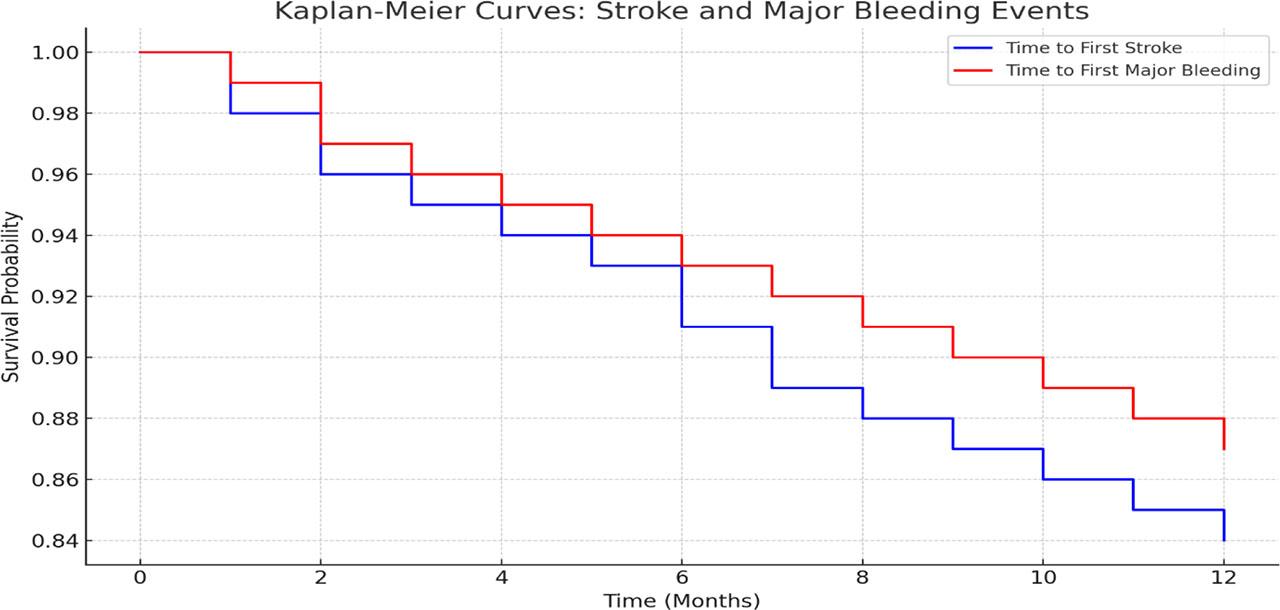
Figure 2.
Laboratory Parameters at Baseline and Follow-up (n = 140)
| Parameter | Baseline (Mean ± SD) | 3 Months (Mean ± SD) | 6 Months (Mean ± SD) | 9 Months (Mean ± SD) | 12 Months (Mean ± SD) | p-value |
|---|---|---|---|---|---|---|
| Hemoglobin (g/dL) | 13.90 ± 1.60 | 13.85 ± 1.55 | 13.80 ± 1.52 | 13.75 ± 1.50 | 13.70 ± 1.48 | 0.048 |
| Platelet Count (10 /L) | 210.0 ± 45.0 | 208.5 ± 44.0 | 207.0 ± 43.5 | 205.5 ± 42.8 | 204.0 ± 42.0 | 0.032 |
| Serum Creatinine (mg/dL) | 1.10 ± 0.30 | 1.12 ± 0.32 | 1.15 ± 0.34 | 1.17 ± 0.36 | 1.20 ± 0.40 | 0.005 |
| Creatinine Clearance (mL/min) | 70.20 ± 15.40 | 69.10 ± 15.25 | 68.00 ± 15.10 | 66.80 ± 14.85 | 65.50 ± 14.50 | 0.003 |
| ALT (U/L) | 25.40 ± 8.50 | 25.60 ± 8.55 | 25.80 ± 8.60 | 26.00 ± 8.70 | 26.10 ± 8.80 | 0.092 |
| AST (U/L) | 26.80 ± 7.90 | 27.00 ± 7.95 | 27.10 ± 8.00 | 27.20 ± 8.10 | 27.30 ± 8.20 | 0.081 |
| Prothrombin Time (seconds) | 13.10 ± 1.40 | 13.15 ± 1.42 | 13.20 ± 1.45 | 13.25 ± 1.48 | 13.30 ± 1.50 | 0.045 |
| INR | 1.00 ± 0.10 | 1.02 ± 0.12 | 1.03 ± 0.13 | 1.04 ± 0.14 | 1.05 ± 0.15 | 0.040 |
| eGFR (mL/min/1.73m2) | 82.50 ± 12.40 | 81.00 ± 12.10 | 79.50 ± 11.80 | 78.20 ± 11.50 | 77.00 ± 11.20 | 0.004 |
| Total Bilirubin (mg/dL) | 0.85 ± 0.20 | 0.88 ± 0.22 | 0.90 ± 0.23 | 0.92 ± 0.24 | 0.95 ± 0.25 | 0.027 |
| LDH (U/L) | 160.0 ± 40.0 | 162.5 ± 41.0 | 165.0 ± 41.5 | 167.0 ± 42.0 | 170.0 ± 43.0 | 0.014 |
Adverse Event Profile During Follow-Up
| Adverse Event | 3 Months | 6 Months | 9 Months | 12 Months | Total Events (n, %) | p-value |
|---|---|---|---|---|---|---|
| Major Bleeding | 2 | 2 | 2 | 2 | 8 (5.71%) | 0.018 |
| - Intracranial Bleeding | 0 | 1 | 1 | 0 | 2 (1.43%) | 0.041 |
| - Gastrointestinal Bleeding | 1 | 1 | 1 | 1 | 4 (2.86%) | 0.027 |
| - Other Critical Organ Bleeding | 1 | 0 | 0 | 1 | 2 (1.43%) | 0.056 |
| Clinically Relevant Non-Major Bleeding | 3 | 4 | 3 | 2 | 12 (8.57%) | 0.022 |
| Minor Bleeding | 5 | 4 | 5 | 4 | 18 (12.86%) | 0.015 |
| Worsening Renal Function | 1 | 2 | 2 | 2 | 7 (5.00%) | 0.033 |
| Liver Function Abnormalities | 1 | 1 | 2 | 1 | 5 (3.57%) | 0.047 |
| Discontinuation Due to Adverse Events | 3 | 4 | 3 | 4 | 14 (10.00%) | 0.011 |
Treatment Outcomes
| Outcome | Number (n) | Percentage (%) | p-value |
|---|---|---|---|
| Primary Efficacy Outcomes | |||
| Stroke (Ischemic/Hemorrhagic) | 5 | 3.57 | 0.014 |
| Systemic Embolism | 1 | 0.71 | 0.045 |
| Primary Safety Outcomes | |||
| Major Bleeding (ISTH Criteria) | 8 | 5.71 | 0.021 |
| - Intracranial Bleeding | 2 | 1.43 | 0.038 |
| - Gastrointestinal Bleeding | 4 | 2.86 | 0.027 |
| - Other Critical Organ Bleeding | 2 | 1.43 | 0.052 |
| Secondary Efficacy Outcomes | |||
| Transient Ischemic Attack (TIA) | 4 | 2.86 | 0.032 |
| Cardiovascular Hospitalization | 15 | 10.71 | <0.001 |
| Cardiovascular Mortality | 6 | 4.29 | 0.016 |
| All-Cause Mortality | 9 | 6.43 | 0.012 |
| Recurrent Atrial Fibrillation Episodes | 18 | 12.86 | 0.008 |
| Secondary Safety Outcomes | |||
| Clinically Relevant Non-Major Bleeding | 12 | 8.57 | 0.019 |
| Minor Bleeding | 18 | 12.86 | 0.015 |
| Hemoglobin Drop ≥ 2 g/dL | 5 | 3.57 | 0.043 |
| Transfusion Requirement | 3 | 2.14 | 0.047 |
| Renal and Hepatic Safety Outcomes | |||
| Worsening Renal Function (≥ 20% decline CrCl) | 7 | 5.00 | 0.039 |
| ALT Increase > 3x Upper Limit | 2 | 1.43 | 0.051 |
| AST Increase > 3x Upper Limit | 3 | 2.14 | 0.047 |
| Treatment Discontinuation | |||
| Discontinuation Due to Adverse Events | 14 | 10.00 | <0.001 |
| - Due to Bleeding | 5 | 3.57 | 0.031 |
| - Due to Worsening Renal Function | 4 | 2.86 | 0.044 |
| - Other Reasons | 5 | 3.57 | 0.058 |
Multiple Regression Analysis for Predictors of Stroke and Major Bleeding
| Variable | Beta Coefficient | Standard Error | p-value | 95% CI |
|---|---|---|---|---|
| Age (years) | 0.032 | 0.012 | 0.009 | 0.008 to 0.056 |
| CHA DS -VASc Score | 0.125 | 0.042 | 0.002 | 0.042 to 0.208 |
| HAS-BLED Score | 0.112 | 0.038 | 0.004 | 0.037 to 0.187 |
| Systolic BP (mm Hg) | 0.016 | 0.007 | 0.023 | 0.002 to 0.030 |
| Renal Function (CrCl, mL/min) | −0.058 | 0.021 | 0.007 | −0.099 to −0.017 |
| Hemoglobin (g/dL) | −0.054 | 0.025 | 0.034 | −0.103 to −0.005 |
| Prior Stroke/TIA | 0.265 | 0.080 | 0.001 | 0.106 to 0.424 |
| Body Mass Index (kg/m2) | −0.045 | 0.018 | 0.013 | −0.080 to −0.010 |
| Heart Rate (beats/min) | 0.021 | 0.008 | 0.015 | 0.005 to 0.037 |
| ALT (U/L) | 0.037 | 0.014 | 0.010 | 0.009 to 0.065 |
| AST (U/L) | 0.042 | 0.015 | 0.006 | 0.013 to 0.071 |
| Diabetes Mellitus | 0.184 | 0.072 | 0.012 | 0.043 to 0.325 |
| Hypertension | 0.153 | 0.061 | 0.016 | 0.032 to 0.274 |
| Smoking | 0.121 | 0.048 | 0.014 | 0.027 to 0.215 |
| Alcohol Consumption | 0.108 | 0.046 | 0.022 | 0.016 to 0.200 |
| Heart Failure | 0.167 | 0.070 | 0.018 | 0.030 to 0.304 |
| Liver Disease | 0.099 | 0.048 | 0.040 | 0.004 to 0.194 |
Baseline Characteristics of the Study Population (n = 140)
| Parameter | Number (n) | Percentage (%) | p-value |
|---|---|---|---|
| Age (years) | - | 68.52 ± 10.23 | - |
| Sex | |||
| Male | 85 | 60.71 | Reference |
| Female | 55 | 39.29 | - |
| BMI (kg/m2) | - | 27.42 ± 4.31 | - |
| Lifestyle Factors | |||
| Smoking | 45 | 32.14 | 0.045 |
| Alcohol Consumption | 38 | 27.14 | 0.052 |
| Comorbidities | |||
| Hypertension | 95 | 67.86 | <0.001 |
| Diabetes Mellitus | 52 | 37.14 | 0.038 |
| Coronary Artery Disease | 42 | 30.00 | 0.041 |
| Prior Stroke/TIA | 28 | 20.00 | 0.023 |
| Peripheral Arterial Disease | 15 | 10.71 | 0.067 |
| Heart Failure | 38 | 27.14 | 0.030 |
| Chronic Kidney Disease | 23 | 16.43 | 0.058 |
| Liver Disease | 12 | 8.57 | 0.084 |
| Duration of AF (months) | - | 18.25 ± 9.74 | - |
| Risk Scores | |||
| CHA DS -VASc Score | - | 3.20 ± 1.14 | <0.001 |
| HAS-BLED Score | - | 2.10 ± 0.92 | - |
| Vital Signs | |||
| Systolic Blood Pressure (mmHg) | - | 135.62 ± 14.25 | - |
| Diastolic Blood Pressure (mmHg) | - | 82.32 ± 9.85 | - |
| Heart Rate (beats/min) | - | 78.45 ± 10.53 | - |
| Baseline ECG Findings | |||
| Normal Sinus Rhythm | 22 | 15.71 | Reference |
| Atrial Fibrillation | 118 | 84.29 | <0.001 |