
1. Introduction
Skin cancer (SC), encompassing melanoma and non-melanoma subtypes such as basal cell carcinoma (BCC) and squamous cell carcinoma (SCC) [ 1 2 3], represents the most prevalent malignancy worldwide [1, 4]. The incidence of skin cancer has been increasing globally, with significant variations in occurrence and types across different geographic regions and populations. In 2019, the United States alone reported an estimated 2.8 million cases of BCC and 1.5 million cases of SCC, with 4472 deaths attributed to SCC [4]. Although deaths from BCC are rare, the high incidence rates of both BCC and SCC indicate the considerable burden of keratinocyte carcinomas (KCs). It is important to note that as KCs are not required to be reported to cancer registries, the actual incidence and mortality rates may be higher, suggesting a potential underestimation of the true impact of these cancers [5].
Melanoma, although accounting for a smaller percentage of skin cancer cases, is responsible for a significant proportion of skin cancer-related mortality [6]. This highlights the aggressive nature of melanoma and underscores the importance of early detection and effective treatment strategies. The increasing prevalence and burden of both melanoma and KCs globally necessitate enhanced research, awareness, and public health initiatives aimed at reducing the impact of skin cancer.
Plasma metabolites, encompassing both final products and intermediate substances of metabolic pathways, represent pivotal biomarkers with significant potential for elucidating the underlying pathophysiological mechanisms associated with skin cancer. Metabolomics offers a powerful approach to identifying these biomarkers, potentially enabling early detection and intervention [7, 8]. Emerging studies in this field have begun to unravel the complex metabolic alterations associated with different cancers, shedding light on potential new biomarkers for diagnosis and targets for treatment. MR studies provide a unique opportunity to explore the causal relationships between plasma metabolites and skin cancer, offering insights beyond conventional observational studies. By leveraging genetic variants associated with metabolite levels, MR studies can address confounding factors and reverse causation, thus enhancing the understanding of the etiological roles of these metabolites in skin cancer development [9]. Recent advances in this area have opened new avenues for understanding the genetic underpinnings of metabolic pathways in skin cancer pathogenesis. In recent studies, the bacterium identified as flavonoid decomposer sp90199495 has been linked to the metabolism of X-21849, a compound also implicated in the risk of pancreatic ductal adenocarcinoma (PDAC) [10]. Furthermore, comprehensive metabolic analysis has revealed a significant causal relationship between several metabolites—namely pyruvate, 1,6-anhydroglucose, nonadecanoate, 1-linoleoylglycerophosphoethanolamine, 2-hydroxystearate, and gamma-glutamylthreonine—and colorectal cancer (CRC). Notably, multivariable Mendelian randomization (MVMR) analysis has demonstrated that the genetic predispositions for elevated levels of pyruvate, 1-linoleoylglycerophosphoethanolamine, and gamma-glutamylthreonine have an independent and direct influence on CRC risk, distinct from other metabolites. These findings suggest novel biochemical pathways and potential therapeutic targets in CRC pathogenesis [11].
However, there is a notable gap in the literature regarding comprehensive Mendelian randomization studies that directly link plasma metabolites to skin cancer causation. This highlights the necessity for more rigorous and targeted research in this field to elucidate the potential causal pathways and contribute to the development of effective prevention and treatment strategies. The purpose of this study is to investigate the causal relationships between plasma metabolites and skin cancer risk using Mendelian randomization. By integrating metabolomic profiling with genetic data, we aim to identify specific metabolites that may contribute to skin cancer pathogenesis, thereby providing new insights into potential biomarkers and therapeutic targets for early detection and personalized treatment of this prevalent disease.
2. Materials and methods
2.1. Description of studies to select metabolite genetic instruments
We utilized genomic predictors for 1,400 circulating metabolites identified through a GWAS involving 8,299 individuals of European descent, who are part of the Canadian Longitudinal Study of Aging (CLSA) [12]. The CLSA is a comprehensive study tracking over 50,000 Canadians, aged 45 to 85 at the time of enrollment, to collect a wide array of data spanning biological, medical, physiological, social, lifestyle, and economic factors [13]. The current research narrows down to 8,299 non-related Europeans from the CLSA cohort, all of whom have undergone genome-wide genotyping and assessment of their plasma metabolite levels. By concentrating on participants with European backgrounds, the study aims to minimize confounding influences arising from differences in genetic population structures
2.2. Instrumental variables for plasma metabolites
Genetic variants that meet the following criteria were selected as instrumental variables (IVs) (Figure 1):
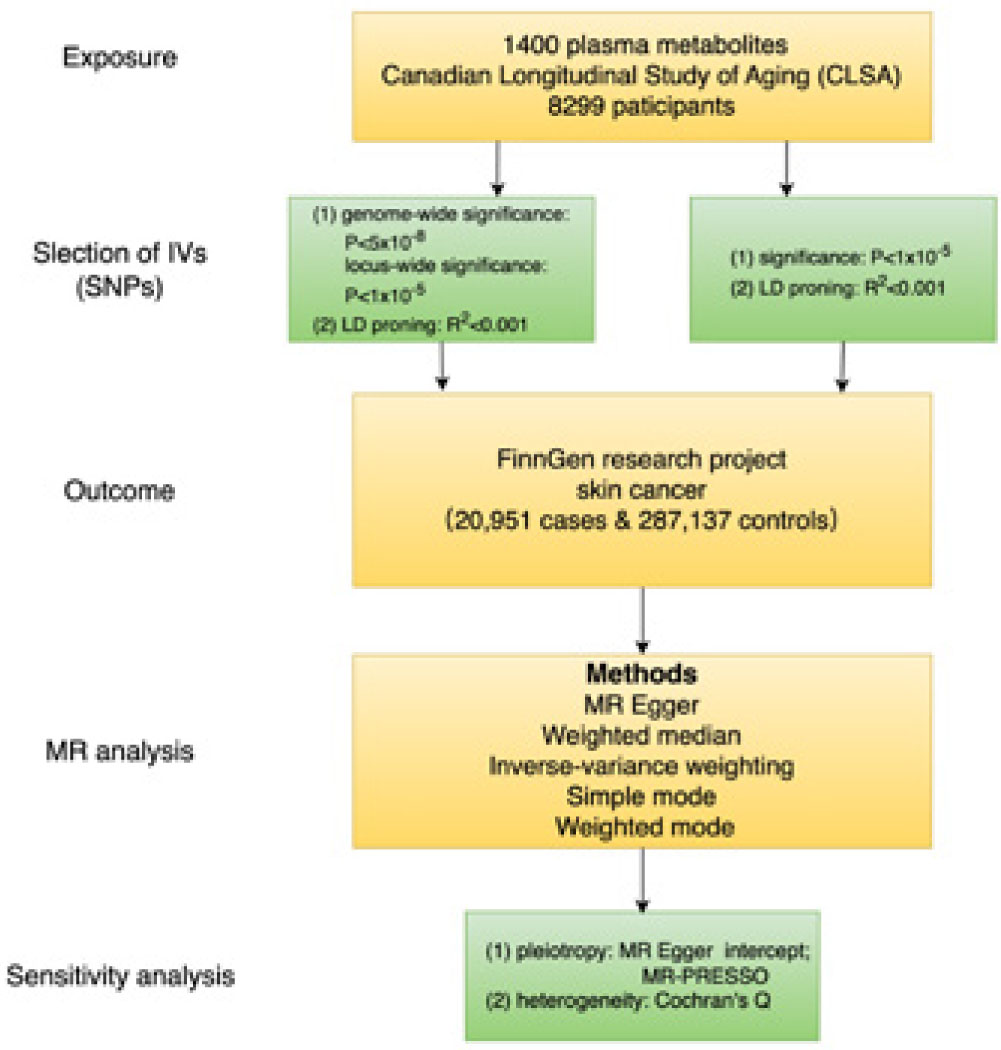
Figure 1.
Selection workflow
Initially, genetic variants were selected based on association with P < 1×10⁻⁵, a common practice in MR to enhance the variance captured, especially when limited SNPs are available for the exposure variable. Then, using a clumping process within the R software environment, we filtered for independent variants, maintaining a linkage disequilibrium threshold of r2 < 0.5 across a 5,000 kb range. Instrumental SNPs were further refined by discarding palindromic SNPs with a middle allele frequency (MAF) between 0.01 and 0.30, which can be problematic due to their ambiguity in A/T or G/C alleles. Additionally, SNPs with an MAF below 0.01 were omitted from the initial GWAS to enhance the reliability of our findings. Subsequently, the explanatory power of the instrumental variables (IVs) for metabolite levels was assessed using the R2 and F-statistic parameters. For robust MR analysis, an F-statistic exceeding 10 is generally recommended.
To determine genetic variants as suitable instrumental variables (IVs), it is imperative that three key assumptions are satisfied: (I) the genetic variant must exhibit an association with the exposure, (II) the genetic variant should not be linked with any confounders, whether they are known or unknown, and (III) the genetic variant must influence the outcome exclusively through the exposure variable, without any alternate routes. To adhere to the first assumption, we selected SNPs associated with the exposure using a genome-wide significance threshold of P < 5×10⁻⁸ as potential instruments and employed F-statistics to rule out any weak instruments, specifically those with an F-statistic lower than 10. For the third assumption, tools like MR-Egger and MR-PRESSO were utilized to evaluate horizontal pleiotropy. Regarding the second assumption, recent research suggests that while variants exhibiting horizontal pleiotropy are often considered confounders in MR analyses, they can be valuable for identifying alternative pathways of the trait under study. This can lead to a more nuanced understanding of the specific exposure-outcome hypothesis and, hence, a richer set of results. Therefore, we included all SNPs in our analysis [14].
2.3. GWAS datasets for skin cancer risk
To assess the association with skin cancer risk, we downloaded GWAS data from the FinnGen Database. After adjusting for age, sex, genetic relatedness, genotyping batch, and the first 10 principal components, we utilized 20,951 SC cases and 287,137 controls for this analysis.
2.4. Two-sample MR analysis for potential causal associations of plasma metabolites with SC risk
In the pursuit of exploring the putative causative links between plasma metabolites as the exposure and skin cancer risk as the outcome, a two-sample MR study was conducted using IVW, executed through the “TwoSampleMR” R software package. The validity of the MR findings was appraised by adopting a false discovery rate (FDR) threshold of less than 0.05. To bolster the analysis, we employed the MR-Egger intercept test and the MR Pleiotropy Residual Sum and Outlier (MR-PRESSO) global test, which aid in discerning potential horizontal pleiotropy effects and in detecting any directional pleiotropy [15, 16, 17]. Moreover, a suite of methods, including maximum likelihood, MR-Egger, simple median, and weighted median, were implemented to affirm the directionality and robustness of the results.
3. Results
3.1. Strength of the instrumental variables
The comprehensive workflow of the study is depicted in Figure 1. We studied a total of 1,400 unique quantified metabolites. Through rigorous analysis, we identified 78 instrumental variables (IVs) that have a significant causal relationship with skin cancer risk, with the number of SNPs contributing to each IV ranging from 13 to 38 (Caffeine/linoleate (18:2n6) had the fewest IVs with 13 SNPs; X-23654 had the most with 38 SNPs). These IVs accounted for between 0.0023 and 0.17596 of the variances in their respective metabolites. Furthermore, the lowest F-statistic among these IVs was 19.51, indicating that all IVs were adequately robust for the MR analysis of the 78 metabolites, well above the commonly accepted threshold of an F-statistic greater than 10 (Additional file 1: Table S1).
3.2. Causality of genetically determined metabolites on skin cancer
The IVW method was utilized to establish the causal relationships between 1,400 metabolites and skin cancer, using GWAS data from the FinnGen Database (Risteys FinnGen R9). In total, 78 metabolites displayed notable causative associations with skin cancer at a PIVW < 0.05, as depicted in the forest plot (Additional file 2: Figure. S1). Additional file 3: Table S2 lists the plasma metabolites significantly associated with skin cancer as identified in the GWAS datasets. Additional file 1: Table S1 presents the characteristics of SNPs, including their genetic correlations with plasma metabolites and skin cancer. Among these, 36 metabolites were shown to significantly reduce the risk of skin cancer, while 42 metabolites exhibited a significant positive correlation with the disease (Additional file 4: Table S3). For these 78 metabolites, the MR-Egger analysis, weighted median analysis, simple mode analysis, and weighted mode analysis all indicated trends consistent with the IVW analysis. This consistency across different analytical approaches suggests robustness in the findings. For example, 1-arachidonylglycerol (20:4) displayed the following associations: (MR-Egger, p = 0.02, OR = 1.13, 95% CI 1.03 - 1.25; IVW, p = 0.0004, OR = 1.09, 95% CI 1.04 - 1.15), indicating a consistent trend across analyses (Figure. 2).
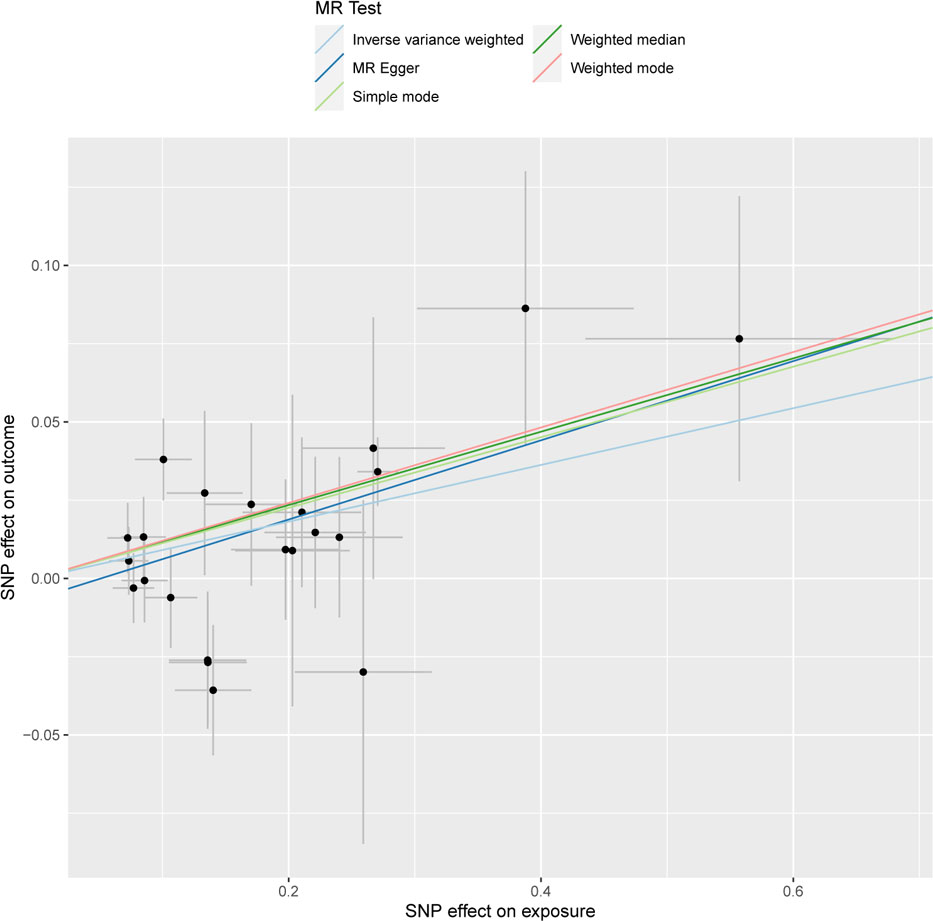
Figure 2.
Scatter plot of 1-arachidonylglycerol
3.3. Sensitivity analyses
Horizontal pleiotropy was not deemed a significant issue for the vast majority of the metabolites identified, as indicated by the MR-Egger intercept (if PEgger-Intercept > 0.05) or the MR-PRESSO global test for pleiotropy (if PGlobalTest > 0.05). Notable exceptions such as metabolite X-12117, which had a PEgger-Intercept of 0.043, and gamma-glutamylthreonine as well as Picolinoylglycine, both of which had a PGlobalTest of less than 0.001 (Table 1). Sensitivity analyses confirmed the consistent direction of association for all 78 metabolites. The “leave-one-out” methodology further reinforced that the MR analysis was robust, and no single SNP was influential enough to skew the results significantly. Moreover, Cochran’s Q statistic suggested that significant heterogeneity was absent in the majority of cases, except for 9 plasma metabolites (Table 2). All results collectively reinforce the relative reliability of the causal association between these 78 plasma metabolites and skin cancer. We did not conduct a PhenoScanner search, as our aim, as previously mentioned, was to achieve as comprehensive a set of results as possible. Furthermore, the reverse MR analysis revealed a significant causal association between 2-hydroxyoctanoate (outcome) and skin cancer (exposure), with an odds ratio (OR) of 0.96, a confidence interval (CI) of 0.92 – 0.99, and a PIVW of 0.038. No significant heterogeneity or pleiotropy was detected between the two, and sensitivity analyses verified the consistent direction of 2-hydroxyoctanoate.
Table 1.
Metabolites with significant pleiotropy
| Metabolites | Methods | P |
|---|---|---|
| X-12117 | Egger Intercept | 0.043 |
| X-13695 | Egger Intercept | 0.049 |
| Oleoyl-linoleoyl-glycerol (18:1 to 18:2) [2] / linoleoyl-arachidonoyl-glycerol (18:2 to 20:4) [2] | Egger Intercept | 0.024 |
| Adenosine 5′-diphosphate (ADP) / cytidine | Egger Intercept | 0.025 |
| Caffeine / linoleate (18:2n6) | Egger Intercept | 0.047 |
| Gamma-glutamylthreonine | Global Test | <0.001 |
| Picolinoylglycine | Global Test | <0.001 |
| Hydroxypalmitoyl sphingomyelin (d18:1/16:0(OH)) | Global Test | 0.012 |
| Cysteinylglycine | Global Test | 0.017 |
| Hypotaurine | Global Test | 0.011 |
| Cortisone / 4-cholesten-3-one | Global Test | 0.029 |
| Hypotaurine / cysteine | Global Test | 0.003 |
| Retinol (Vitamin A) / linoleoyl-arachidonoyl-glycerol (18:2 to 20:4) [2] | Global Test | 0.011 |
Table 2.
Metabolites with significant heterogeneity (MR Egger or Inverse variance weighted)
| Metabolites | Method | Q | Q_df | Q_pval |
|---|---|---|---|---|
| 1-stearoyl-2-oleoyl-gpc (18:0/18:1) | MR Egger | 45.43 | 31 | 0.045 * |
| 1-stearoyl-2-oleoyl-gpc (18:0/18:1) | Inverse variance weighted | 45.62 | 32 | 0.056 |
| 2-hydroxyarachidate | MR Egger | 39.57 | 20 | 0.006* |
| 2-hydroxyarachidate | Inverse variance weighted | 47.17 | 21 | 0.001* |
| Hydroxypalmitoyl sphingomyelin (d18:1/16:0(OH)) | MR Egger | 48.40 | 29 | 0.013* |
| Hydroxypalmitoyl sphingomyelin (d18:1/16:0(OH)) | Inverse variance weighted | 48.54 | 30 | 0.017* |
| Cysteinylglycine | MR Egger | 31.72 | 17 | 0.016* |
| Cysteinylglycine | Inverse variance weighted | 34.74 | 18 | 0.01* |
| Hypotaurine | MR Egger | 45.67 | 26 | 0.01* |
| Hypotaurine | Inverse variance weighted | 45.74 | 27 | 0.013* |
| X-13431 | MR Egger | 39.43 | 25 | 0.033* |
| X-13431 | Inverse variance weighted | 39.52 | 26 | 0.043* |
| Cortisone / 4-cholesten-3-one | MR Egger | 39.82 | 29 | 0.087 |
| Cortisone / 4-cholesten-3-one | Inverse variance weighted | 43.83 | 30 | 0.049* |
| Hypotaurine / cysteine | MR Egger | 54.17 | 31 | 0.006* |
| Hypotaurine / cysteine | Inverse variance weighted | 55.86 | 32 | 0.005* |
| Retinol (Vitamin A) / linoleoyl-arachidonoyl-glycerol (18:2 to 20:4) [2] | MR Egger | 42.15 | 22 | 0.006* |
| Retinol (Vitamin A) / linoleoyl-arachidonoyl-glycerol (18:2 to 20:4) [2] | Inverse variance weighted | 43.13 | 23 | 0.006* |
4. Discussion
This Mendelian randomization study provides an unbiased assessment of the causal links between 1,400 plasma metabolites and skin cancer. We pinpointed 78 metabolites associated with the risk of skin cancer by employing genetic variants as investigative tools. Of these, 36 metabolites were found to significantly decrease the risk of skin cancer, while 42 showed a significant positive correlation with the disease. Reverse MR analysis also revealed a causal relationship between 2-hydroxyoctanoate and skin cancer, supporting the reliability of the analysis.
To our knowledge, this is the first MR study to assess the causal relationships between the latest set of 1,400 plasma metabolites and skin cancer. Previous studies have identified significant causal associations between plasma metabolites and various malignancies, which could help clarify the metabolic characteristics of cancers and further assess the potential role of metabolites in cancer risk evaluation. One Mendelian randomization study indicated a significant causal relationship between blood metabolites and pancreatic ductal adenocarcinoma (PDAC). Out of 483 metabolites, 44 unique metabolites were found to be significantly associated with PDAC risk, with the top four ranked as X:12798, X:11787, X:11308, and X:19141 [18]. Similarly, in a study on colorectal cancer (CRC), 6 out of 486 blood metabolites were found to have significant causal links with CRC. Multivariate MR analysis revealed that pyruvate, 1-linoleoylglycerophosphoethanolamine, and gamma-glutamylthreonine could independently influence CRC, aside from other metabolites [11]. Additionally, in breast cancer, researchers found two blood metabolites, high-density lipoprotein cholesterol (HDL-C) and acetate, to have present causal associations (from an analysis of 112 blood metabolites and 147,827 European individuals). In this MR study, the authors suggested that HDL-C and acetate might be promising targets for preventing breast cancer, though their advantages and disadvantages should be carefully considered [19]. For skin cancer, past research has hinted that a causal relationship may exist between childhood sunburn and the risk of malignant melanoma (MM) and non-melanoma skin cancer (NMSC), suggesting that enhancing screening and prevention of childhood sunburn could aid in the early detection and reduction of MM and NMSC risks [20]. Conventional carcinogenic factors, such as smoking, have also been found to have a significant causal link with skin cancer [21]. However, there is currently a lack of research on the causal relationship between metabolites and skin cancer. Our study’s initial findings indicate a causal relationship between plasma metabolites and skin cancer, suggesting that plasma metabolites may have predictive significance for the progression and prognosis of skin cancer. Our study fills a gap in the research on the correlation between plasma metabolites and skin cancer, indicating that from the perspective of metabolites, there is potential to provide new insights into the pathogenic mechanisms of skin cancer.
Previous research indicates that plasma metabolites play a crucial role in the pathogenesis and progression of cancer. For instance, it has been observed that patients with advanced cancer cachexia typically exhibit lower levels of triglycerides, a phenomenon attributed to enhanced triglyceride hydrolysis within the body [ 22, 23 24]. However, our study did not detect a significant reduction in triglycerides, possibly due to the inclusion of a study sample that was not limited to patients with advanced melanoma. Our analysis identified 78 metabolites associated with the risk of melanoma. Arachidonic acid, an omega-6 fatty acid prevalent in cell membranes, is primarily synthesized from dietary linoleic acid, an essential fatty acid, and serves as a precursor for inflammatory mediators such as leukotrienes [25, 26]. The conversion of linoleic acid to arachidonic acid is regulated by the rate-limiting enzyme Δ6-desaturase, and increasing blood concentrations of linoleic acid does not significantly impact arachidonic acid production. Consequently, the level of arachidonic acid typically remains stable. However, our study revealed that an elevated ratio of arachidonic acid to linoleic acid correlates with an increased risk of melanoma. This finding suggests that tumor-induced immune responses may consume substantial amounts of arachidonic acid for the synthesis of leukotrienes and other inflammatory mediators, thereby reducing linoleic acid levels and increasing the arachidonic acid to linoleic acid ratio [27, 28]. Additionally, we observed a correlation between increased serum caffeine levels and melanoma risk. Notably, an elevated ratio of caffeine to linoleate (18:2n6) is positively associated with melanoma risk, whereas an increased ratio of caffeine to theophylline is inversely related to melanoma risk. The former association may be due to the disproportionate consumption of linoleate, whereas the latter requires further investigation. Increased caffeine intake might potentially reduce melanoma incidence.
To ascertain genetic variants as suitable instrumental variables (IVs), three foundational assumptions must be fulfilled: (I) the genetic variant should be associated with the exposure, (II) the genetic variant must not be linked with any known or unknown confounders, and (III) the genetic variant should influence the outcome solely through the exposure, not via alternative pathways. For assumption II, the most common approach is to use PhenoScanner (http://www.phenoscanner.medschl.cam.ac.uk/) to examine all SNPs, then exclude those that violate assumption II, and reanalyze the remaining SNPs to prevent horizontal pleiotropy. However, Cho et al. have recently developed a framework named MR-TRYX that utilizes horizontal pleiotropy to identify potential risk factors for diseases. They note that outlier removal methods might introduce bias or increase the rate of type I errors. The applications of MR-TRYX include two goals: firstly, to identify factors that may influence the outcome independently of the exposure, using outliers from the original exposure-outcome analysis; and secondly, to reestimate the original exposure-outcome association by adjusting for outlier SNPs and the horizontal pleiotropic pathways they introduce [14]. The authors reanalyzed some previous studies. For instance, several MR studies have examined the inflated effect of urate on coronary heart disease (CHD), which seemed to be affected by pleiotropy [29, 30]. Researchers found a more substantial causal association between urate and CHD after removing outliers, but this was accompanied by a doubling of heterogeneity. The adjusted scatter plot showed that outliers moved closer to the fitted line after controlling for the SNP effect on candidate traits. Thus, the authors believe that outlier removal may solidify evidence that could lead to incorrect conclusions. In terms of education and health outcomes, the relationship between education and health is well-established in the social sciences. It is generally believed that in high-income countries, higher socioeconomic status leads to a reduced risk of obesity [31, 32]. The authors used 59 independent genetic instruments to estimate the effect of years of schooling on body mass index (BMI) [33, 34], and all MR methods indicated a positive causal effect of education on BMI. Three outliers identified in this analysis were rs6882046, rs4800490, and rs8049439, which were pinpointed as major sources of heterogeneity. Although a 48% reduction in heterogeneity was observed when removing outliers, the authors noted that rs4800490 deviated from the fitted line after adjusting for pleiotropic pathways in the scatter plot. This indicates that if the outlier is caused by a pleiotropic pathway, then the estimation of its indirect effect is inaccurate (e.g., when GWAS summary statistics cannot identify other influential pleiotropic pathways). Therefore, we included all SNPs in our analysis, acknowledging that this could introduce some heterogeneity, but it is beneficial for achieving a more comprehensive set of results.
The strengths of our study lie in the utilization of high-quality metabolomics data, which has allowed for the identification of plasma metabolite associations with skin cancer (SC), thereby broadening our understanding of the disease’s genetic architecture. Additionally, the relatively new approach of two-sample MR leverages the associations between genetic instrumental variables (IVs) and exposures. GWAS summary data also enhances the statistical power in two-sample MR [35], setting the stage for future mechanistic studies and hinting at the potential for metabolomic interventions in skin cancer.
5. Conclusions
In conclusion, this study advances our understanding of skin cancer’s biological underpinnings by using a two-sample Mendelian randomization analysis to establish causal relationships between plasma metabolites and skin cancer risk. The significant associations discovered between numerous metabolites and skin cancer risk highlight the potential of metabolomics in identifying biomarkers for early detection and treatment. This research not only provides insights into the complex pathophysiology of skin cancer but also paves the way for personalized medicine, emphasizing the integration of genetic and metabolomic data. Future research should further explore the functions of these metabolites and their roles in the development of skin cancer, contributing to the development of new diagnostic and therapeutic strategies.
6. Limitations of the study
Several limitations must be considered for an accurate interpretation of our findings. First, skin cancer can be classified into melanoma and non-melanoma types; our study analyzed skin cancer as a whole. Hence, future research should aim for a more comprehensive investigation of skin cancer subtypes. Second, we have preliminarily identified 78 plasma metabolites associated with skin cancer, but the metabolic pathways of these metabolites were not elucidated in this analysis; future studies based on our results will delve deeper into these pathways. Third, while MR is proven to be an effective method for assessing causal relationships between human plasma metabolites and skin cancer, these findings should be verified through further research based on experimental data. Fourth, the validity of MR analysis greatly depends on the explanatory power of the IVs for the exposure, necessitating an expansion of the sample size to provide a more accurate assessment of the genetic influence on metabolites. Fifth, considering the data currently available in public databases, the data for European populations is relatively more comprehensive. This study only investigated European populations. Future research needs to focus on different ethnic groups. Finally, although this study identified multiple plasma metabolites contributing to skin cancer risk, additional research is needed to uncover their roles in the pathogenic mechanisms of the disease.
Abbreviations
- SC
skin cancer
- MR
Mendelian randomization
- GWAS
genome-wide association study
- CLSA
Canadian Longitudinal Study of Aging
- IVW
inverse-variance weighted
- BCC
basal cell carcinoma
- SCC
squamous cell carcinoma
- KCs
keratinocyte carcinomas
- PDAC
pancreatic ductal adenocarcinoma
- CRC
colorectal cancer
- MVMR
multivariable Mendelian randomization
- IVs
instrumental variables
- MR-PRESSO
MR - Pleiotropy Residual Sum and Outlier
- OR
odds ratio
- CI
confidence interval
- HDL-C
high-density lipoprotein cholesterol
- MM
malignant melanoma
- NMSC
non-melanoma skin cancer
- CHD
coronary heart disease
- BMI
body mass index
Notes
[2] Contributed by Authors’ contributions
Kaymin Wu, design of the study; Youwu He, analysis of data; Ailian Hua, writing of the manuscript; Yi Yao, revision of the manuscript.
[3] Financial disclosure Funding
Zhejiang Province Traditional Chinese Medicine and Health Science and Technology Plan Project.
[4] Conflicts of interest Conflict of interest
The authors have no potential conflicts of interest to declare.
[5] Availability of data and materials
The datasets generated and/or analyzed during the current study are available in the Finn Gen and GWAS Catlog repository, https://www.finngen.fi/en, https://www.ebi.ac.uk/gwas/.
Notes
Supplementary Material
The online version of this article: (DOI: 10.2478/ahem-2004-0007) offers supplementary material.
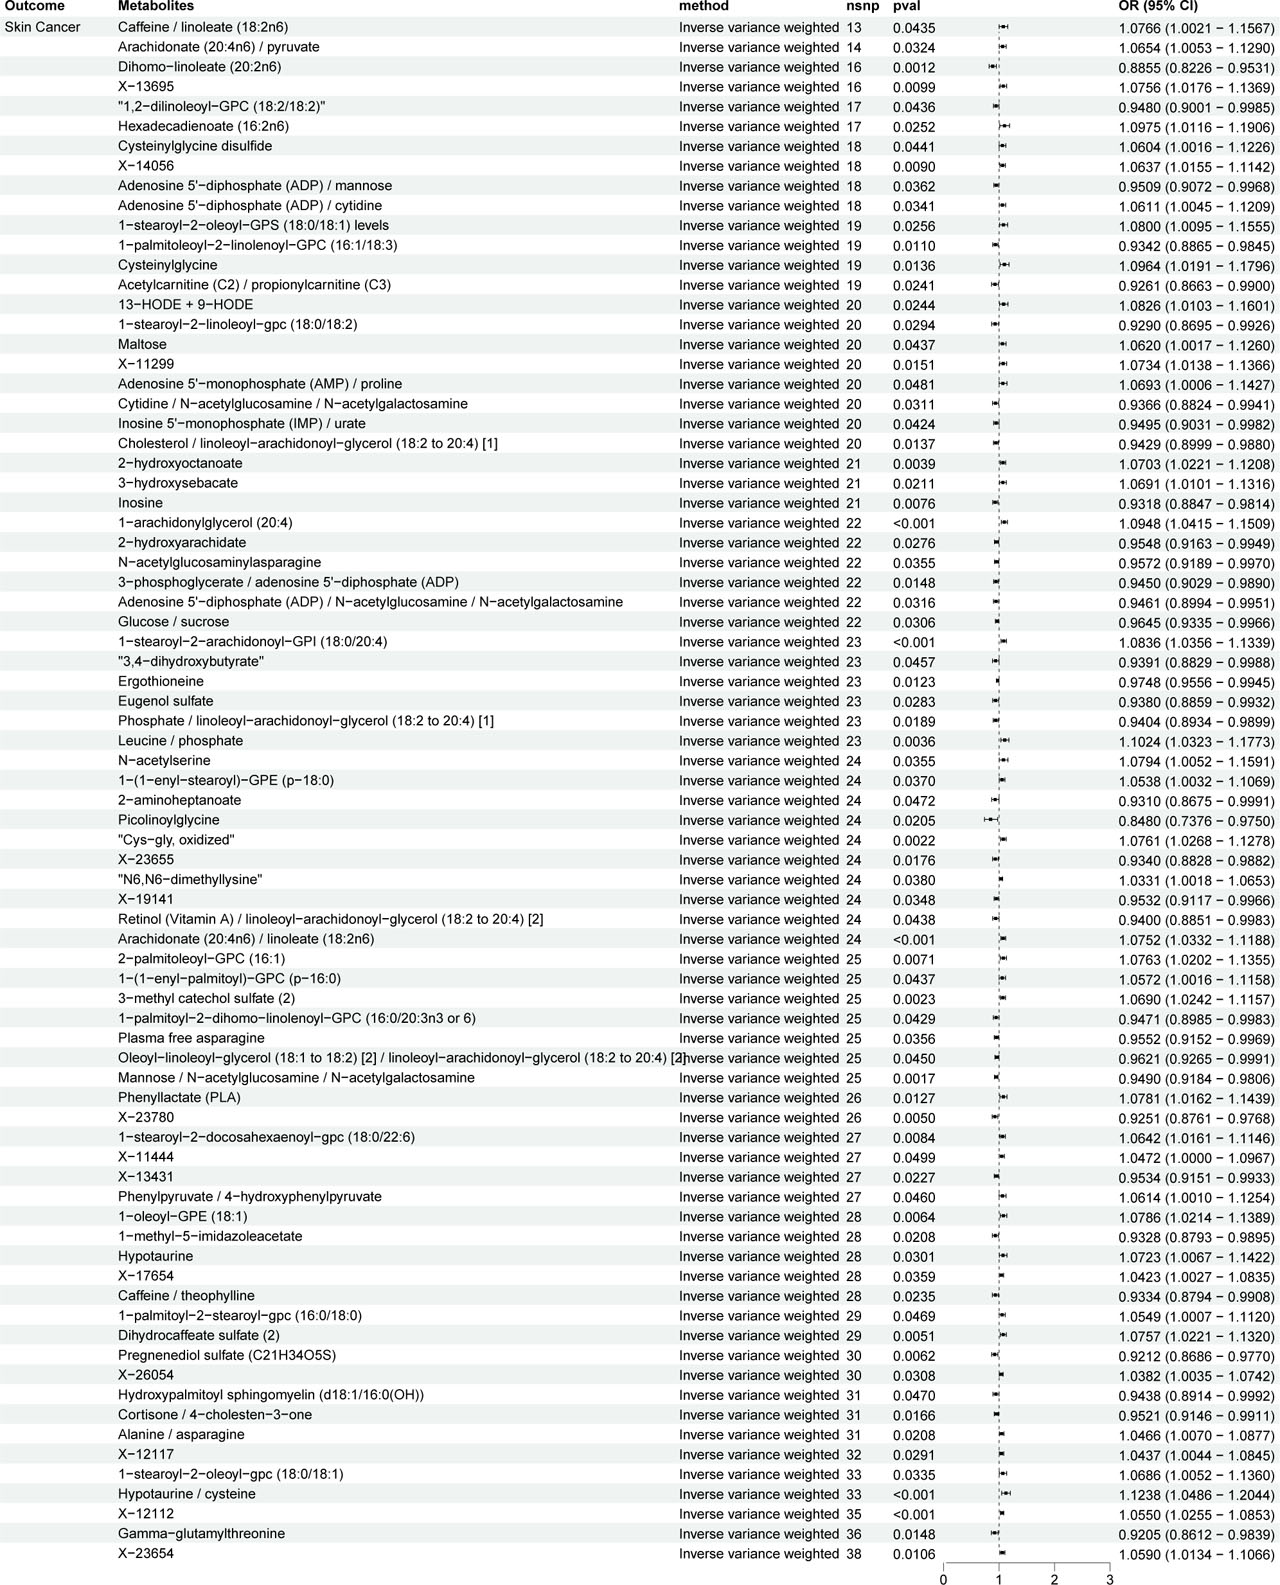
Figure S1.
Forrest plot of Plasma metabolites significantly associated with skin cancer (IVW)
Table S2.
Plasma metabolites significantly associated with skin cancer
| id | Metabolites | pvalue |
|---|---|---|
| GCST90199649 | 1-stearoyl-2-arachidonoyl-GPI (18:0/20:4) | 0,00051977 |
| GCST90199652 | 1-stearoyl-2-oleoyl-GPS (18:0/18:1) | 0,02555615 |
| GCST90199664 | Phenyllactate (PLA) | 0,01272859 |
| GCST90199681 | 2-hydroxyoctanoate | 0,00388752 |
| GCST90199704 | 3-hydroxysebacate | 0,02108698 |
| GCST90199749 | Gamma-glutamylthreonine | 0,01482424 |
| GCST90199770 | 1-arachidonylglycerol (20:4) | 0,00037937 |
| GCST90199790 | 2-palmitoleoyl-GPC (16:1) | 0,00713541 |
| GCST90199794 | 1-oleoyl-GPE (18:1) | 0,0064445 |
| GCST90199816 | 3,4-dihydroxybutyrate | 0,0457161 |
| GCST90199828 | N-acetylserine | 0,03545266 |
| GCST90199861 | Pregnenediol sulfate (C21H34O5S) | 0,00620384 |
| GCST90199875 | 13-HODE + 9-HODE | 0,02436659 |
| GCST90199879 | Ergothioneine | 0,0122909 |
| GCST90199883 | Cysteinylglycine disulfide | 0,04409296 |
| GCST90199899 | 1-(1-enyl-palmitoyl)-GPC (p-16:0) | 0,04371435 |
| GCST90199901 | 1-methyl-5-imidazoleacetate | 0,02084982 |
| GCST90199910 | 1-(1-enyl-stearoyl)-GPE (p-18:0) | 0,03700612 |
| GCST90199936 | 3-methyl catechol sulfate (2) | 0,00225296 |
| GCST90199952 | 2-aminoheptanoate | 0,0471971 |
| GCST90199986 | Eugenol sulfate | 0,02831923 |
| GCST90200028 | 1-stearoyl-2-oleoyl-gpc (18:0/18:1) | 0,03353492 |
| GCST90200030 | 1,2-dilinoleoyl-GPC (18:2/18:2) | 0,04356157 |
| GCST90200037 | 1-stearoyl-2-linoleoyl-gpc (18:0/18:2) | 0,02938405 |
| GCST90200041 | 1-palmitoyl-2-stearoyl-gpc (16:0/18:0) | 0,04687286 |
| GCST90200046 | 1-stearoyl-2-docosahexaenoyl-gpc (18:0/22:6) | 0,00835308 |
| GCST90200051 | 1-palmitoyl-2-dihomo-linolenoyl-GPC (16:0/20:3n3 or 6) | 0,04290723 |
| GCST90200102 | 1-palmitoleoyl-2-linolenoyl-GPC (16:1/18:3) | 0,01098387 |
| GCST90200104 | Hexadecadienoate (16:2n6) | 0,02519585 |
| GCST90200161 | 2-hydroxyarachidate | 0,02755643 |
| GCST90200222 | Dihydrocaffeate sulfate (2) | 0,00510208 |
| GCST90200234 | Picolinoylglycine | 0,0205488 |
| GCST90200243 | Hydroxypalmitoyl sphingomyelin (d18:1/16:0(OH)) | 0,04697794 |
| GCST90200316 | N-acetylglucosaminylasparagine | 0,03549567 |
| GCST90200319 | Cys-gly, oxidized | 0,00216651 |
| GCST90200320 | Dihomo-linoleate (20:2n6) | 0,00119897 |
| GCST90200364 | Cysteinylglycine | 0,01360229 |
| GCST90200379 | Hypotaurine | 0,03014081 |
| GCST90200394 | Inosine | 0,00761015 |
| GCST90200447 | Maltose | 0,04370196 |
| GCST90200452 | Plasma free asparagine | 0,03560774 |
| GCST90200462 | X-11299 | 0,01505161 |
| GCST90200474 | X-11444 | 0,04987119 |
| GCST90200488 | X-12117 | 0,02906436 |
| GCST90200524 | X-13695 | 0,00992943 |
| GCST90200526 | X-14056 | 0,00904827 |
| GCST90200547 | X-17654 | 0,03591522 |
| GCST90200596 | X-23655 | 0,01764105 |
| GCST90200601 | X-23654 | 0,01063422 |
| GCST90200614 | X-23780 | 0,00499579 |
| GCST90200672 | X-26054 | 0,03080663 |
| GCST90200696 | N6,N6-dimethyllysine | 0,03796103 |
| GCST90200708 | X-12112 | 0,00021692 |
| GCST90200710 | X-13431 | 0,02265676 |
| GCST90200711 | X-19141 | 0,03481623 |
| GCST90200717 | 3-phosphoglycerate / adenosine 5′-diphosphate (ADP) | 0,01479885 |
| GCST90200731 | Adenosine 5′-diphosphate (ADP) / mannose | 0,03623322 |
| GCST90200733 | Adenosine 5′-diphosphate (ADP) / N-acetylglucosamine / N-acetylgalactosamine | 0,03158844 |
| GCST90200739 | Adenosine 5′-monophosphate (AMP) / proline | 0,0480536 |
| GCST90200749 | Arachidonate (20:4n6) / pyruvate | 0,03241957 |
| GCST90200795 | Oleoyl-linoleoyl-glycerol (18:1 to 18:2) [2] / linoleoyl-arachidonoyl-glycerol (18:2 to 20:4) [2] | 0,0450439 |
| GCST90200876 | Cortisone / 4-cholesten-3-one | 0,01656538 |
| GCST90200884 | Mannose / N-acetylglucosamine / N-acetylgalactosamine ratio | 0,00172666 |
| GCST90200886 | Phenylpyruvate / 4-hydroxyphenylpyruvate | 0,04604498 |
| GCST90200895 | Hypotaurine / cysteine | 0,00096089 |
| GCST90200904 | Phosphate / linoleoyl-arachidonoyl-glycerol (18:2 to 20:4) [1] | 0,01887088 |
| GCST90200908 | Retinol (Vitamin A) / linoleoyl-arachidonoyl-glycerol (18:2 to 20:4) [2] | 0,04377634 |
| GCST90200913 | Glucose / sucrose | 0,03063799 |
| GCST90200919 | Caffeine / theophylline | 0,023528 |
| GCST90200934 | Acetylcarnitine (C2) / propionylcarnitine (C3) | 0,02407541 |
| GCST90200952 | Adenosine 5′-diphosphate (ADP) / cytidine | 0,03408387 |
| GCST90200956 | Cytidine / N-acetylglucosamine / N-acetylgalactosamine ratio | 0,031094 |
| GCST90200963 | Inosine 5′-monophosphate (IMP) / urate | 0,04239604 |
| GCST90200971 | Leucine / phosphate | 0,00364409 |
| GCST90200979 | Arachidonate (20:4n6) / linoleate (18:2n6) | 0,0003571 |
| GCST90200981 | Caffeine / linoleate (18:2n6) | 0,04354453 |
| GCST90200983 | Cholesterol / linoleoyl-arachidonoyl-glycerol (18:2 to 20:4) [1] | 0,01367908 |
| GCST90200992 | Alanine / asparagine | 0,02078138 |
Table S3.
Plasma metabolites increase and decrease skin cancer risk
| Metabolites | method | nsnp | pval | or | or_lci95 | or_uci95 |
|---|---|---|---|---|---|---|
| Caffeine / linoleate (18:2n6) | Inverse variance weighted | 13 | 0,043545 | 1,076646 | 1,002141 | 1,15669 |
| Arachidonate (20:4n6) / pyruvate | Inverse variance weighted | 14 | 0,03242 | 1,065368 | 1,005318 | 1,129004 |
| X-13695 | Inverse variance weighted | 16 | 0,009929 | 1,075629 | 1,017637 | 1,136926 |
| Hexadecadienoate (16:2n6) | Inverse variance weighted | 17 | 0,025196 | 1,097468 | 1,011634 | 1,190584 |
| Cysteinylglycine disulfide | Inverse variance weighted | 18 | 0,044093 | 1,060359 | 1,00155 | 1,122622 |
| X-14056 | Inverse variance weighted | 18 | 0,009048 | 1,063733 | 1,01551 | 1,114245 |
| Adenosine 5′-diphosphate (ADP) / cytidine | Inverse variance weighted | 18 | 0,034084 | 1,061076 | 1,00446 | 1,120882 |
| 1-stearoyl-2-oleoyl-GPS (18:0/18:1) levels | Inverse variance weighted | 19 | 0,025556 | 1,080005 | 1,009451 | 1,15549 |
| Cysteinylglycine | Inverse variance weighted | 19 | 0,013602 | 1,09644 | 1,019119 | 1,179626 |
| 13-HODE + 9-HODE | Inverse variance weighted | 20 | 0,024367 | 1,082627 | 1,010325 | 1,160103 |
| Maltose | Inverse variance weighted | 20 | 0,043702 | 1,062032 | 1,0017 | 1,125997 |
| X-11299 | Inverse variance weighted | 20 | 0,015052 | 1,073446 | 1,01383 | 1,136568 |
| Adenosine 5′-monophosphate (AMP) / proline | Inverse variance weighted | 20 | 0,048054 | 1,069258 | 1,000572 | 1,142658 |
| 2-hydroxyoctanoate | Inverse variance weighted | 21 | 0,003888 | 1,070316 | 1,022062 | 1,120849 |
| 3-hydroxysebacate | Inverse variance weighted | 21 | 0,021087 | 1,069122 | 1,01009 | 1,131605 |
| 1-arachidonylglycerol (20:4) | Inverse variance weighted | 22 | 0,000379 | 1,094837 | 1,041475 | 1,150933 |
| 1-stearoyl-2-arachidonoyl-GPI (18:0/20:4) | Inverse variance weighted | 23 | 0,00052 | 1,083601 | 1,035561 | 1,13387 |
| Leucine / phosphate | Inverse variance weighted | 23 | 0,003644 | 1,102396 | 1,032277 | 1,177277 |
| N-acetylserine | Inverse variance weighted | 24 | 0,035453 | 1,079408 | 1,005215 | 1,159077 |
| 1-(1-enyl-stearoyl)-GPE (p-18:0) | Inverse variance weighted | 24 | 0,037006 | 1,053769 | 1,003161 | 1,106929 |
| Cys-gly, oxidized | Inverse variance weighted | 24 | 0,002167 | 1,076121 | 1,026824 | 1,127786 |
| N6,N6-dimethyllysine | Inverse variance weighted | 24 | 0,037961 | 1,033057 | 1,001808 | 1,06528 |
| Arachidonate (20:4n6) / linoleate (18:2n6) | Inverse variance weighted | 24 | 0,000357 | 1,075175 | 1,033228 | 1,118825 |
| 2-palmitoleoyl-GPC (16:1) | Inverse variance weighted | 25 | 0,007135 | 1,076291 | 1,020161 | 1,135508 |
| 1-(1-enyl-palmitoyl)-GPC (p-16:0) | Inverse variance weighted | 25 | 0,043714 | 1,057154 | 1,001567 | 1,115827 |
| 3-methyl catechol sulfate (2) | Inverse variance weighted | 25 | 0,002253 | 1,068963 | 1,024187 | 1,115697 |
| Phenyllactate (PLA) | Inverse variance weighted | 26 | 0,012729 | 1,078143 | 1,016175 | 1,143889 |
| 1-stearoyl-2-docosahexaenoyl-gpc (18:0/22:6) | Inverse variance weighted | 27 | 0,008353 | 1,064194 | 1,01611 | 1,114554 |
| X-11444 | Inverse variance weighted | 27 | 0,049871 | 1,047225 | 1,000025 | 1,096652 |
| Phenylpyruvate / 4-hydroxyphenylpyruvate | Inverse variance weighted | 27 | 0,046045 | 1,061408 | 1,001046 | 1,125409 |
| 1-oleoyl-GPE (18:1) | Inverse variance weighted | 28 | 0,006444 | 1,078553 | 1,021441 | 1,138858 |
| Hypotaurine | Inverse variance weighted | 28 | 0,030141 | 1,072348 | 1,006731 | 1,142242 |
| X-17654 | Inverse variance weighted | 28 | 0,035915 | 1,042319 | 1,002728 | 1,083474 |
| 1-palmitoyl-2-stearoyl-gpc (16:0/18:0) | Inverse variance weighted | 29 | 0,046873 | 1,054884 | 1,000738 | 1,111959 |
| Dihydrocaffeate sulfate (2) | Inverse variance weighted | 29 | 0,005102 | 1,075662 | 1,022132 | 1,131995 |
| X-26054 | Inverse variance weighted | 30 | 0,030807 | 1,038238 | 1,003474 | 1,074207 |
| Alanine / asparagine | Inverse variance weighted | 31 | 0,020781 | 1,046554 | 1,006951 | 1,087715 |
| X-12117 | Inverse variance weighted | 32 | 0,029064 | 1,043675 | 1,00437 | 1,084519 |
| 1-stearoyl-2-oleoyl-gpc (18:0/18:1) | Inverse variance weighted | 33 | 0,033535 | 1,068588 | 1,005182 | 1,135993 |
| Hypotaurine / cysteine | Inverse variance weighted | 33 | 0,000961 | 1,1238 | 1,048573 | 1,204424 |
| X-12112 | Inverse variance weighted | 35 | 0,000217 | 1,054967 | 1,025471 | 1,085311 |
| X-23654 | Inverse variance weighted | 38 | 0,010634 | 1,058993 | 1,013429 | 1,106605 |