
Table 1.
Sample structure
| Question | Frequency | Percent |
|---|---|---|
| Gender | N | % |
| Male | 27 | 35.5 |
| Female | 49 | 64.5 |
| Age group | N | % |
| 18–30 | 5 | 6.6 |
| 31–40 | 21 | 27.6 |
| 41–50 | 29 | 38.2 |
| 51–60 | 17 | 22.4 |
| >60 | 4 | 5.3 |
Table 2.
Prevalence of FS according to type of shoulder MSD
| Type of shoulder disorder | FS yes | FS | Total |
|---|---|---|---|
| n (%) | n (%) | n (%) | |
| Rotator cuff injury | 42 (95.5) | 2 (4.5) | 44 (57.9) |
| Impingement syndrome | 29 (90.6) | 3 (9.4) | 32 (42.1) |
| Total | 71 (93.4) | 5 (6.6) | 76 (100) |
| Pearson χ2 | 0.703 | df = 1 | p = 0.402 |
| Fisher’s exact test | p = 0.644 |
Table 3.
Descriptive statistics and correlation between pain severity and movement limitations
| Variable | Mean | SD | Minimum | Maximum |
|---|---|---|---|---|
| Severity of shoulder pain | 6.53 | 2.32 | 1 | 10 |
| Movement limitations | 3.51 | 1.39 | 1 | 6 |
| Pearson correlation (r) | 0.685 | |||
| p-value | <0.001 | |||
| Normality test (Shapiro–Wilk p-value) | 0.542–0.866 (all subgroups, p > 0.05) | |||
Table 4.
Logistic regression analysis of factors associated with FS: standard ML estimates and Firth penalised logistic regression estimates
| Predictor (reference category) | ML: B (SE) | ML p-value | Firth: B (SE) | OR (95% CI) | Firth p-value |
|---|---|---|---|---|---|
| Gender: female vs male (ref = male) | 18.52 (2.97) | 0.024 | 1.42 (0.63) | 4.14 (1.20–14.29) | 0.025 |
| Age (ordinal, per category increase, 18–30 → >60) | −18.23 (1.42) | <0.001 | −0.98 (0.23) | 0.38 (0.24–0.59) | <0.001 |
| History of diabetes: yes vs no (ref = no) | −16.15 (5218.97) | 0.998 | −0.78 (0.95) | 0.46 (0.07–2.97) | 0.412 |
| History of shoulder trauma: yes vs no (ref = no) | −3.76 (0.94) | <0.001 | −2.05 (0.54) | 0.13 (0.045–0.37) | <0.001 |
| Model fit | −2LL = 48.97 | Nagelkerke R2 = 0.497 | Firth − 2LL [nga rianaliza] | Firth pseudo-R2 [nga rianaliza] | |
| Multicollinearity | Tolerance 0.582–0.831 | VIF 1.203–1.718 | |||
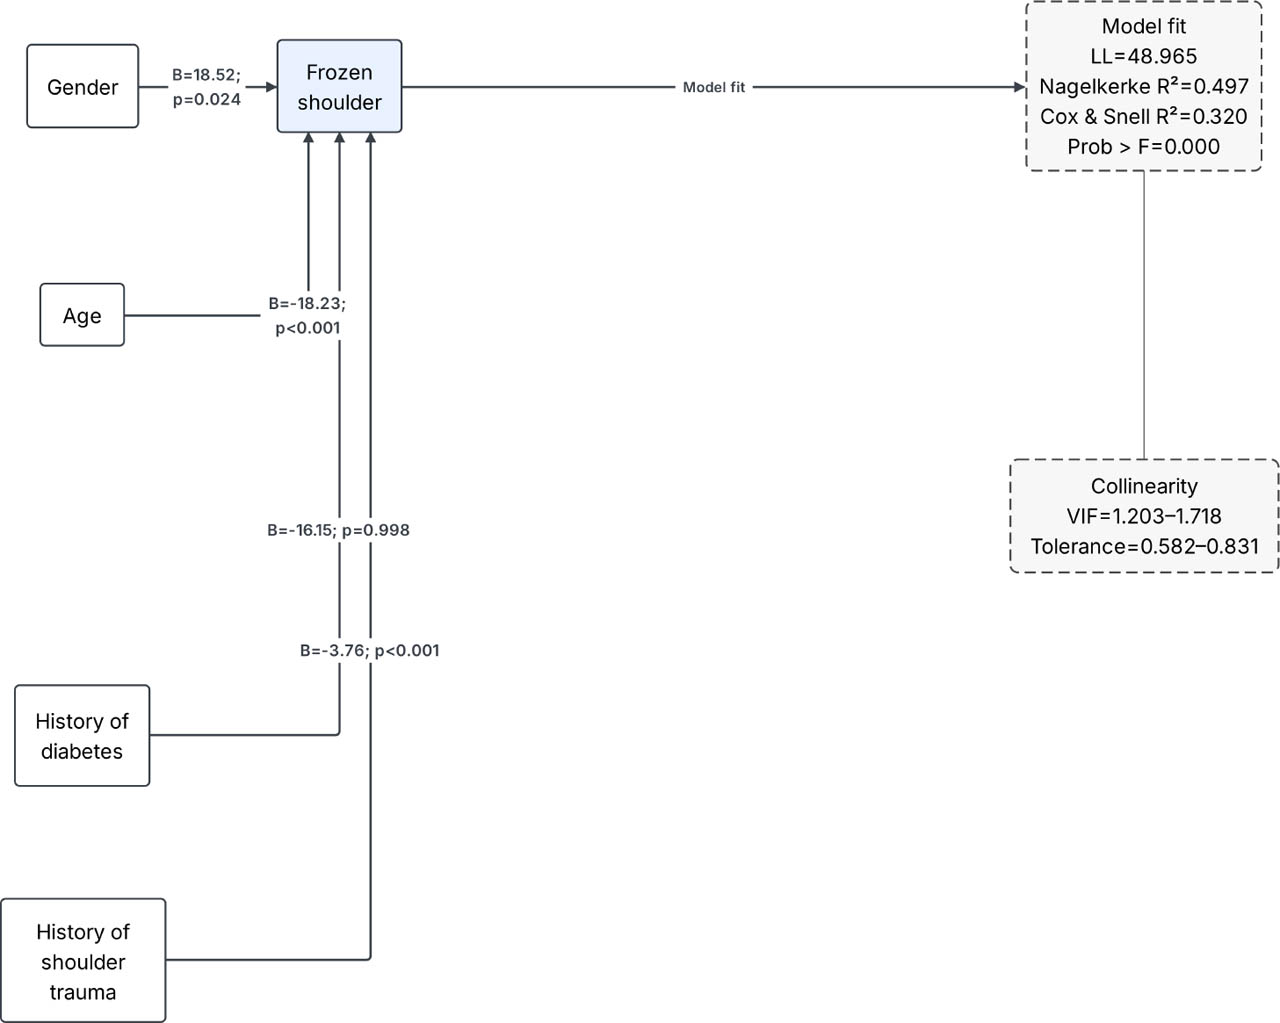
Appendix 1.
Results from regression analysis presented in visual form. VIF - variance inflation factor
Note: The regression coefficients and p-values displayed in this figure correspond to the standard maximum-likelihood (ML) model in Table 4 and are shown here for visualization purposes only. Because the ML estimate for diabetes mellitus was unstable due to quasi-complete separation (p = 0.998), interpretation of this predictor in the text and conclusions is based on the Firth penalized logistic regression estimate (p = 0.412; OR = 0.46, 95% CI 0.07–2.97). The previous “Prob > F” statistic has been removed from the figure, as it is an F-test measure applicable to linear regression and is not an appropriate or applicable statistic for a logistic regression model; see Table 4 for the corresponding model fit statistics.