
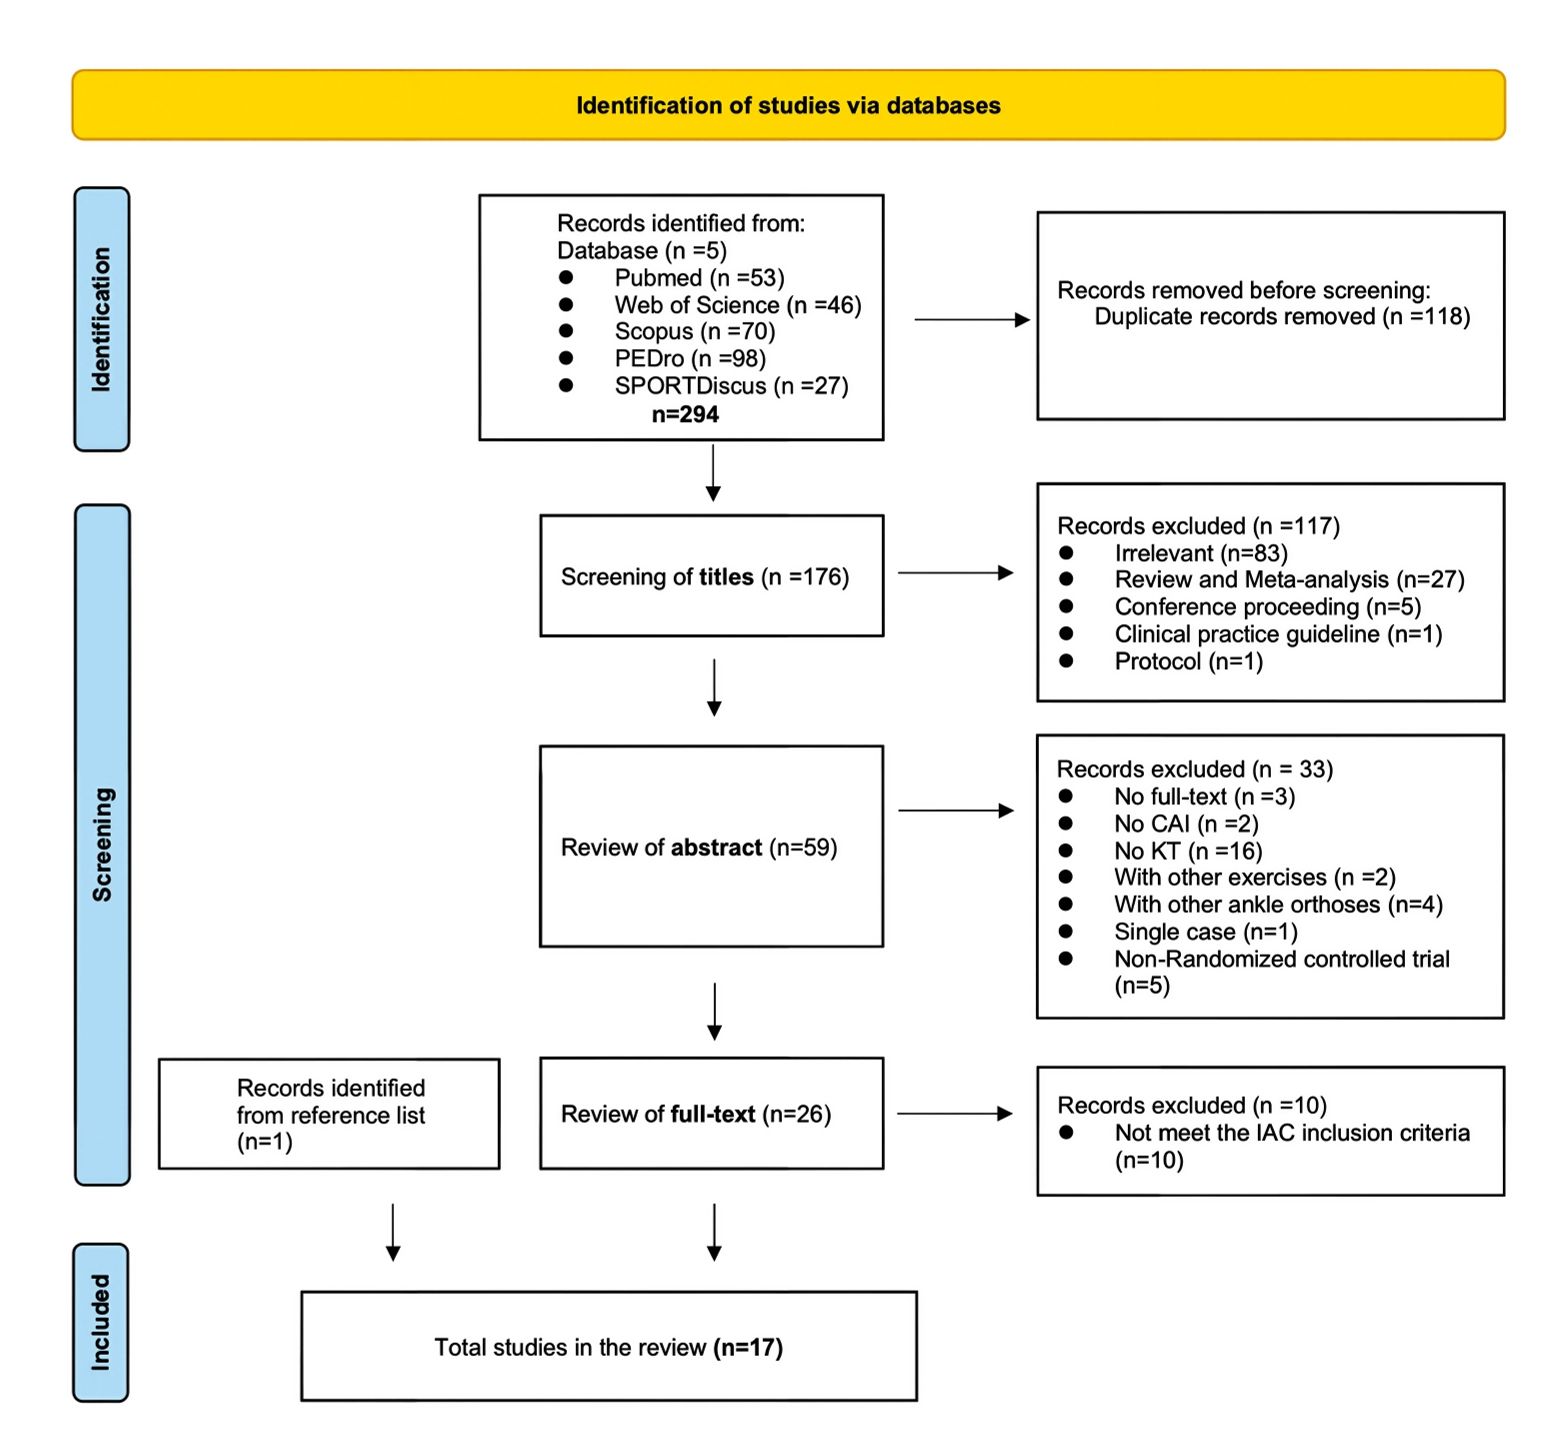
Figure 1.
Flow diagram. CAI - chronic ankle instability, KT - kinesiotape, PEDro - physiotherapy evidence database
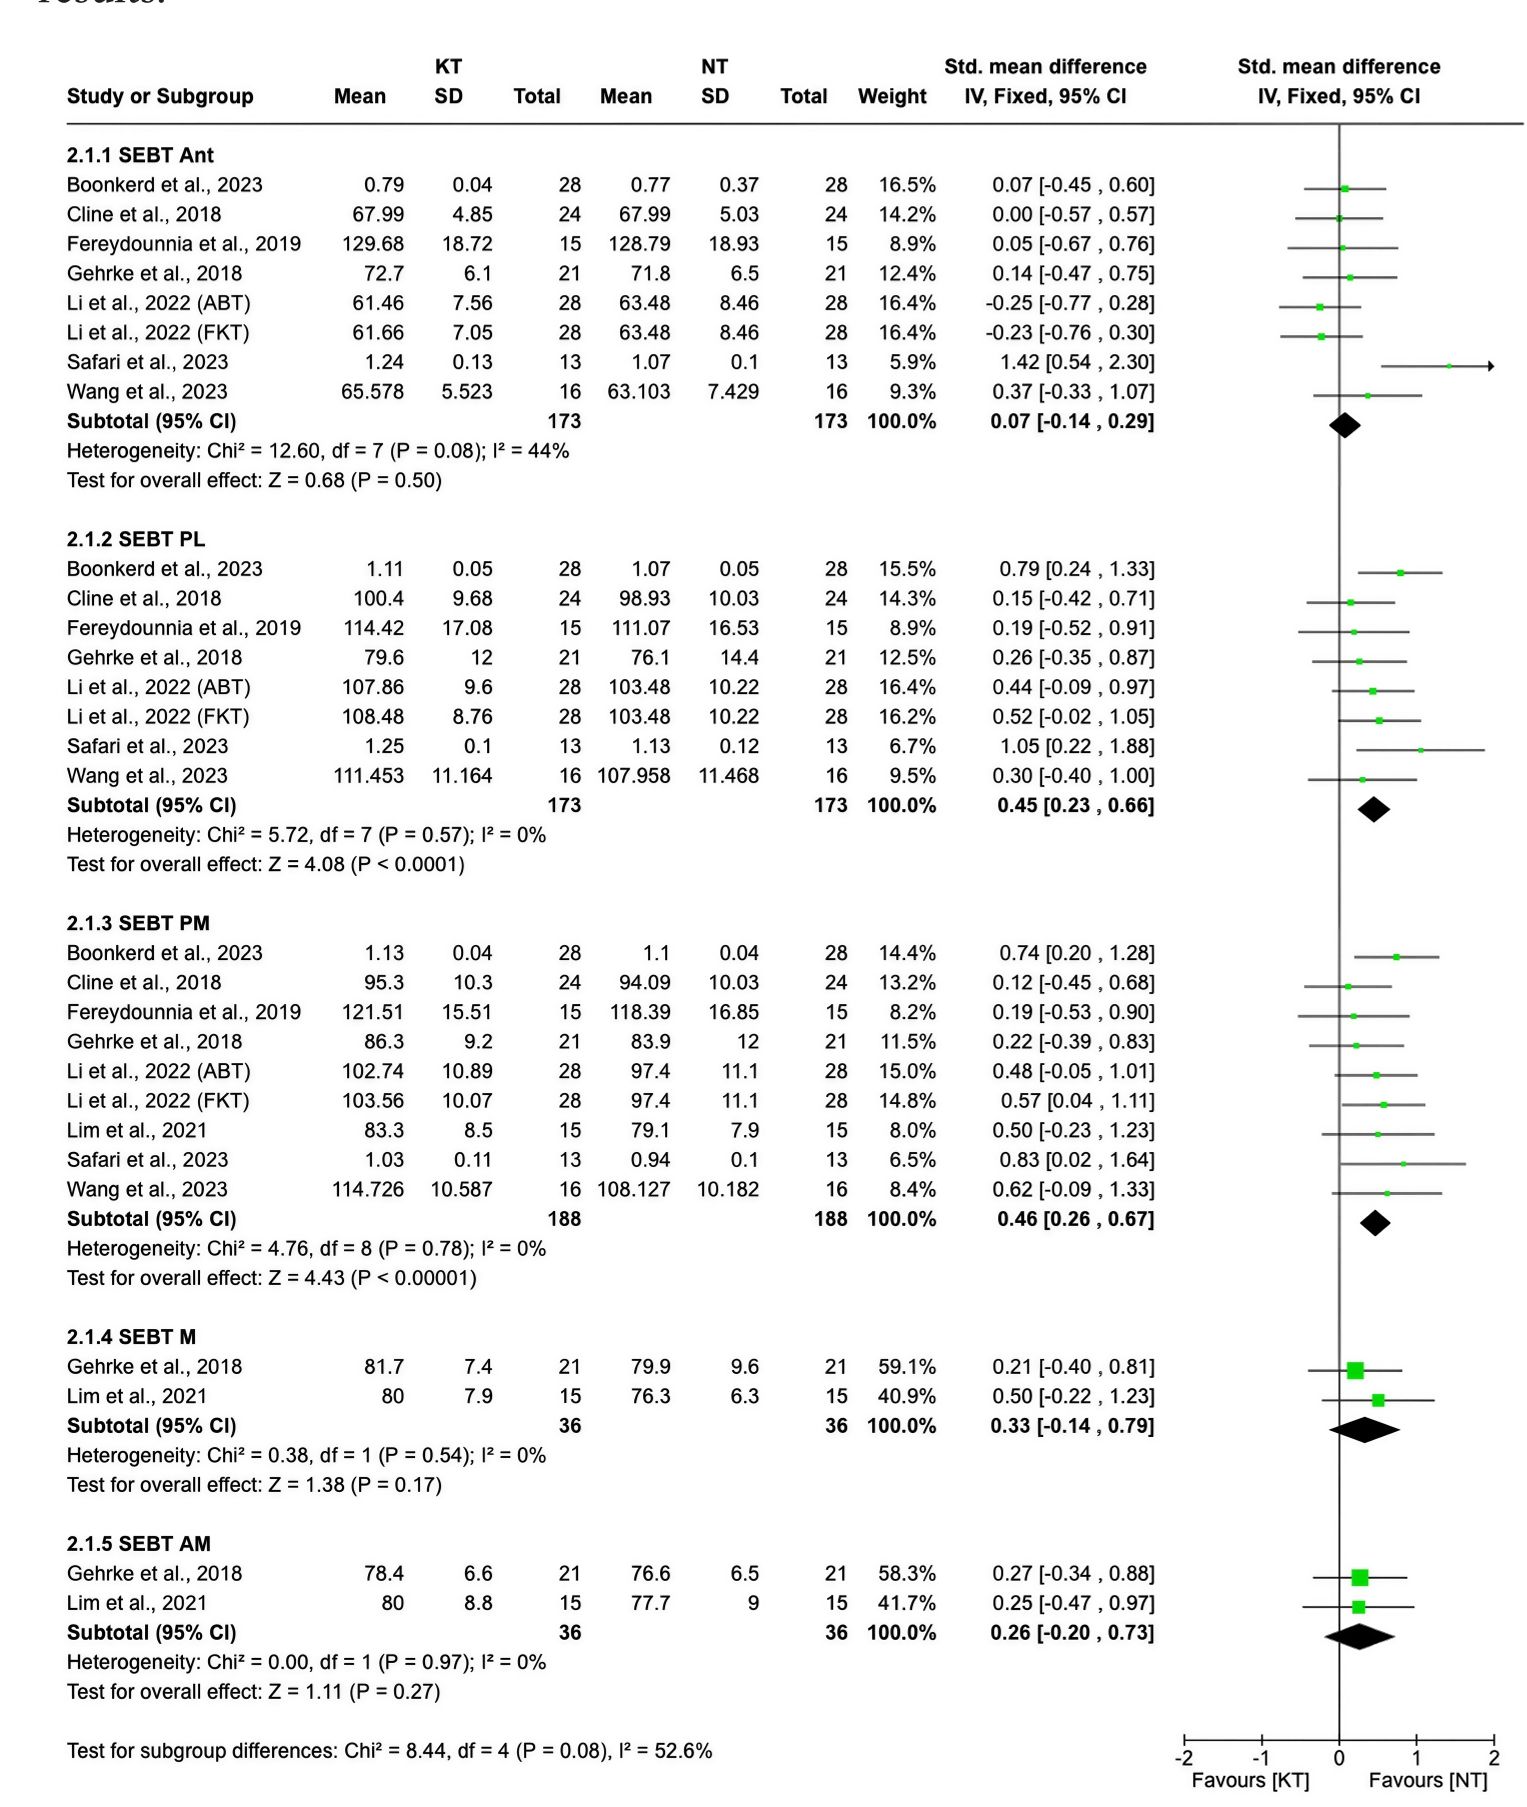
Figure 2.
Meta-analyses for the effect of KT on dynamic balance (SEBT/YBT) when KT is compared with NT. AM - anterior medial, Ant - anterior, CI - confidence interval, KT - Kinesiotape, M - medial, NT - no-tape, PL - posterolateral, PM - posteromedial, SD - standard deviation, SEBT - star excursion balance test, YBT - Y balance test
Table 1.
Quality of the evidence and summary of findings in dynamic balance
| Dynamic balance (SEBT) | ||||||
|---|---|---|---|---|---|---|
| KT vs NT | ||||||
| Meta-analysis | Risk of bias | Inconsistency | Imprecision | Indirectness | Publication bias | Quality |
| Anterior | Serious | Not serious | Not serious | Not serious | NA | Moderate |
| Posterolateral | Serious | Not serious | Serious | Not serious | NA | Low |
| Posteromedial | Serious | Not serious | Serious | Not serious | NA | Low |
| Medial | Serious | Not serious | Serious | Not serious | NA | Low |
| Anterior medial | Serious | Not serious | Serious | Not serious | NA | Low |
| KT vs RT | ||||||
| Meta-analysis | Risk of bias | Inconsistency | Imprecision | Indirectness | Publication bias | Quality |
| Anterior | Serious | Not serious | Serious | Not serious | NA | Low |
| Posterolateral | Serious | Not serious | Serious | Not serious | NA | Low |
| Posteromedial | Serious | Not serious | Serious | Not serious | NA | Low |
| KT vs ST | ||||||
| Meta-analysis | Risk of bias | Inconsistency | Imprecision | Indirectness | Publication bias | Quality |
| Anterior | Serious | Not serious | Not serious | Not serious | NA | Moderate |
| Posterolateral | Serious | Serious | Serious | Not serious | NA | Very low |
| Posteromedial | Serious | Not serious | Serious | Not serious | NA | Low |
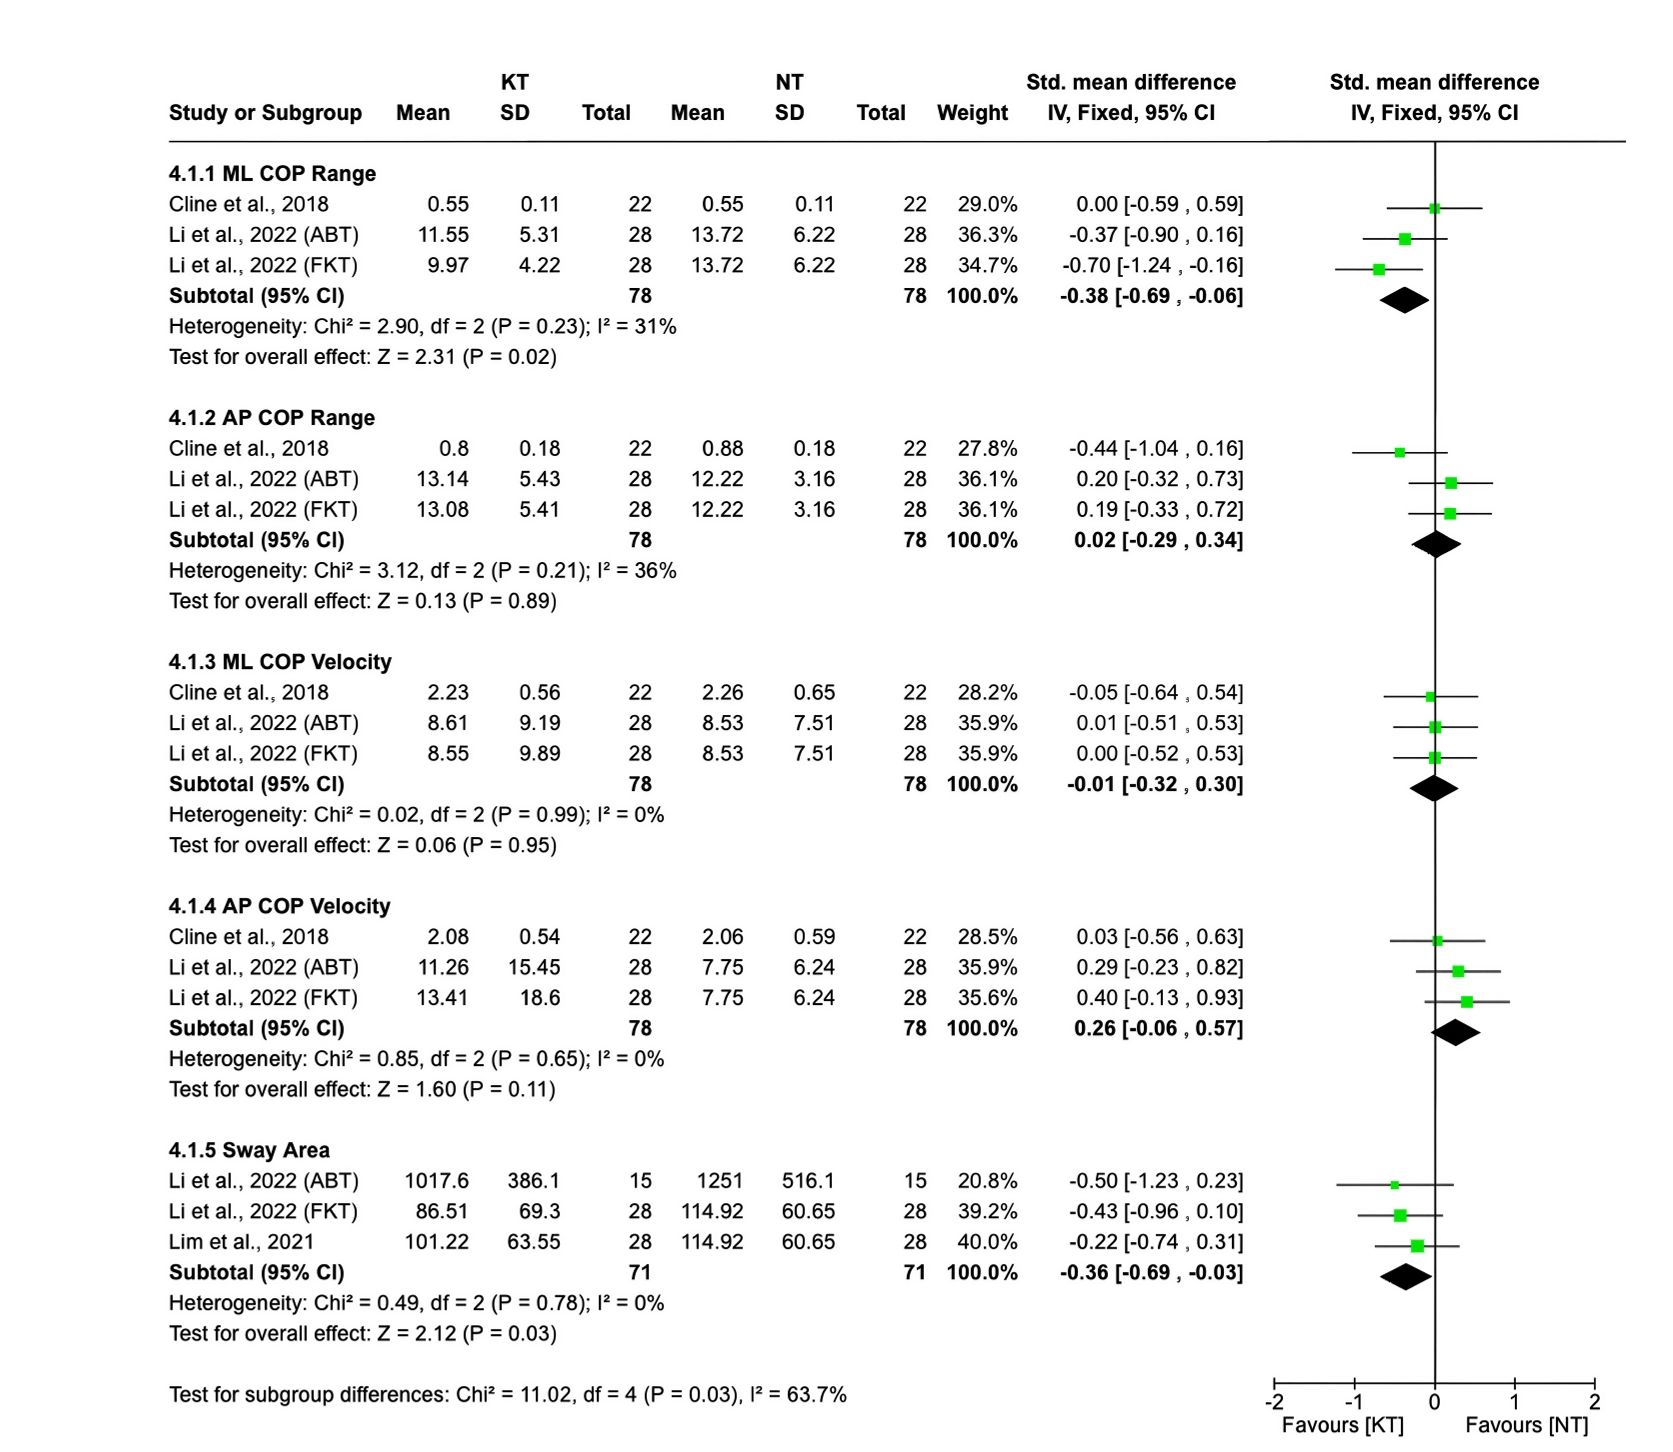
Figure 3
Meta-analyses for the effect of KT on static balance (COP) when KT is compared with NT. AP - anteroposterior, CI - confidence interval, COP - centre of pressure, KT - kinesiotape, ML - mediolateral, NT - no-tape, SD - standard deviation
Table 2.
Quality of the evidence and summary of findings in static balance
| Static balance (COP) | ||||||
|---|---|---|---|---|---|---|
| KT vs NT | ||||||
| Meta-analysis | Risk of bias | Inconsistency | Imprecision | Indirectness | Publication bias | Quality |
| ML COP range | Serious | Not serious | Not serious | Not serious | NA | Moderate |
| AP COP range | Serious | Not serious | Not serious | Not serious | NA | Moderate |
| ML COP velocity | Serious | Not serious | Not serious | Not serious | NA | Moderate |
| AP COP velocity | Serious | Not serious | Serious | Not serious | NA | Low |
| Sway area | Serious | Not serious | Serious | Not serious | NA | Low |
Table 3.
Quality of the evidence and summary of findings in proprioception
| Proprioception | ||||||
|---|---|---|---|---|---|---|
| KT vs NT | ||||||
| Meta-analysis | Risk of bias | Inconsistency | Imprecision | Indirectness | Publication bias | Quality |
| Inversion | Serious | Serious | Serious | Not Serious | NA | Very low |
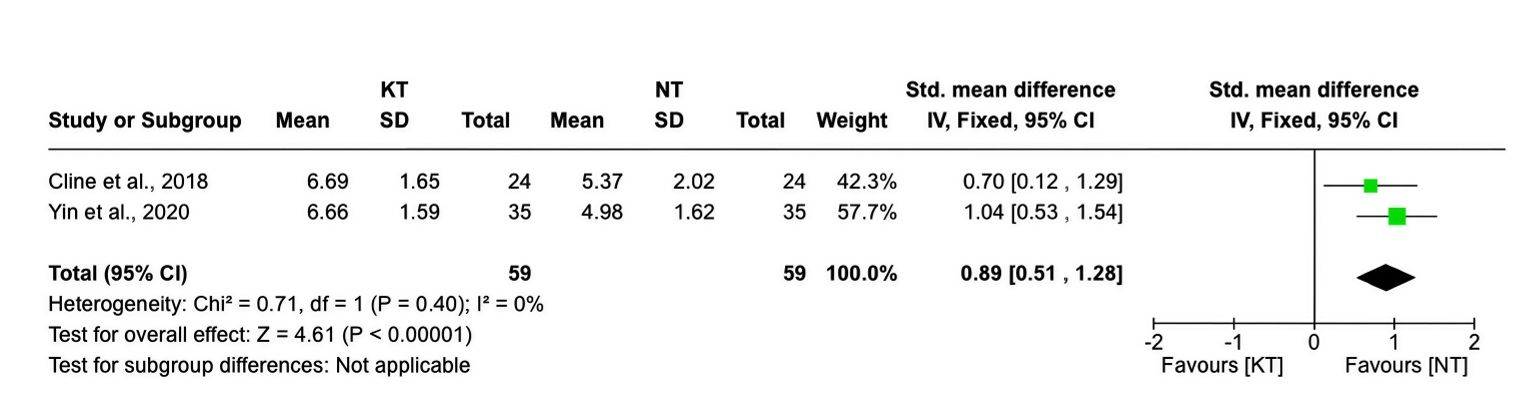
Figure 4
Meta-analyses for the effect of KT on perceived stability (VAS score) when KT is compared with NT. CI - confidence interval, KT - kinesiotape, NT - no-tape, SD - standard deviation, VAS - visual analogue scale
Table 4.
Quality of the evidence and summary of findings in perceived stability
| Perceived stability | ||||||
|---|---|---|---|---|---|---|
| KT vs NT | ||||||
| Meta-analysis | Risk of bias | Inconsistency | Imprecision | Indirectness | Publication bias | Quality |
| Inversion | Serious | Not serious | Serious | Not serious | NA | Low |
Supplementary Table 1.
Search strategy used for each database
| Database | Date range | Fields | Search strategy |
|---|---|---|---|
| PubMed | 01.2014–09.2025 | Title, abstract, MeSH Terms | ((“kinesio tap*”[Title/Abstract] OR “kinesiotap*”[Title/ Abstract] OR “elastic tap*”[Title/Abstract] OR “orthotic tap*”[Title/Abstract] OR “athletic tape”[MeSH Terms]) AND (“chronic ankle instability”[Title/Abstract] OR “functional ankle instability”[Title/Abstract])) AND ((English [Filter]) AND (2014:2025[pdat])) |
| Web of Science | 01.2014–09.2025 | Topic | TS= ((“kinesio tap*” OR “kinesiotap*” OR “elastic tap*” OR “athletic tap*” OR “orthotic tap*”) AND (“chronic ankle instability” OR “functional ankle instability”)) |
| Scopus | 01.2014–09.2025 | Article title, abstract, keywords | TITLE-ABS-KEY ((“kinesio tap*” OR “kinesiotap*” OR “elastic tap*” OR “orthotic tap*”) AND (“chronic ankle instability” OR “functional ankle instability”)) AND (PUBYEAR > 2014 AND PUBYEAR < 2025) AND (LIMIT-TO (LANGUAGE, “English”)) |
| PEDro | 01.2014–09.2025 | Abstract, title | “Chronic ankle instability” AND “kinesiotap*” |
| SPORTDiscus | 01.2014–09.2025 | ((“kinesio tap*” OR “kinesiotap*” OR “elastic tap*” OR “athletic tap*” OR “orthotic tap*”) AND (“chronic ankle instability” OR “functional ankle instability”)) |
Supplementary Table 2.
Characteristics of the included studies
| Design | Participant characteristics (N/gender/age) | Intervention and compari son | KT application methods | Outcome measures | Applying time | |
|---|---|---|---|---|---|---|
| Boonkerd et al. 202330 | Cross-over repeated measure | 28 men with CAI Age (years): 22.5 ± 3.8 | KT vs ST vs NT |
| Proprioception (JPS, TTDPM), Static balance (BESS score), Dynamic balance (SEBT | Immediately |
| Cheraghi et al. 202231 | Cross-over repeated Measure | 30 collegiate athletes with CAI (11f, 19m) Age (years): 23.91 ± 2.58 | KT vs NT |
| Ankle ROM, angular velocity; peak force, rate of force development, power; muscle activation during CMJ | 25 minutes after KT application |
| Cline et al. 201832 | Cross-over repeated measure | 24 individuals with CAI Age (years): 25.2 ± 3.34 | KT vs Non-elastic Tape vs NT |
| Dynamic balance (SEBT), static balance (COP, TTB), perceived stability (VAS) | Immediately |
| Fereydounnia et al. 201933,34 | Cross-over repeated measure | 15 male athletes with FAI Age (years): 23.07 ± 4.76 15 healthy athletes Age (years): 23.73 ± 4.95 | Distal KT vs NT |
| COP displacement of gait initiation profile | 30 minutes after KT application |
| Fereydounnia et al. 201933,34 | Cross-over repeated measure | 15 male athletes with FAI Age (years): 23.07 ± 4.76 15 healthy athletes Age (years): 23.73 ± 4.95 | Distal KT vs NT |
| Dynamic balance (SEBT), side hop test, figure-of-8 test | 30 minutes after KT application |
| Boonkerd et al. 202330 | Cross-over repeated measure | 28 men with CAI Age (years): 22.5 ± 3.8 | KT vs ST vs NT |
| Proprioception (JPS, TTDPM), Static balance (BESS score), Dynamic balance (SEBT | Immediately |
| Cheraghi et al. 202231 | Cross-over repeated Measure | 30 collegiate athletes with CAI (11f, 19m) Age (years): 23.91 ± 2.58 | KT vs NT |
| Ankle ROM, angular velocity; peak force, rate of force development, power; muscle activation during CMJ | 25 minutes after KT application |
| Cline et al. 201832 | Cross-over repeated measure | 24 individuals with CAI Age (years): 25.2 ± 3.34 | KT vs Non-elastic Tape vs NT |
| Dynamic balance (SEBT), static balance (COP, TTB), perceived stability (VAS) | Immediately |
| Fereydounnia et al. 201933,34 | Cross-over repeated measure | 15 male athletes with FAI Age (years): 23.07 ± 4.76 15 healthy athletes Age (years): 23.73 ± 4.95 | Distal KT vs NT |
| COP displacement of gait initiation profile | 30 minutes after KT application |
| Fereydounnia et al. 201933,34 | Cross-over repeated measure | 15 male athletes with FAI Age (years): 23.07 ± 4.76 15 healthy athletes Age (years): 23.73 ± 4.95 | Distal KT vs NT |
| Dynamic balance (SEBT), side hop test, figure-of-8 test | 30 minutes after KT application |
| Boonkerd et al. 202330 | Cross-over repeated measure | 28 men with CAI Age (years): 22.5 ± 3.8 | KT vs ST vs NT |
| Proprioception (JPS, TTDPM), Static balance (BESS score), Dynamic balance (SEBT) | Immediately |
| Cheraghi et al. 202231 | Cross-over repeated Measure | 30 collegiate athletes with CAI (11f, 19m) Age (years): 23.91 ± 2.58 | KT vs NT |
| Ankle ROM, angular velocity; peak force, rate of force development, power; muscle activation during CMJ | 25 minutes after KT application |
| Cline et al. 201832 | Cross-over repeated measure | 24 individuals with CAI Age (years): 21.25 ± 3.34 | KT vs Non-elastic Tape vs NT |
| Dynamic balance (SEBT), static balance (COP, TTB), perceived stability (VAS) | Immediately |
| Fereydounnia et al. 201933,34 | Cross-over repeated measure | 15 male athletes with FAI Age (years): 23.07 ± 4.76 15 healthy athletes Age (years): 23.73 ± 4.95 | Distal KT vs NT |
| COP displacement of gait initiation profile | 30 minutes after KT application |
| Fereydounnia et al. 201933,34 | Cross-over repeated measure | 15 male athletes with FAI Age (years): 23.07 ± 4.76 15 healthy athletes Age (years): 23.73 ± 4.95 | Distal KT vs NT |
| Dynamic balance (SEBT), side hop test, figure-of-8 test | 30 minutes after KT application |
| Fereydounnia et al. 202135 | Cross-over repeated measure | 15 male athletes with FAI Age (years): 23.07 ± 4.76 15 healthy athletes Age(years): 23.73 ± 4.95 | Distal KT vs NT |
| RP, APAP, velocity of COP displacement of gait initiation profile | 30 minutes after KT application |
| Gehrke et al. 201836 | Cross-over repeated measure | 21 basketball athletes with CAI (7f, 14m) Age (years): 23.7 ± 3.2 | KT vs RT vs NT |
| Dynamic balance (SEBT), figure-of-8 test, comfort | Immediately |
| Lim et al. 202137 | Cross-over repeated measure | 15 participants with CAI (6f, 9m) Age (years): 23.5 ± 1.7 | KT vs DT vs NT |
| Dynamic balance (modified SEBT), static balance (COP parameters of the OLST) | Immediately |
| Li et al. 202238 | Cross-over repeated measure | 28 participants with FAI (13f/15m) Age (years): 21.2 ± 2.0 | FKT vs ABT vs ST vs NT |
| Muscle strength (MVIC), proprioception (JPS, FS), dynamic balance (YBT scores), static balance (COP parameters of the unilateral stance) | Immediately |
| Safari et al. 202339 | RCT | KT: 13 female volleyball players Age (years): 25.08 ± 3.23 PT: 13 female volleyball players Age (years): 24.15 ± 1.72 | KT vs ST |
| Side hop test, single hop distance test, dynamic balance (YBT scores) | 20 minutes after KT application/24 hours after KT application |
| Shadegani et al. 202340 | Cross-over Repeated Measure | 16 individuals with CAI (11f, 5m) Age (years): 29.37 ± 6.08 | KT vs MT vs NT |
| Muscle Activation (The onset time and magnitude of SLR and MLR for PB, PL, TA, SOL muscles, the TA/P and SOL/TA antagonist co-activation) | 24 hours after KT application |
| Wang et al. 202341 | Cross-over Repeated Measure | 16 individuals without CAI (6f, 10m) Age (years): 23.880 ± 2.306 16 individuals with CAI (8f, 8m) Age (years): 23.060 ± 3.043 | KT vs NT |
| Dynamic balance (YBT scores) | Immediately |
| Wang et al. 202446 | Cross-over repeated measure | 21 participants with CAI (11f, 10m) Age (years): 22.0 ± 2.9 | KT vs ST vs NT |
| Ankle plantarflexion/inversion/eversion angle, time to peak vGRF, peak ankle dorsiflexion/eversion angle, peak ankle dorsiflexion/eversion angular velocity, peak vGRF, peak ankle dorsiflexion/eversion moment | Immediately |
| Yen et al. 201842 | RCT | KT:8f, 2m Age (years):22.8 ± 1.3 AT:7f, 3m Age (years):23 ± 2.3 | KT vs AT |
| Foot position, tibial position of walking | Immediately |
| Yin et al. 202043 | Cross-over repeated measure | 35 male participants with CAI Age (years): 22.97 ± 2.81 | KT vs AT vs ST vs NT |
| Postural stability (SOT, US, LOS, MCT, ADT), perceived stability (VAS) | Immediately |
| Yin et al. 202144 | Cross-over repeated measure | 35 male participants with CAI Age (years): 22.97 ± 2.81 | KT vs AT vs ST vs NT |
| Muscle activation, proprioception (TTDPM) | Immediately |
| Yu et al. 202145 | Cross-over repeated measure | 15 individuals without CAI (7f, 8m) Age (years):23.1 ± 2.0 15 individuals with CAI (8f, 7m) Age (years):23.9 ± 2.6 | KT (short/ mid/long) vs NT |
| Proprioception (AIDAL) | Immediately |
[i] ABT - ankle balance taping, AIDAL - ankle inversion discrimination apparatus for landing, ADT - adaptation test, APAP - anticipatory postural adjustment phase, AT - athletic tape, BESS - balance error scoring system, CAI - chronic ankle instability, CMJ - countermovement jump, COP - centre of pressure, DT - dynamic tape, FAI - functional ankle instability, FKT - facilitatory kinesio taping, FS - force sense, GL - gastrocnemius lateralis, GM - gastrocnemius medialis, JPS - joint position sense, KT - kinesiotape, LOS - limit of stability, MCT - motor control test, MLR - medium latency response, MT - mulligan tape, MVIC - maximum voluntary isometric contraction, NT - no-tape, OLST - one-leg standing test, PB - peroneus brevis, RCT - randomised controlled trial, ROM - range of motion, RP - reaction phase, SEBT - star excursion balance test, SLR - short latency response, SOL - soleus, SOT - sensory organisation test, ST - sham tape, TA - tibialis anterior, TP - tibialis posterior, TTB - time-to-boundary, TTDPM - threshold for detecting passive motion, US - unilateral stance, VAS - visual analogue scale, vGRF - vertical ground reaction force, vs - versus, YBT - Y balance test.
Supplementary Table 3.
Summary of non-pooled findings for dynamic balance
| Variable | Study | Intervention and comparison | Outcome measures(units) | Additional information | Timing | Significant effect |
|---|---|---|---|---|---|---|
| Dynamic balance | Yin et al. 202043 | KT vs NT vs ST vs AT | LOS DCL (%) | Ant | Immediately | p = 0.956 |
| KT vs NT vs ST vs AT | LOS DCL (%) | AR | Immediately | p = 0.724 | ||
| KT vs NT vs ST vs AT | LOS DCL (%) | R | Immediately | p = 0.533 | ||
| KT vs NT vs ST vs AT | LOS DCL (%) | PR | Immediately | p = 0.518 | ||
| KT vs NT vs ST vs AT | LOS DCL (%) | P | Immediately | p = 0.836 | ||
| KT vs NT vs ST vs AT | LOS DCL (%) | PL | Immediately | p = 0.842 | ||
| KT vs NT vs ST vs AT | LOS DCL (%) | L | Immediately | p = 0.619 | ||
| KT vs NT vs ST vs AT | LOS DCL (%) | AL | immediately | p = 0.201 | ||
| KT vs NT | Amplitude scaling scores | MCT (forward-small slip) | Immediately | p < 0.001 | ||
| KT vs NT | Amplitude scaling scores | MCT (forward-medium slip) | Immediately | ns | ||
| KT vs NT | Amplitude scaling scores | MCT (forward-large slip) | Immediately | ns | ||
| KT vs NT | Amplitude scaling scores | MCT (backward-small slip) | Immediately | ns | ||
| KT vs NT | Amplitude scaling scores | MCT (backward-medium slip) | Immediately | ns | ||
| KT vs NT | Amplitude scaling scores | MCT (backward-large slip) | Immediately | ns | ||
| KT vs NT | Sway energy | ADT (Toes up) | Immediately | ns | ||
| KT vs NT | Sway energy | ADT (Toes down) | Immediately | ns | ||
| KT vs AT | Amplitude scaling scores | MCT (forward-small slip) | Immediately | ns | ||
| KT vs AT | Amplitude scaling scores | MCT (forward-medium slip) | Immediately | ns | ||
| KT vs AT | Amplitude scaling scores | MCT (forward-large slip) | Immediately | ns | ||
| KT vs AT | Amplitude scaling scores | MCT (backward-small slip) | Immediately | ns | ||
| KT vs AT | Amplitude scaling scores | MCT (backward-medium slip) | Immediately | ns | ||
| KT vs AT | Amplitude scaling scores | MCT (backward-large slip) | Immediately | ns | ||
| KT vs AT | Sway energy | ADT (Toes up) | Immediately | ns | ||
| KT vs AT | Sway energy | ADT (Toes down) | Immediately | ns | ||
| KT vs ST | Amplitude scaling scores | MCT (forward-small slip) | Immediately | ns | ||
| KT vs ST | Amplitude scaling scores | MCT (forward-medium slip) | Immediately | ns | ||
| KT vs ST | Amplitude scaling scores | MCT (forward-large slip) | Immediately | ns | ||
| KT vs ST | Amplitude scaling scores | MCT (backward-small slip) | Immediately | ns | ||
| KT vs ST | Amplitude scaling scores | MCT (backward-medium slip) | Immediately | ns | ||
| KT vs ST | Amplitude scaling scores | MCT (backward-large slip) | Immediately | p = 0.035 | ||
| KT vs ST | Sway energy | ADT (Toes up) | Immediately | ns | ||
| KT vs ST | Sway energy | ADT (Toes down) | Immediately | ns |
Supplementary Table 4.
Summary of non-pooled findings for static balance
| Variable | Study | Intervention and comparison | Outcome measures(units) | Additional information | Timing | Significant effect |
|---|---|---|---|---|---|---|
| Static balance | Boonkerd et al. 202330 | KT vs placebo tape | BESS scores | Immediately | p = 0.134 | |
| KT vs NT | BESS scores | Immediately | p = 0.032 | |||
| Yin et al. 202043 | KT vs NT | SOT ES | Condition1-6 | Immediately | ns | |
| KT vs AT | SOT ES | Condition1-6 | Immediately | ns | ||
| KT vs ST | SOT ES | Condition1-6 | Immediately | ns | ||
| KT vs NT | SOT COMP | Condition1-6 | Immediately | ns | ||
| KT vs AT | SOT COMP | Condition1-6 | Immediately | ns | ||
| KT vs ST | SOT COMP | Condition1-6 | Immediately | ns | ||
| KT vs NT | Sway velocity of COG (⌧/s) | US-EO | Immediately | ns | ||
| KT vs AT | Sway velocity of COG (⌧/s) | US-EO | Immediately | ns | ||
| KT vs ST | Sway velocity of COG (⌧/s) | US-EO | Immediately | ns | ||
| KT vs NT | Sway velocity of COG (⌧/s) | US-EC | Immediately | ns | ||
| KT vs AT | Sway velocity of COG (⌧/s) | US-EC | Immediately | ns | ||
| KT vs ST | Sway velocity of COG (⌧/s) | US-EC | Immediately | ns |
Supplementary Table 5.
Summary of non-pooled findings for proprioception
| Variable | Study | Intervention and comparison | Outcome measures(units) | Additional information | Timing | Significant effect |
|---|---|---|---|---|---|---|
| Proprioception | Yin et al. 202144 | KT vs AT vs ST vs NT | TTDPM (°) | Inversion | Immediately | ns |
| KT vs AT vs ST vs NT | TTDPM (°) | Eversion | Immediately | ns | ||
| KT vs AT vs ST vs NT | TTDPM (°) | Plantar flexion | Immediately | ns | ||
| KT vs AT vs ST vs NT | TTDPM (°) | Dorsiflexion | Immediately | ns | ||
| Li et al. 202238 | ABT/FKT vs ST vs NT | PF-AEJPS (°) | Immediately | ns | ||
| ABT/FKT vs ST vs NT | DF-AEJPS (°) | Immediately | ns | |||
| ABT/FKT vs ST vs NT | PF-VEJPS (°) | Immediately | ns | |||
| ABT/FKT vs ST vs NT | DF-VEJPS (°) | Immediately | ns | |||
| ABT/FKT vs ST vs NT | PF-RAEFS(°/N) | Immediately | ns | |||
| ABT/FKT vs ST vs NT | DF-RAEFS (°/N) | Immediately | ns | |||
| ABT/FKT vs ST vs NT | PF-RVEFS (°/N) | Immediately | ns | |||
| ABT/FKT vs ST vs NT | DF-RVEFS (°/N) | Immediately | ns | |||
| ABT/FKT vs sham tape vs NT | DF-RVEFS (°/N) | Immediately | ns |
1 ABT - ankle balance taping, AEJPS - absolute error of joint position sense, AT - athletic tape, DF - dorsiflexion, FKT - facilitatory kinesio taping, KT - kinesiotape, NS - no significance, NT - no-tape, PF - plantarflexion, RAEFS - relative absolute error of force sense, RVEFS - relative variable error of force sense, ST - sham tape, TTDPM - threshold for detecting passive motion, VEJPS - variable error of joint position sense, vs - versus.
Supplementary Table 6.
Summary of non-pooled findings for muscle activation
| Variable | Study | Intervention and comparison | Outcome measures(units) | Additional information | Timing | Significant effect |
|---|---|---|---|---|---|---|
| Muscle activation | Cheraghi et al. 2022 | KT vs NT | LG muscle activity(%peak) | Propulsion phase of CMJ | Immediately | p = 0.028 |
| KT vs NT | MG muscle activity(%peak) | Propulsion phase of CMJ | Immediately | p = 0.015 | ||
| KT vs NT | TA muscle activity(%peak) | Propulsion phase of CMJ | Immediately | p = 0.781 | ||
| KT vs NT | PL muscle activity(%peak) | Propulsion phase of CMJ | Immediately | p = 0.045 | ||
| Shadegani et al. 202340 | KT vs NT | Onset time pf MLR (ms) | Immediately | p < 0.013 | ||
| KT vs NT | Magnitude of SLR | Immediately | p < 0.001 | |||
| KT vs NT | Magnitude of MLR | Immediately | p < 0.018 | |||
| KT vs MT | Magnitude of SLR | Immediately | p < 0.005 | |||
| KT vs MT | Magnitude of MLR | Immediately | p < 0.013 | |||
| Yin et al. 202144 | KT vs AT | LG RMS values(%MVIC) | Condition 4 during SOT | Immediately | p = 0.038 | |
| KT vs ST | PL RMS values(%MVIC) | Forward-small translation during MCT | Immediately | p = 0.046 |
[i] AT - athletic tape, CMJ - countermovement jump, KT - kinesiotape, LG - lateral gastrocnemius, MCT - motor control test, MLR - medium latency response, MG - medial gastrocnemius, MT - mulligan tape, MVIC - maximum voluntary isometric contraction, RMS - root mean square, SLR - short latency response, SOT - sensory organization test, ST - sham tape, TA - tibialis anterior, vs - versus.
Supplementary Table 7.
Summary of non-pooled findings for muscle strength
| Variable | Study | Intervention and comparison | Outcome measures(units) | Additional information | Timing | Significant effect |
|---|---|---|---|---|---|---|
| Muscle strength | Fereydounnia et al. 2019 [33, 34] | KT vs NT | Ankle evertors (N) | Immediately | p = 0.000 |
Supplementary Table 8.
Summary of non-pooled findings for sports performance
| Variable | Study | Intervention and comparison | Outcome measures(units) | Additional information | Timing | Significant effect |
|---|---|---|---|---|---|---|
| Sports performance | Cheraghi et al. 202231 | KT vs NT | Jump height(cm) | Propulsion phase of CMJ | Immediately | p = 0.001 |
| KT vs NT | Inversion/eversion ROM (°) | Propulsion phase of CMJ | Immediately | p = 0.002 | ||
| KT vs NT | Dorsi-plantar flexion ROM (°) | Propulsion phase of CMJ | Immediately | p = 0.006 | ||
| KT vs NT | Plantar flexion angular velocity (°/s) | Propulsion phase of CMJ | Immediately | p = 0.009 | ||
| KT vs NT | Average peak force(N) | Propulsion phase of CMJ | Immediately | p < 0.001 | ||
| KT vs NT | RFD (N/s) | Propulsion phase of CMJ | Immediately | p < 0.001 | ||
| KT vs NT | Peak power(W) | Propulsion phase of CMJ | Immediately | p < 0.001 | ||
| KT vs NT | Joint power☒%☒total | Propulsion phase of CMJ | Immediately | p = 0.021 | ||
| Sports performance | Fereydounnia et al. 201933,34 | KT vs NT | Figure-of-8(s) | Immediately | ns | |
| Fereydounnia et al. 201933,34 | Distal KT vs NT | AP COP displacement(cm) | Anticipatory phase of GI | Immediately | ns | |
| Distal KT vs NT | ML COP displacement(cm) | Anticipatory phase of GI | Immediately | ns | ||
| Distal KT vs NT | Resultant COP displacement(cm) | Anticipatory phase of GI | Immediately | ns | ||
| Distal KT vs NT | AP COP displacement(cm) | Weight transfer phase of GI | Immediately | ns | ||
| Distal KT vs NT | ML COP displacement(cm) | Weight transfer phase of GI | Immediately | ns | ||
| Distal KT vs NT | Resultant COP displacement(cm) | Weight transfer phase of GI | Immediately | ns | ||
| Distal KT vs NT | AP COP displacement(cm) | Locomotive phase of GI | Immediately | ns | ||
| Distal KT vs NT | ML COP displacement(cm) | Locomotive phase of GI | Immediately | ns | ||
| Distal KT vs NT | Resultant COP displacement(cm) | Locomotive phase of GI | Immediately | ns | ||
| Fereydounnia et al. 202135 | Distal KT vs NT | RP (ms) | Immediately | ns | ||
| Distal KT vs NT | APAP (ms) | Immediately | ns | |||
| Distal KT vs NT | VELS1(cm/s) | S1: Anticipatory phase of GI | Immediately | ns | ||
| Distal KT vs NT | VELS2(cm/s) | S2: Weight transfer phase of GI | Immediately | ns | ||
| Distal KT vs NT | VELS3(cm/s) | S3: Locomotive phase of GI | Immediately | ns | ||
| Gehrke et al. 201836 | KT vs NT | Figure-of-8(s) | Immediately | p = 0.049 | ||
| Safari et al. 202337 | KT vs ST | Single hop test (cm) | 20 minutes | p = 0.0003 | ||
| KT vs ST | Single hop test (cm) | 24 hours | p = 0.0002 | |||
| KT vs ST | Side hop test (s) | 20 minutes | p < 0.0001 | |||
| Wang et al. 202445 | KT vs NT | Ankle plantarflexion angles (°) | Initial contact in LSJ movements | Immediately | p = 0.001 | |
| KT vs NT | Ankle plantarflexion angles (°) | Initial contact in RSJ movements | Immediately | p = 0.048 | ||
| KT vs NT | Peak ankle dorsiflexion angle (°) | Early landing phase in LSJ movements | Immediately | p = 0.012 | ||
| KT vs NT | Peak ankle dorsiflexion angle (°) | Early landing phase in RSJ movements | Immediately | p < 0.001 | ||
| KT vs NT | Peak ankle eversion angle (°) | Early landing phase in LSJ movements | Immediately | p = 0.043 | ||
| KT vs NT | Peak ankle eversion angle (°) | Early landing phase in RSJ movements | Immediately | p = 0.042 | ||
| KT vs NT | Time to peak vGRF (ms) | Early landing phase in LSJ movements | Immediately | p = 0.035 | ||
| KT vs NT | Time to peak vGRF (ms) | Early landing phase in RSJ movements | Immediately | p = 0.024 | ||
| KT vs NT | Peak vGRF (BW) | Early landing phase in LSJ movements | Immediately | p = 0.023 | ||
| KT vs NT | Peak vGRF (BW) | Early landing phase in RSJ movements | Immediately | p = 0.009 | ||
| KT vs NT | Peak ankle dorsiflexion moment (Nm/kg) | Early landing phase in LSJ movements | Immediately | p = 0.003 | ||
| KT vs NT | Peak ankle eversion moment (Nm/kg) | Early landing phase in LSJ movements | Immediately | P = 0.003 | ||
| KT vs NT | Peak ankle eversion moment (Nm/kg) | Early landing phase in RSJ movements | Immediately | p < 0.0001 | ||
| KT vs ST | Peak ankle dorsiflexion angle (°) | Early landing phase in LSJ movements | Immediately | p = 0.015 | ||
| KT vs ST | Peak ankle dorsiflexion angle (°) | Early landing phase in RSJ movements | Immediately | p = 0.001 | ||
| KT vs ST | Peak ankle eversion angle (°) | Early landing phase in LSJ movements | Immediately | p = 0.004 | ||
| KT vs ST | Peak ankle eversion angle (°) | Early landing phase in RSJ movements | Immediately | p = 0.037 | ||
| KT vs ST | Time to peak vGRF (ms) | Early landing phase in LSJ movements | Immediately | p = 0/022 | ||
| KT vs ST | Time to peak vGRF (ms) | Early landing phase in RSJ movements | Immediately | p = 0.031 | ||
| KT vs ST | Peak vGRF (BW) | Early landing phase in LSJ movements | Immediately | p = 0.026 | ||
| KT vs ST | Peak vGRF (BW) | Early landing phase in RSJ movements | Immediately | p = 0.023 | ||
| KT vs ST | Peak ankle eversion moment (Nm/kg) | Early landing phase in LSJ movements | Immediately | p = 0.002 | ||
| KT vs ST | Peak ankle eversion moment (Nm/kg) | Early landing phase in RSJ movements | Immediately | p < 0.001 | ||
| Yen et al. 201842 | KT vs NT | Foot position: frontal plane (°) | Stance phase of walking zone1 | Immediately | p = 0.03 | |
| KT vs AT | Foot position change: frontal plane (°) | Stance phase of walking zone7 | Immediately | P = 0.049 | ||
| KT vs AT | Tibial position change: transverse plane (°) | Stance phase of walking zone7 | Immediately | p = 0.03 | ||
| KT vs AT | Tibial position change: transverse plane (°) | Stance phase of walking zone8 | Immediately | p = 0.03 | ||
| KT vs AT | Tibial position change: transverse plane (°) | Stance phase of walking zone9 | Immediately | p = 0.04 |
[i] ADT - adaptation test, AEJPS - absolute error of joint position sense, AP - anterior-posterior, APAP - anticipatory postural adjustment phase, BBS - biodex balance system, BESS - balance error scoring system, CMJ - countermovement jump, COG - center of gravity, COMP - composite scores, DCL - directional control, DF - dorsiflexion, EC - eyes closed, EO - eyes open, ES - equilibrium scores, GI - gait initiation, L - left, LG - lateral gastrocnemius, LOS - limit of stability, LSJ - left-sided jumping, MCT - motor control test, MG - medial gastrocnemius, ML - medial-lateral, MLR - medium latency response, ns - no significance, P - posterior, PF - plantarflexion, PL - posterolateral, PM - posteromedial, R - right, RAEFS - relative absolute error of force sense, RFD - rate of force development, RMS - root mean square, RP - reaction phase, RSJ - right-sided jumping, RVEFS - relative variable error of force sense, S1 - Anticipatory Phase, SEBT - star excursion balance Test, SLR - short latency response, SOT - sensory organization test, TA - tibialis anterior, TTDPM - threshold for detecting passive motion, US - unilateral stance, VEL - velocity, VEJPS - variable error of joint position sense, vGRF - vertical ground reaction force, vs - versus.
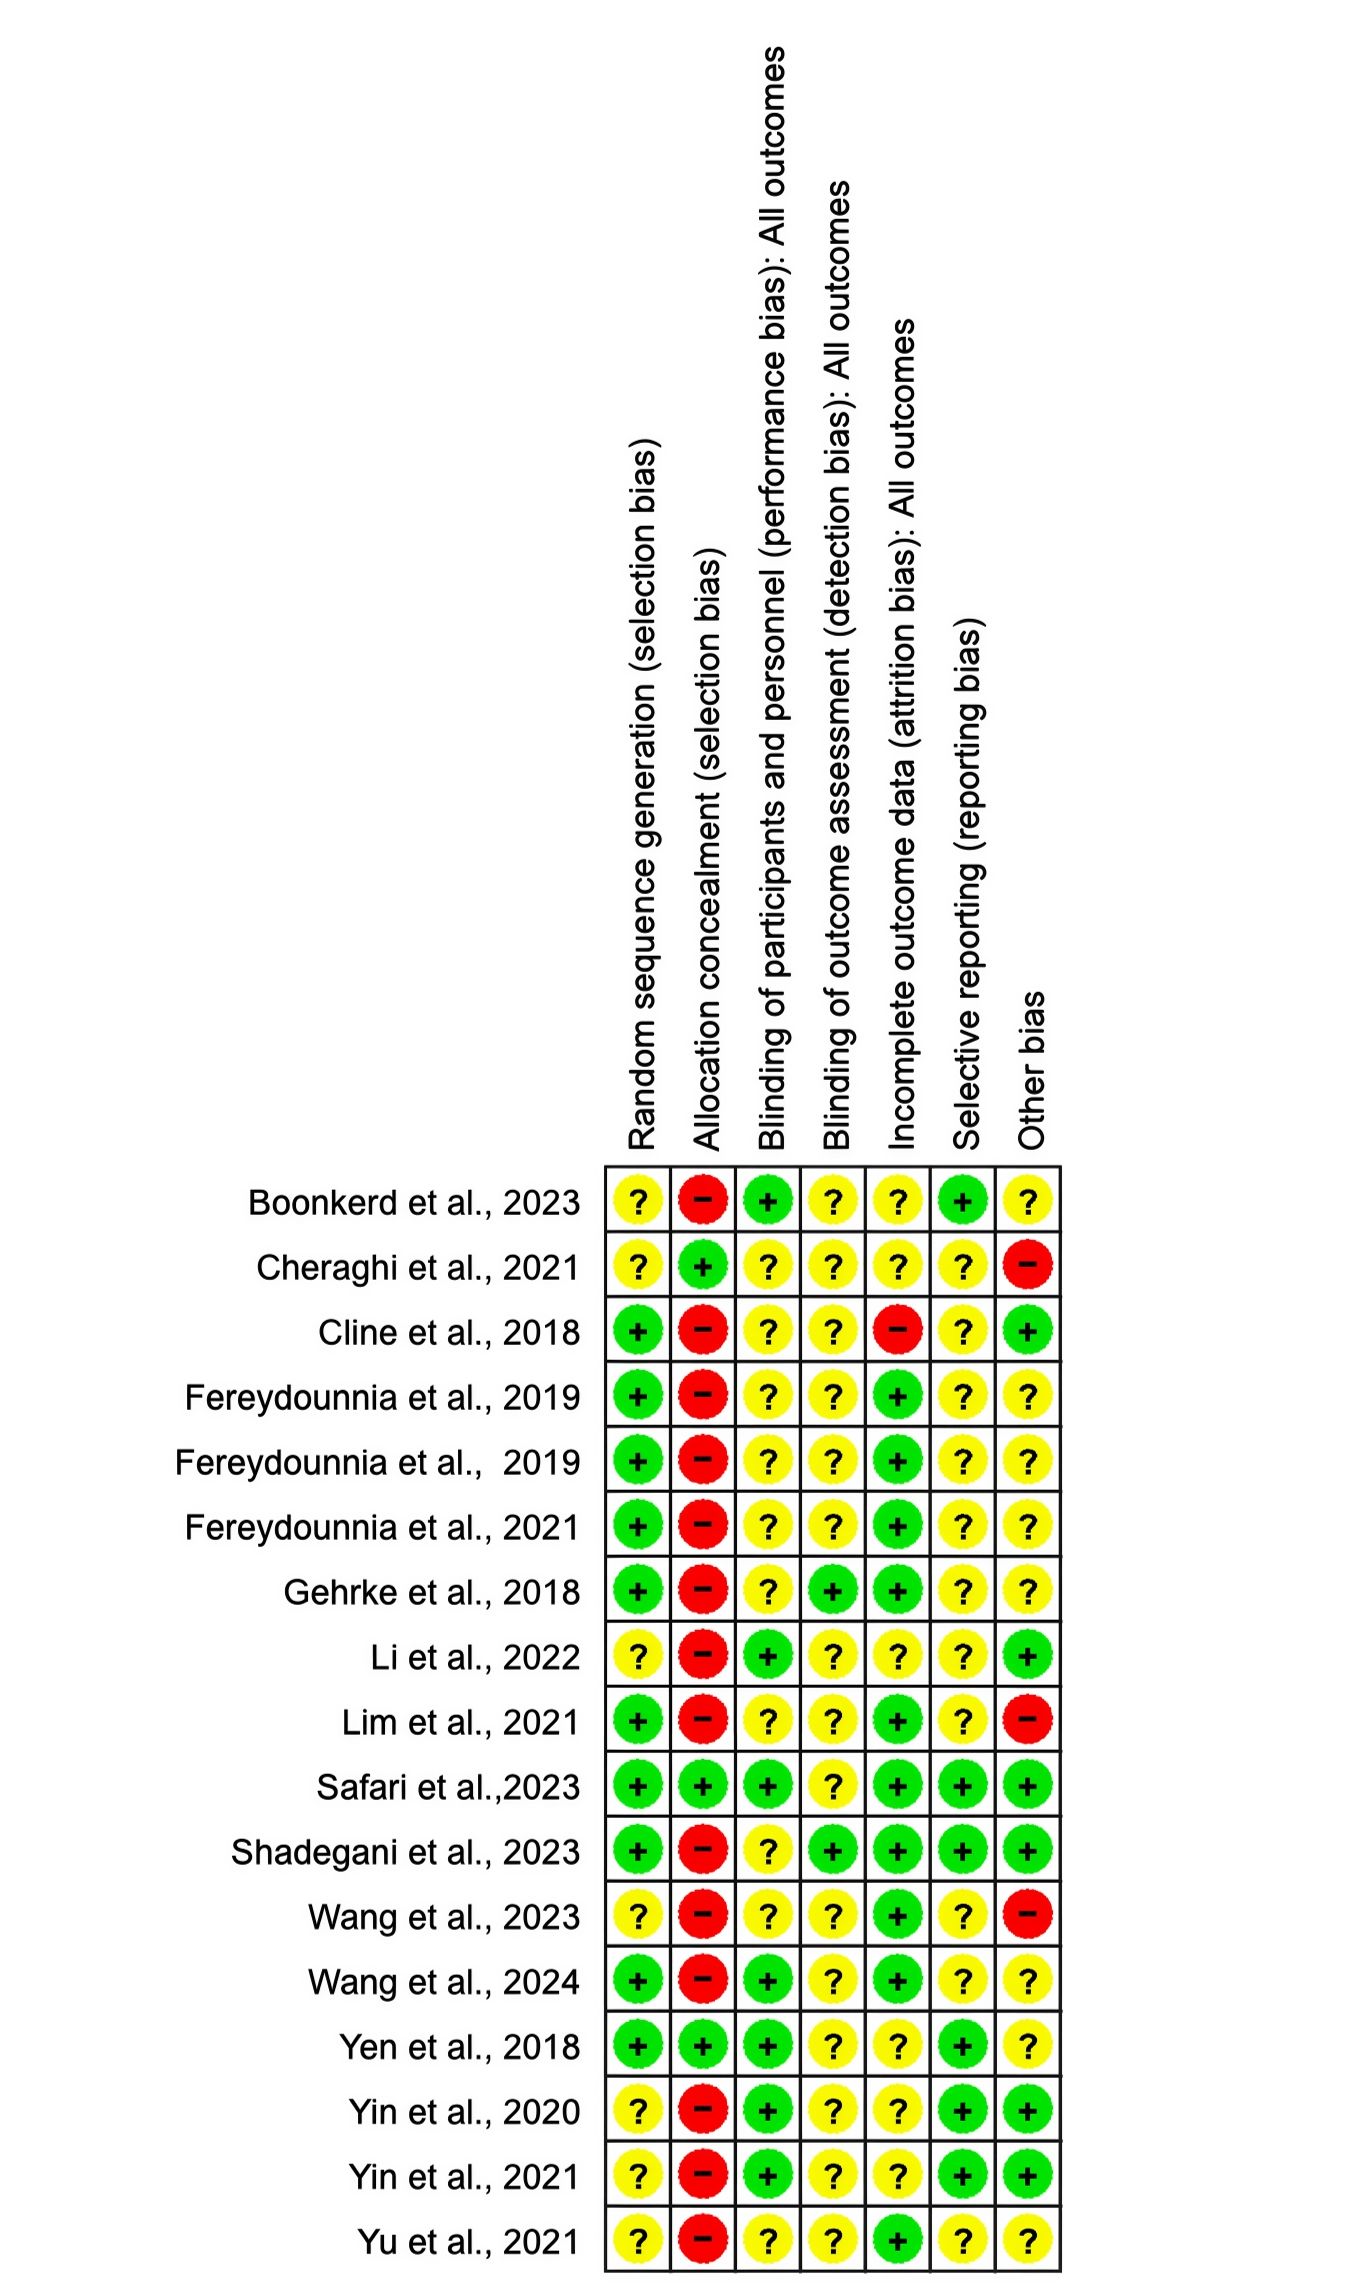
Supplementary Figure 1
Risk of bias summary for each included RCT study. RCT - randomized controlled trial
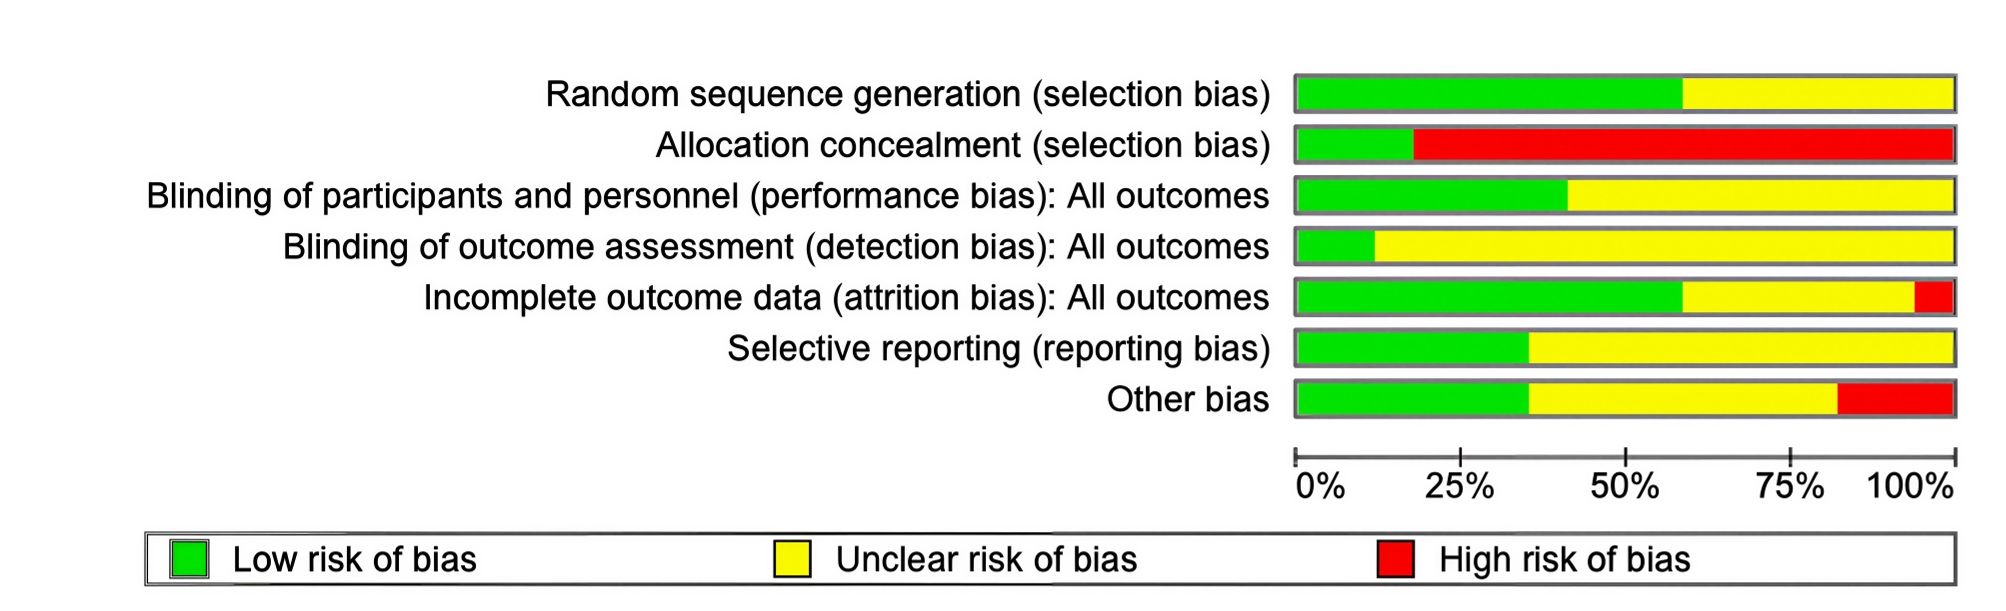
Supplementary Figure 2
Risk of bias graph for each included RCT study. RCT - randomized controlled trial
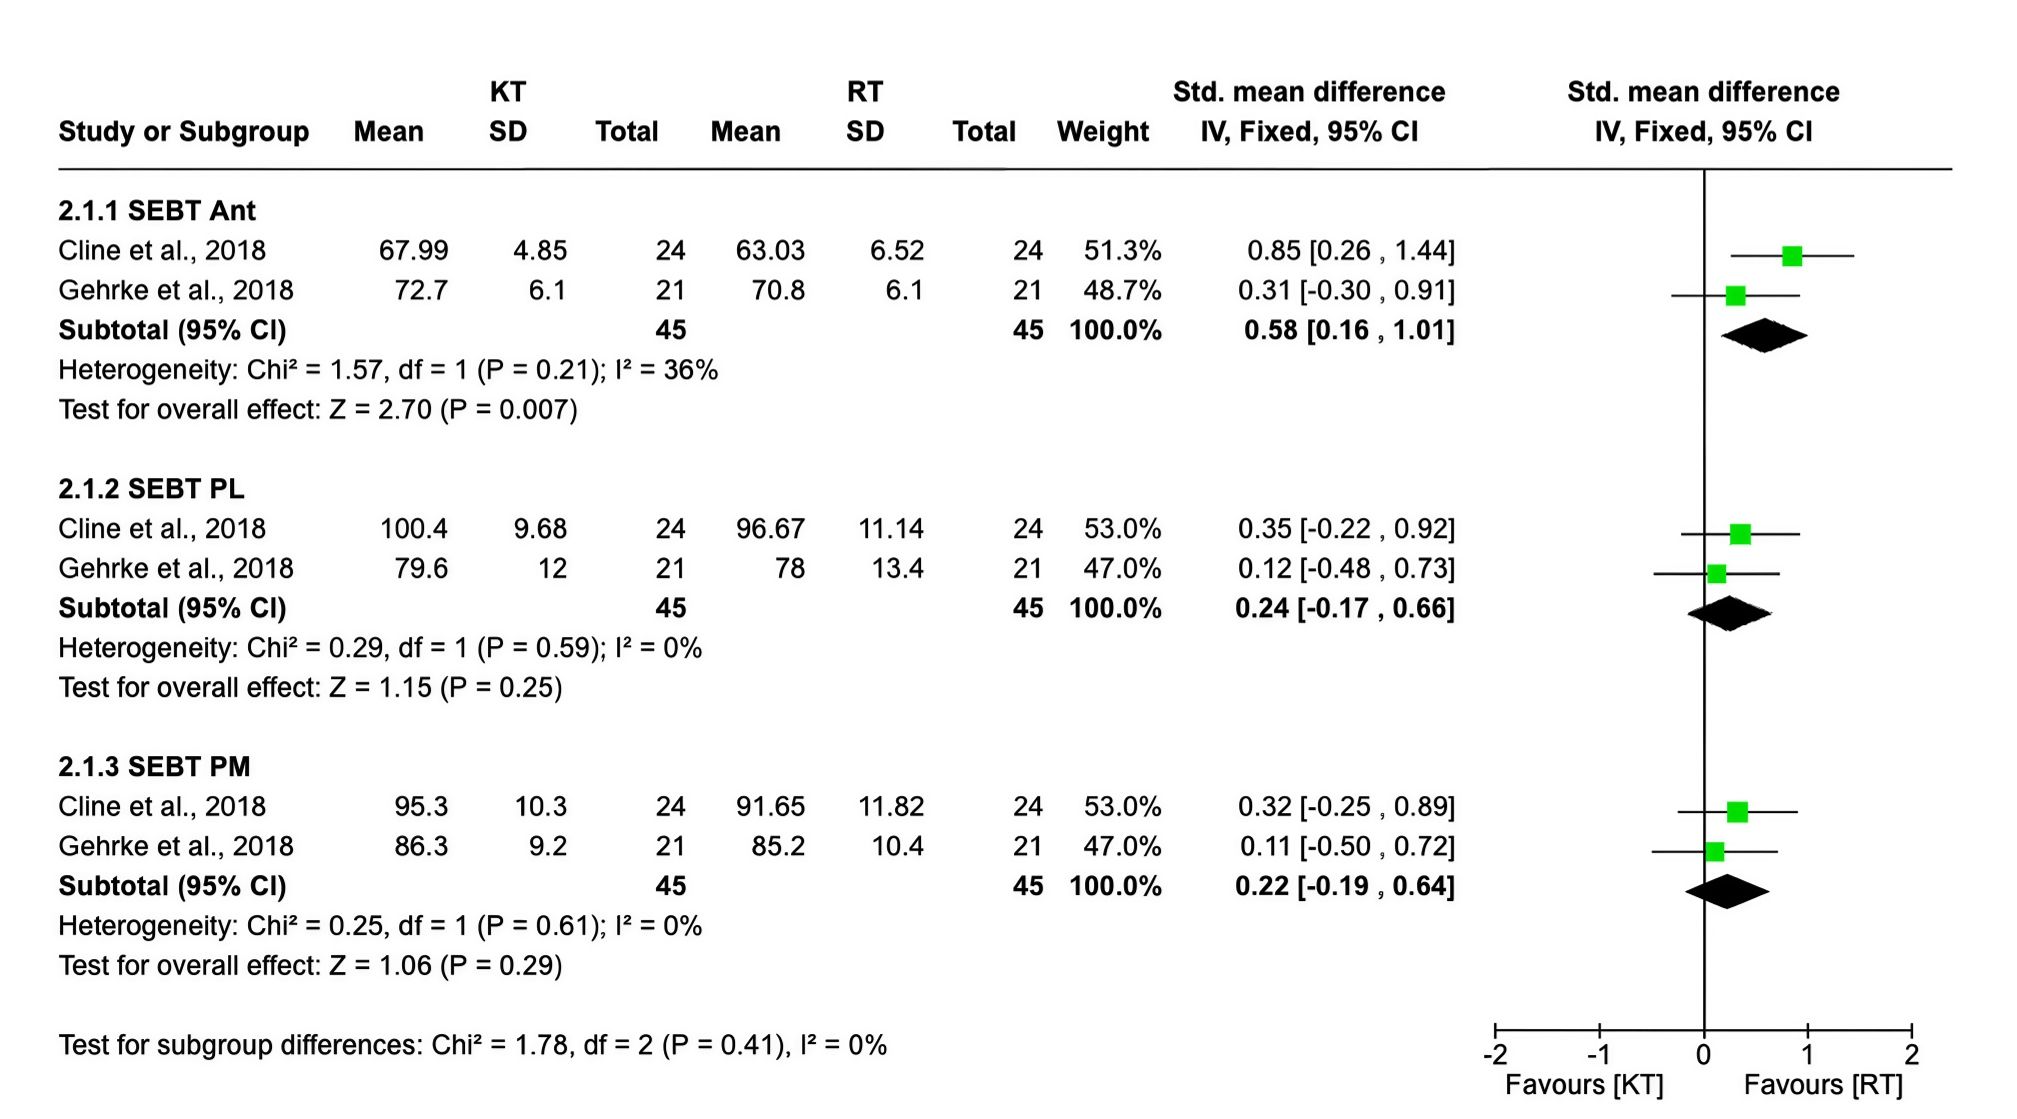
Supplementary Figure 3
Meta-analyses for the effect of KT on dynamic balance (SEBT) when KT is compared with RT. Ant - anterior, CI - confidence interval, KT - kinesiotape, PL - posterolateral, PM - posteromedial, RT - rigid tape, SD - standard deviation, SEBT - star excursion balance test
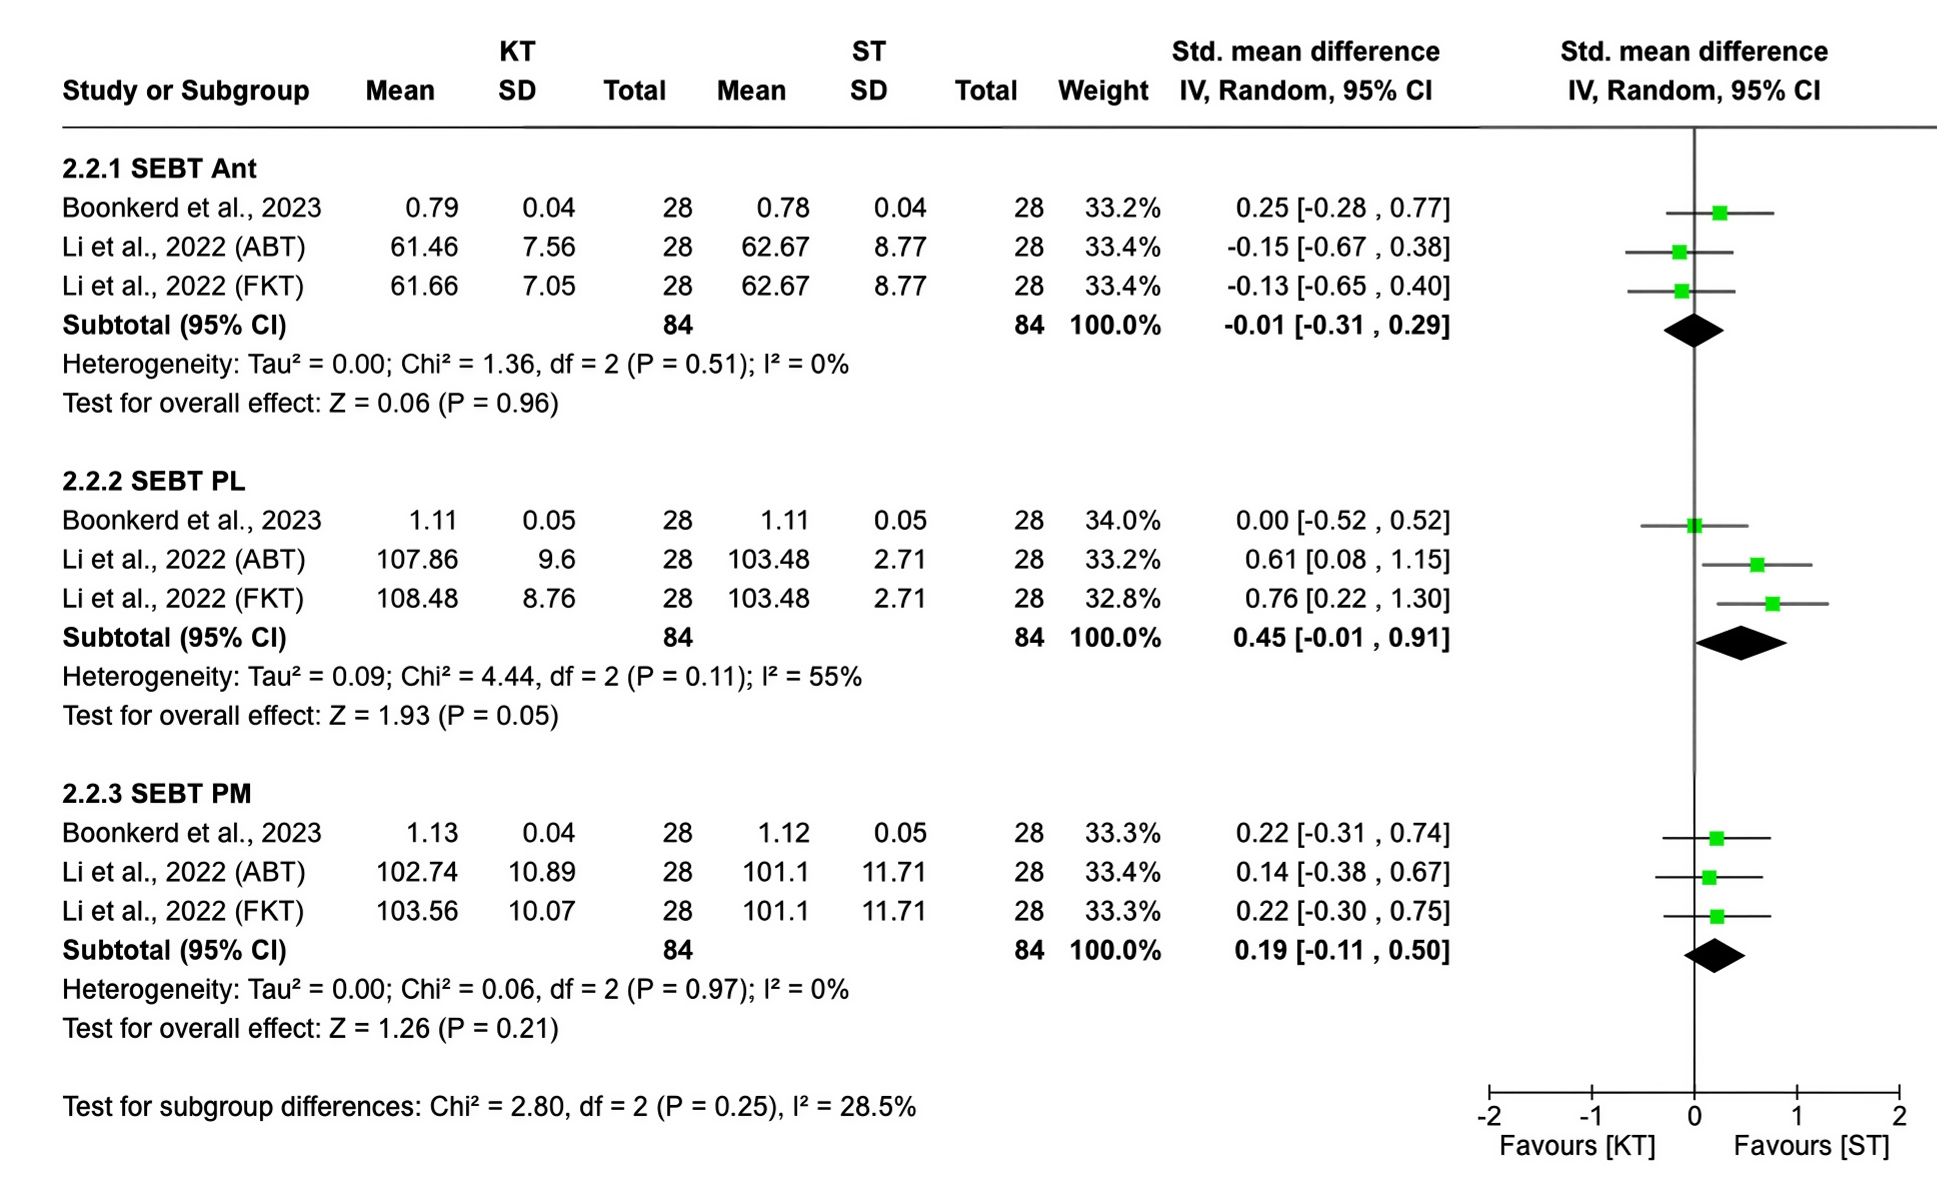
Supplementary Figure 4
Meta-analyses for the effect of KT on dynamic balance (SEBT) when KT is compared with ST. Ant - anterior; CI - confidence interval, KT - kinesiotape, PL - posterolateral, PM - posteromedial, SD - standard deviation, SEBT - star excursion balance test, ST - sham tape
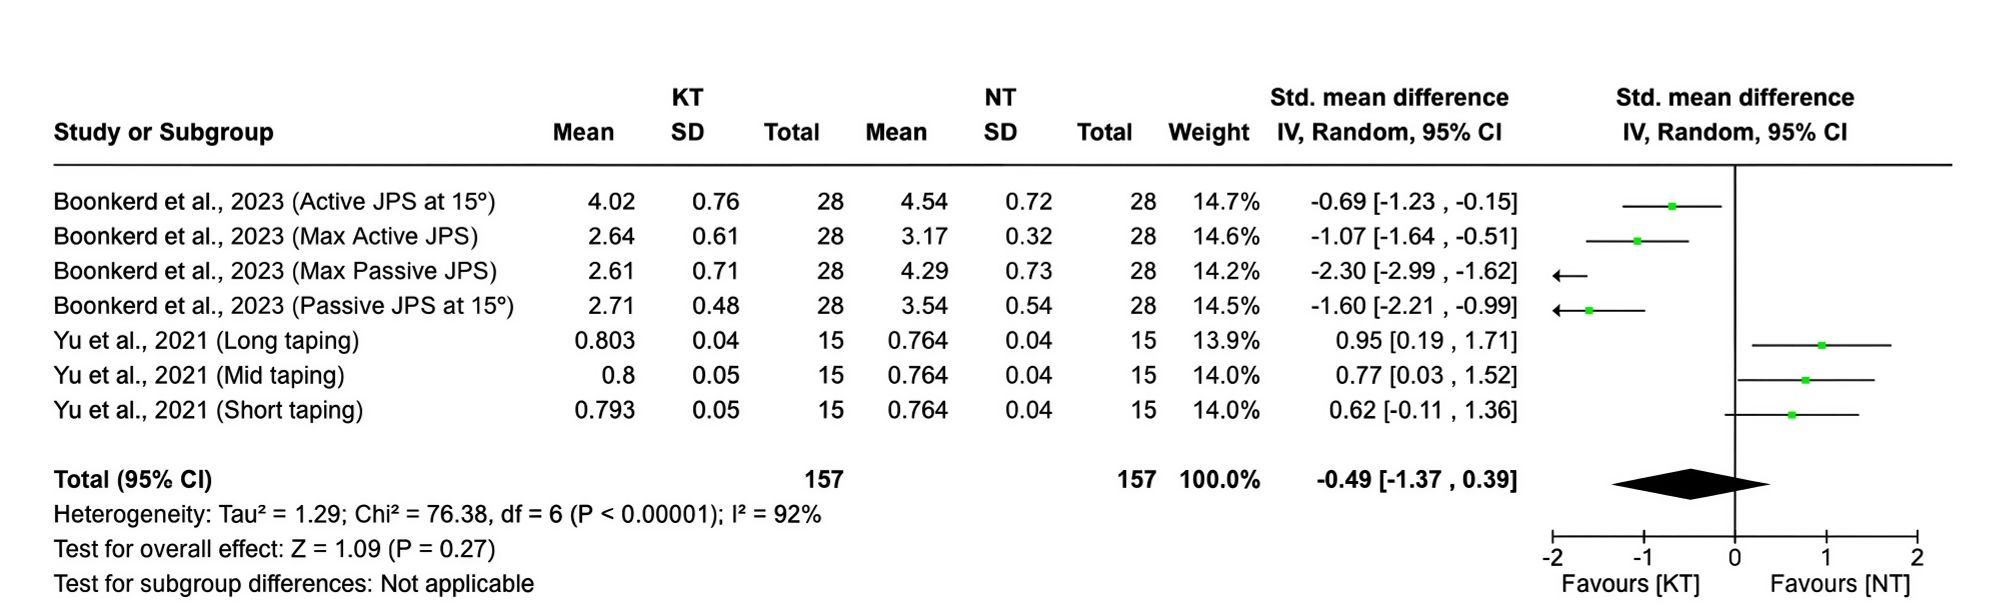
Supplementary Figure v5
Meta-analyses for the effect of KT on proprioception (inversion) when KT is compared with NT. CI - confidence interval, KT - kinesiotape, M - medial, NT - no-tape, SD - standard deviation