
INTRODUCTION
Lateral ankle sprain (LAS) is a major musculoskeletal injury that occurs both in the general and physically active population1. Up to 70% of individuals who sustain a LAS develop persistent symptoms such as pain during activity, recurrent sprains, and episodes of‘ giving way’, which may progress to chronic ankle instability (CAI). CAI is characterised by recurrent ankle sprains and underlying sensorimotor deficits2-4. CAI is also associated with decreased peroneal muscle strength5 and ankle muscle activation6. These factors collectively impair postural control7, potentially hindering sports performance and increasing the risk of injury8-9.
Additionally, reduced perceived stability (referring to the sensation that the ankle is unstable or at risk of giving way) is a common complaint among individuals with CAI10. Perceived stability has been shown to be positively correlated with functional performance, particularly during the Y-balance test (YBT)11. As a result, it is critical to take both ankle function and perceived stability into account while treating CAI.
Kinesiotape (KT) is a commonly used external support that may influence ankle function through cutaneous stimulation and enhanced proprioceptive feedback, which may help improve sensorimotor control in individuals with CAI12. KT is widely used as an adjunctive method of muscle and joint support in musculoskeletal disorders, but the evidence on its efficacy in managing and preventing ankle injuries is still under debate. One systematic review reported that KT offers improved dynamic balance compared with other taping techniques, such as athletic taping13. In contrast, according to another systematic review, KT might not improve the functional performance in individuals with unstable ankles14. These inconsistent findings may partly reflect the methodological heterogeneity across studies, including differences in study design, outcome measures and participant characteristics.
The most recent systematic review15, however, suggests that, among athletes participating in the most popular contact sports (football, basketball, volleyball, baseball) with CAI, KT significantly improved ankle function and sports performance. Nevertheless, several methodological limitations can be noted in this review, including a potentially inconsistent definition of CAI, an unclear search strategy and inclusion criteria, and limitations in the meta-analytic approach and assessment of evidence quality. Additionally, none of these systematic reviews contained evidence on the effect of KT for perceived stability. Therefore, to address these gaps, this study aimed to investigate the effects of KT on ankle functional performance (such as balance and postural control) and self-reported perceived stability in individuals with CAI.
MATERIAL AND METHODS
Protocol and guidance
This study was conducted according to the PRISMA (preferred reporting items for systematic reviews and meta-analysis) guidelines16. The protocol for this review was registered with PROSPERO (CRD42024497654).
Search strategy
PubMed, Web of Science, Scopus, Physiotherapy Evidence Database (PEDro) and SPORTDiscus were searched for studies published in English from 2014 to September 2025. The starting year was selected because the International Ankle Consortium published standardised selection criteria for individuals with CAI in 2014. The final search was conducted on 6 September 2025. Terms related to ‘kinesiotape’ and ‘chronic ankle instability’ were used to prepare the search strategy. The keywords were ‘kinesio tap*’ OR ‘kinesiotap*’ OR ‘elastic tap*’ OR ‘athletic tap*’ OR ‘orthotic tap*’ AND ‘chronic ankle instability’ OR ‘functional ankle instability’, which were found in the title, abstract or keywords. The search strategy for each database is presented in Supplementary Table 1. Reference lists of included studies and relevant systematic reviews were also manually searched.
Eligibility criteria
In this systematic review, the research question is developed using the PICO strategy:
P: Population: Individuals with CAI according to the inclusion criteria of the International Ankle Consortium17.
I: Intervention: KT.
C: Comparison: Compare with other taping conditions (rigid tape [RT], mulligan tape [MT], athletic tape [AT], dynamic tape [DT], sham tape [ST] or NT).
O: Outcome: Objective ankle functional performance (dynamic balance, static balance, proprioception, muscle activation, muscle strength and sports performance) and subjective perceived ankle stability, assessed using validated instruments at baseline and post-intervention.
Studies included in the systematic review should meet the following criteria:
Individuals with CAI needed to follow the International Ankle Consortium criteria:
History of at least one ankle sprain.
History of giving way, recurrent sprain or instability.
Self-reported ankle instability or function confirmed with a validated questionnaire: Ankle Instability Instrument: answer yes to at least 5 yes/no questions (this should include question 1 plus 4 others); Cumberland Ankle Instability Tool: score of ≤24; Identification of Functional Ankle Instability: score of ≥11; Foot and Ankle Ability Measure activities of daily living subscale <90%, sport subscale < 80%; Foot and Ankle Outcome Score: score of <75% in three or more categories18-22.
Comparing KT with other taping conditions (RT, AT, MT, DT, ST, or NT).
KT is applied to the ankle joint, and at least one ankle functional performance or perceived stability is assessed with validated instruments.
Research designs only including randomised controlled trials (RCTs) (including cross-over designs).
The following exclusion criteria were followed:
Review articles, meta-analyses, clinical practice guideline, conference proceeding, case reports or protocol.
Combination KT with other exercise therapies (e.g. balance exercise, weight bearing exercise) or comparison of KT with other ankle orthoses.
A history of previous surgeries to the musculoskeletal structures (i.e. bones, joint structures, nerves) in either lower extremity.
A history of a fracture in either lower extremity requiring realignment.
Acute injury to musculoskeletal structures of other joints of the lower extremity in the previous 3 months that impacted joint integrity and function (i.e. sprains, fractures), resulting in at least 1 interrupted day of desired physical activity.
Study selection
After excluding duplicates in the literature, two reviewers (F.S. and Y.R.) reviewed the titles and abstracts of the studies. Based on the established selection criteria, the reviewers individually reviewed the full text of the remaining studies. Any disagreements in screening were resolved by discussion, and if consensus could not be reached, a third reviewer (K.T.) was consulted.
Data extraction
Data extraction was completed by an independent reviewer (F.S.). For all includable studies, the following data were extracted: author, published date, study design, participant characteristics (numbers, sex, age), intervention and comparison, KT application method, applying time, outcome measures related to ankle functional performance and perceived stability. The mean and standard deviation of the relevant outcomes were retrieved, and a meta-analysis was carried out when commonalities in population characteristics, control intervention and outcomes were found. If outcomes were reported for the CAI group and the non-CAI group, we extracted the outcome of the CAI group. During the different followup time points, the outcomes that were closest to the end of the intervention period were extracted.
Quality and risk of bias assessment
Quality and risk of bias were assessed using the original Cochrane Collaboration Risk of Bias tool (RoB 1)23. Using this tool, it can determine whether biases in reporting, selection, performance, detection, attrition and other areas are ‘high risk’, ‘unclear’ or ‘low risk’. The two reviewers reached a consensus to resolve any disagreement on the risk of bias assessment.
Data synthesis
Review Manager (RevMan)24 version 5.4 (The Cochrane Collaboration, 2023) was used for all data synthesis. We used standardised mean differences (SMDs) with 95% confidence intervals (CIs) to assess the outcomes and considered p < 0.05 as statistically significant. We assessed heterogeneity using the I2 test25. Fixed effects models were used to pool outcomes when significant heterogeneity was absent (I2 < 50%), and random effects models were used when significant heterogeneity was present (I2 ≥ 50%). The pooled SMD was interpreted as follows: small effect (<0.40), moderate effect (0.40–0.70) and large effect (>0.70)26.
Meta-analyses were organised by comparison intervention type (NT, RT or ST) and by outcome measures (dynamic balance, static balance, proprioception and perceived stability). WebPlotDigitizer (https://automeris.io/WebPlotDigitizer) was used to extract data from studies that included graphs27. Data that could not be pooled due to differences in outcome measures and the lack of studies were summarised with p-values and narrative synthesis.
The quality of the evidence for each meta-analysis was assessed by two reviewers using the GRADE (grading of recommendations assessment, development and evaluation methodology) approach28. We downgraded the quality of evidence when the following issues were discovered29: (1) Risk of bias (>75% of studies do not have low risk of bias); (2) Inconsistency (large heterogeneity based on the similarity of point estimates, statistical heterogeneity and I2 > 50%); (3) Imprecision (included population inadequately reflects selection criteria of the review, estimate of the effect is sufficiently imprecise if the upper or lower confidence limit crosses the effect size of 0.5 in either direction); (4) Indirectness (studies with indirect comparison); and (5) Publication bias (asymmetry in funnel plots where a sufficient number of studies was available), which was not possible to assess in the present review due to low number of studies in each analysis (<10 studies). The evidence quality was classified as high, moderate (downgraded one level), low (downgraded two levels) or very low (downgraded ≥three levels).
RESULTS
Study selection and characteristics Search results
We identified 294 studies from the 5 databases and finally included 17 of them in this systematic review30-46. The screen process and results are shown in Figure 1.
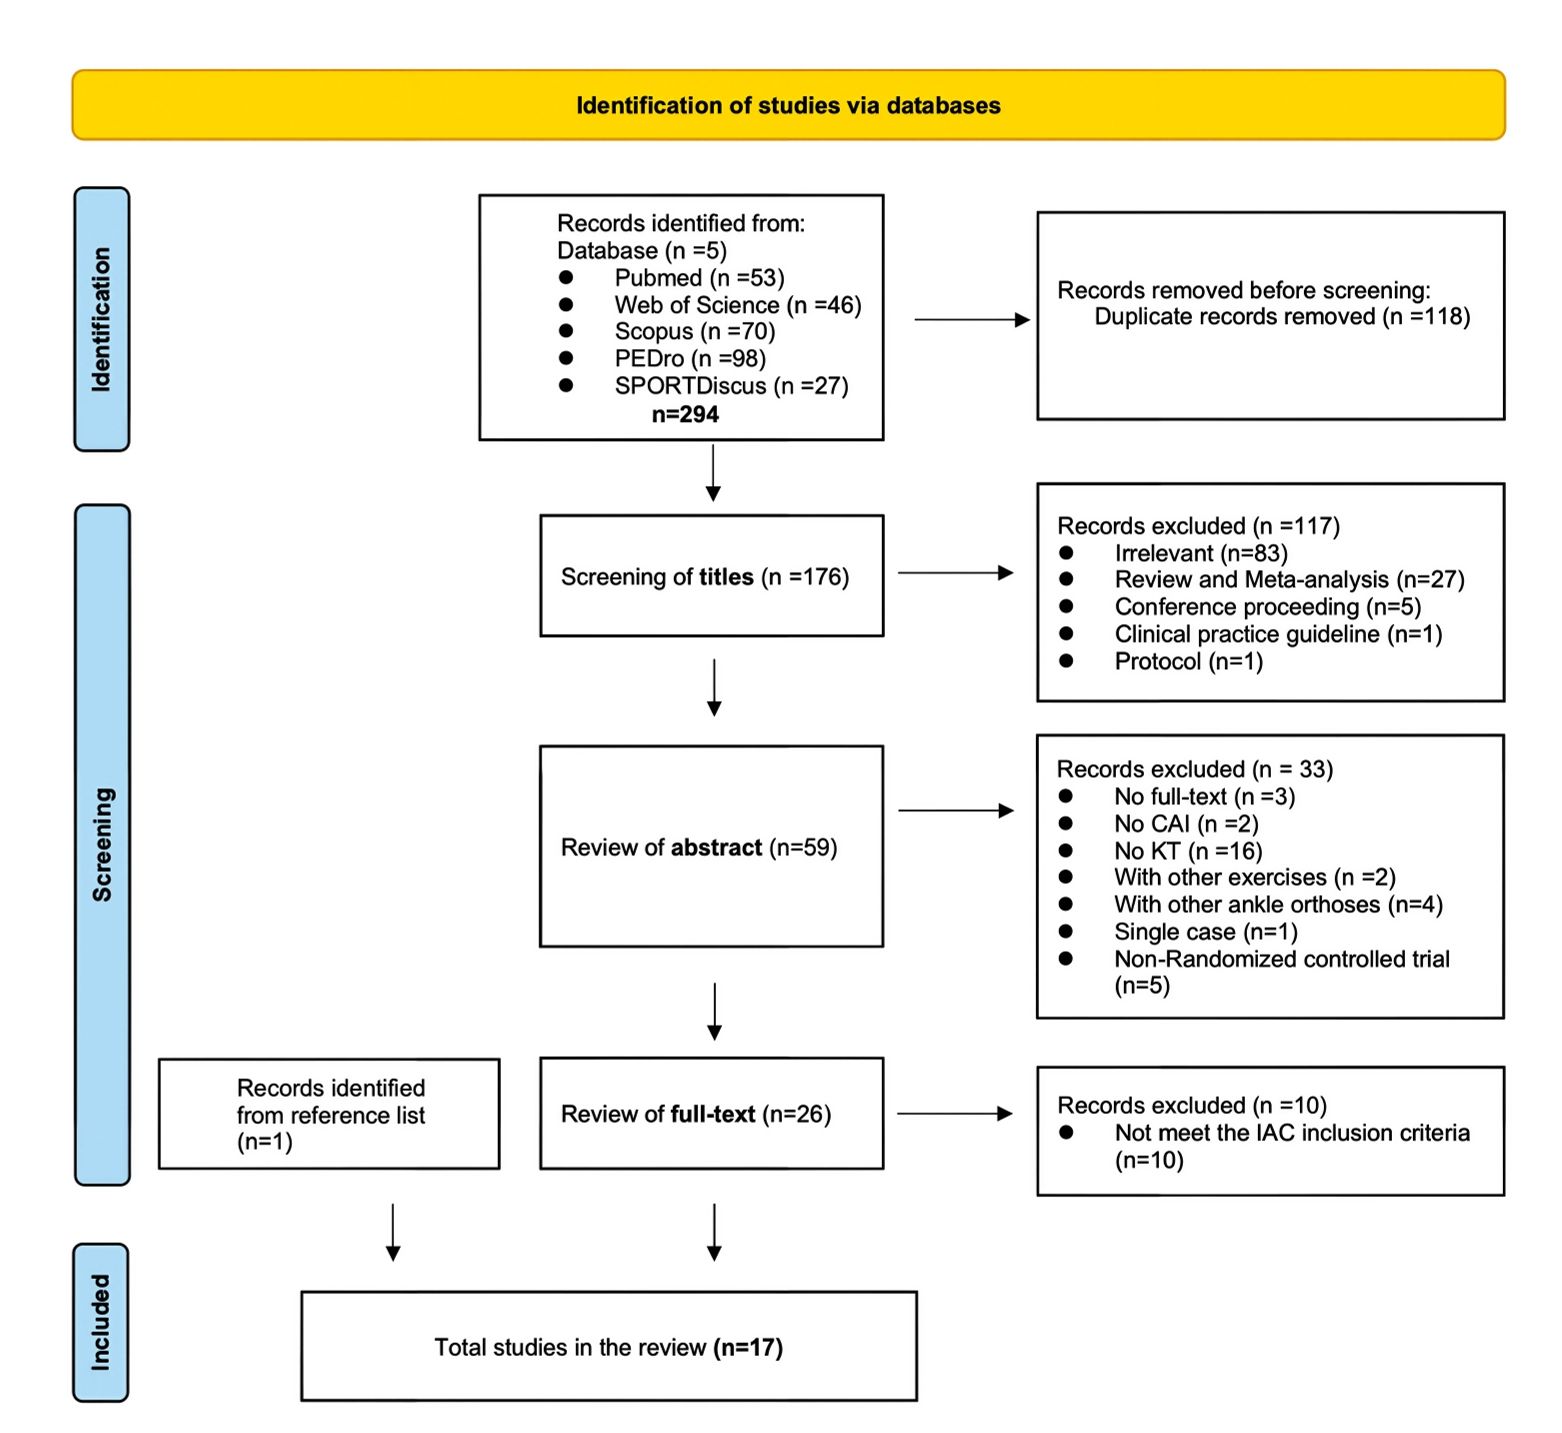
Figure 1.
Flow diagram. CAI - chronic ankle instability, KT - kinesiotape, PEDro - physiotherapy evidence database
Study characteristics
A total of 451 participants were included across the 17 studies, of whom 375 had CAI and 76 were healthy controls. Healthy participants were included in studies that used between-group comparisons to evaluate the effects of KT. All participants were young adults aged 18–36 years. The average sample size was 27 (range 15–35). Athletic participants were included in six studies31,33-36,40. To investigate the effects of KT, 15 studies compared KT with NT30-38,40-41,43-46 and 6 studies compared KT with ST, which used the same type of KT but with no tension30,38,39,43,44,46. In addition, KT was compared with other tape conditions in seven studies (RT, AT, DT and MT)32,36,37,40,42-44. The effects of KT on ankle functional performance (dynamic balance, static balance, proprioception, muscle activation, muscle strength and sports performance) were investigated using 25 outcome measures in 17 studies. Furthermore, two studies assessed KT’s impacts on perceived stability32,43. In 11 studies, outcomes were evaluated immediately following application of KT30,32,36-38,41-46, while in 5 studies outcomes were evaluated at about 20–30 minutes after KT application31,33-35,39, since prior research confirmed that KT is most effective at 20 minutes after treatment47. In addition, outcomes were evaluated at 24 hours after KT application in two studies39,40. The details of the author, published date, study design, participant characteristics (numbers, sex, age), intervention and comparison, KT application method, applying time and outcome measures of the studies are presented in Supplementary Table 2.
Quality and risk of bias assessment
The results of risk of bias are shown in Supplementary Figures 1 and 2. Overall, the included studies were judged to have a high risk of bias, with 15 studies rated as high risk and 2 as unclear risk; no study was considered as low risk. At the domain level, allocation concealment was frequently rated as high risk. Blinding of participants and personnel and blinding of outcome assessment were often judged as unclear risk because these procedures were insufficiently reported. Incomplete outcome data was generally judged as low risk, whereas selective reporting was mostly rated as low or unclear risk. In crossover studies, other bias was frequently judged as unclear because washout periods were not consistently reported, making it difficult to determine the potential for carry-over effects.
Findings Dynamic balance
Nine studies examined the effects of KT on dynamic balance30,32,34,36-39,41,43. Dynamic balance was evaluated using various outcome measures, including the star excursion balance test (SEBT)/Y Balance, Limits of stability, Motor control test, and Adaptation test. Only SEBT and YBT outcomes were sufficiently comparable across studies to permit meta-analysis.
For the pooled analyses, separate meta-analyses were conducted according to the direction of reach and the comparator. Compared with NT, KT was associated with statistically significant improvements in the posterolateral direction based on data pooled from seven studies30,32,34,36,38,39,41 (SMD, 0.45; 95% CI, 0.23–0.66; low-quality evidence) (Figure 2 and Table 1). In the posteromedial direction, eight studies were pooled30,32,36-39,41 and KT was associated with a statistically significant improvement compared with NT (SMD, 0.46; 95% CI, 0.26–0.67; low-quality evidence) (Figure 2 and Table 1).
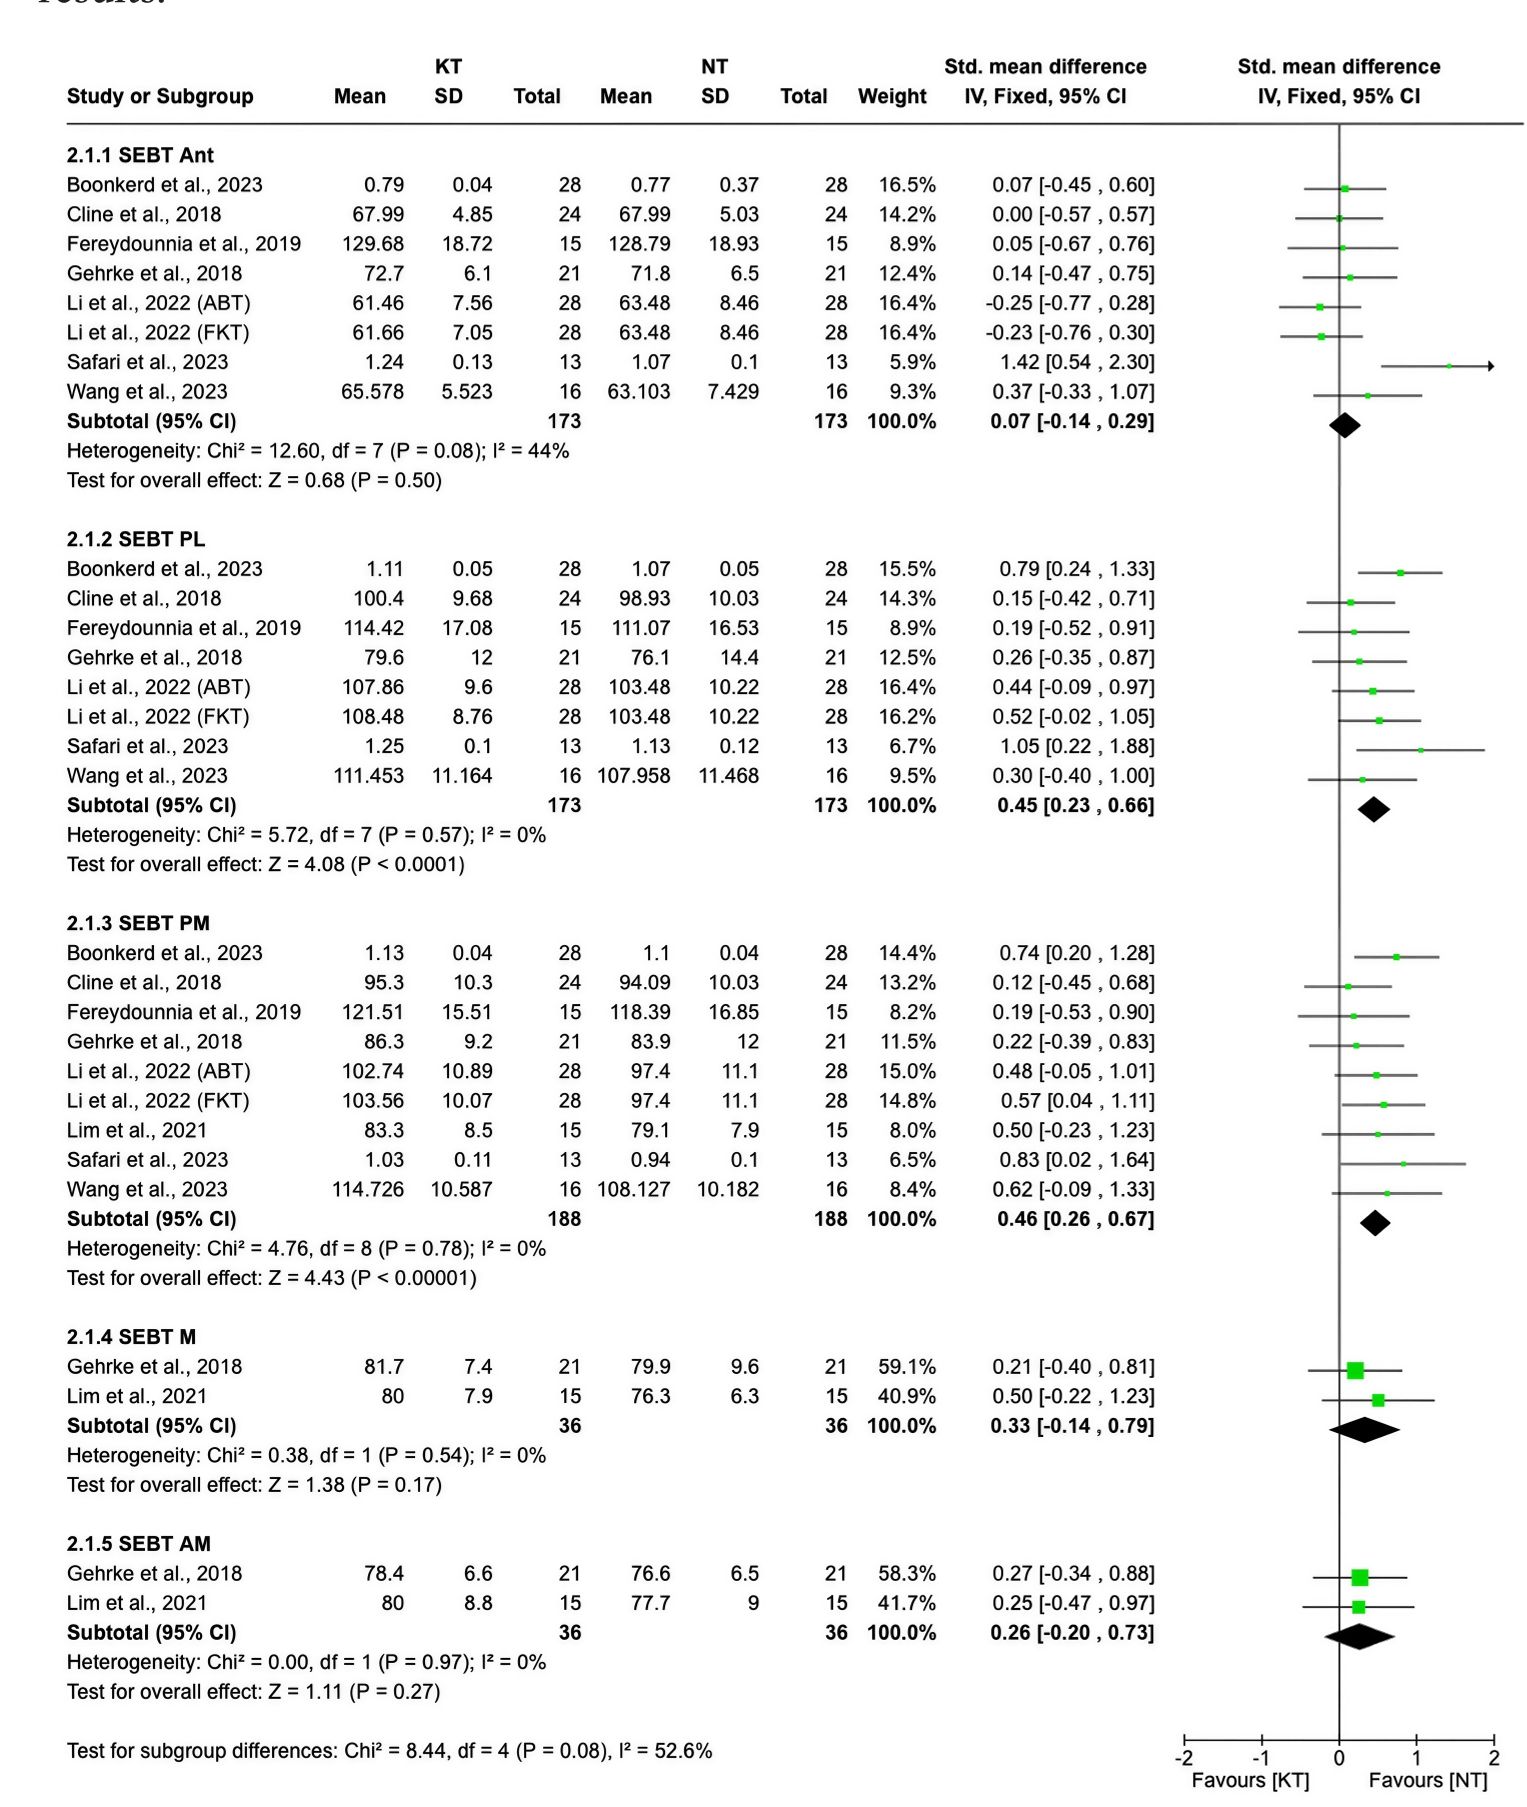
Figure 2.
Meta-analyses for the effect of KT on dynamic balance (SEBT/YBT) when KT is compared with NT. AM - anterior medial, Ant - anterior, CI - confidence interval, KT - Kinesiotape, M - medial, NT - no-tape, PL - posterolateral, PM - posteromedial, SD - standard deviation, SEBT - star excursion balance test, YBT - Y balance test
Table 1.
Quality of the evidence and summary of findings in dynamic balance
| Dynamic balance (SEBT) | ||||||
|---|---|---|---|---|---|---|
| KT vs NT | ||||||
| Meta-analysis | Risk of bias | Inconsistency | Imprecision | Indirectness | Publication bias | Quality |
| Anterior | Serious | Not serious | Not serious | Not serious | NA | Moderate |
| Posterolateral | Serious | Not serious | Serious | Not serious | NA | Low |
| Posteromedial | Serious | Not serious | Serious | Not serious | NA | Low |
| Medial | Serious | Not serious | Serious | Not serious | NA | Low |
| Anterior medial | Serious | Not serious | Serious | Not serious | NA | Low |
| KT vs RT | ||||||
| Meta-analysis | Risk of bias | Inconsistency | Imprecision | Indirectness | Publication bias | Quality |
| Anterior | Serious | Not serious | Serious | Not serious | NA | Low |
| Posterolateral | Serious | Not serious | Serious | Not serious | NA | Low |
| Posteromedial | Serious | Not serious | Serious | Not serious | NA | Low |
| KT vs ST | ||||||
| Meta-analysis | Risk of bias | Inconsistency | Imprecision | Indirectness | Publication bias | Quality |
| Anterior | Serious | Not serious | Not serious | Not serious | NA | Moderate |
| Posterolateral | Serious | Serious | Serious | Not serious | NA | Very low |
| Posteromedial | Serious | Not serious | Serious | Not serious | NA | Low |
Compared with RT, KT was associated with a statistically significant improvement in the anterior direction based on data from two studies32,36 (SMD, 0.58; 95% CI, 0.16–1.01; low-quality evidence) (Supplementary Figure 3 and Table 1).
In contrast, compared with ST, pooled analyses from two studies showed no statistically significant differences in any SEBT direction30,38 (Supplementary Figure 4 and Table 1).
One study was not included in the meta-analysis because dynamic balance was assessed using different outcome measures43. This study reported 32 between-group comparisons, of which only two showed statistically significant differences (Supplementary Table 3), suggesting limited consistency across the non-pooled results.
Static balance
Five studies evaluated the effect of KT on static balance30,32,37,38,43 using different outcome measures, including centre of pressure (COP) data variables during the one-leg standing test, Balance Error Scoring System, time-to-boundary, sensory organisation test and sway velocity of centre of gravity in unilateral stance. Only COP outcomes were sufficiently comparable across studies to permit meta-analysis.
For the pooled analyses, KT was associated with a statistically significant decrease in mediolateral COP range compared with no tape (NT) based on data from two studies32,38 (SMD, −0.38; 95% CI, −0.69 to −0.06; moderate-quality evidence) (Figure 3 and Table 2). KT was also associated with a statistically significant decrease in sway area compared with NT based on data from two studies37,38 (SMD, −0.36; 95% CI, −0.69 to −0.03; low-quality evidence) (Figure 3 and Table 2). No statistically significant differences were observed for other pooled static balance outcomes.
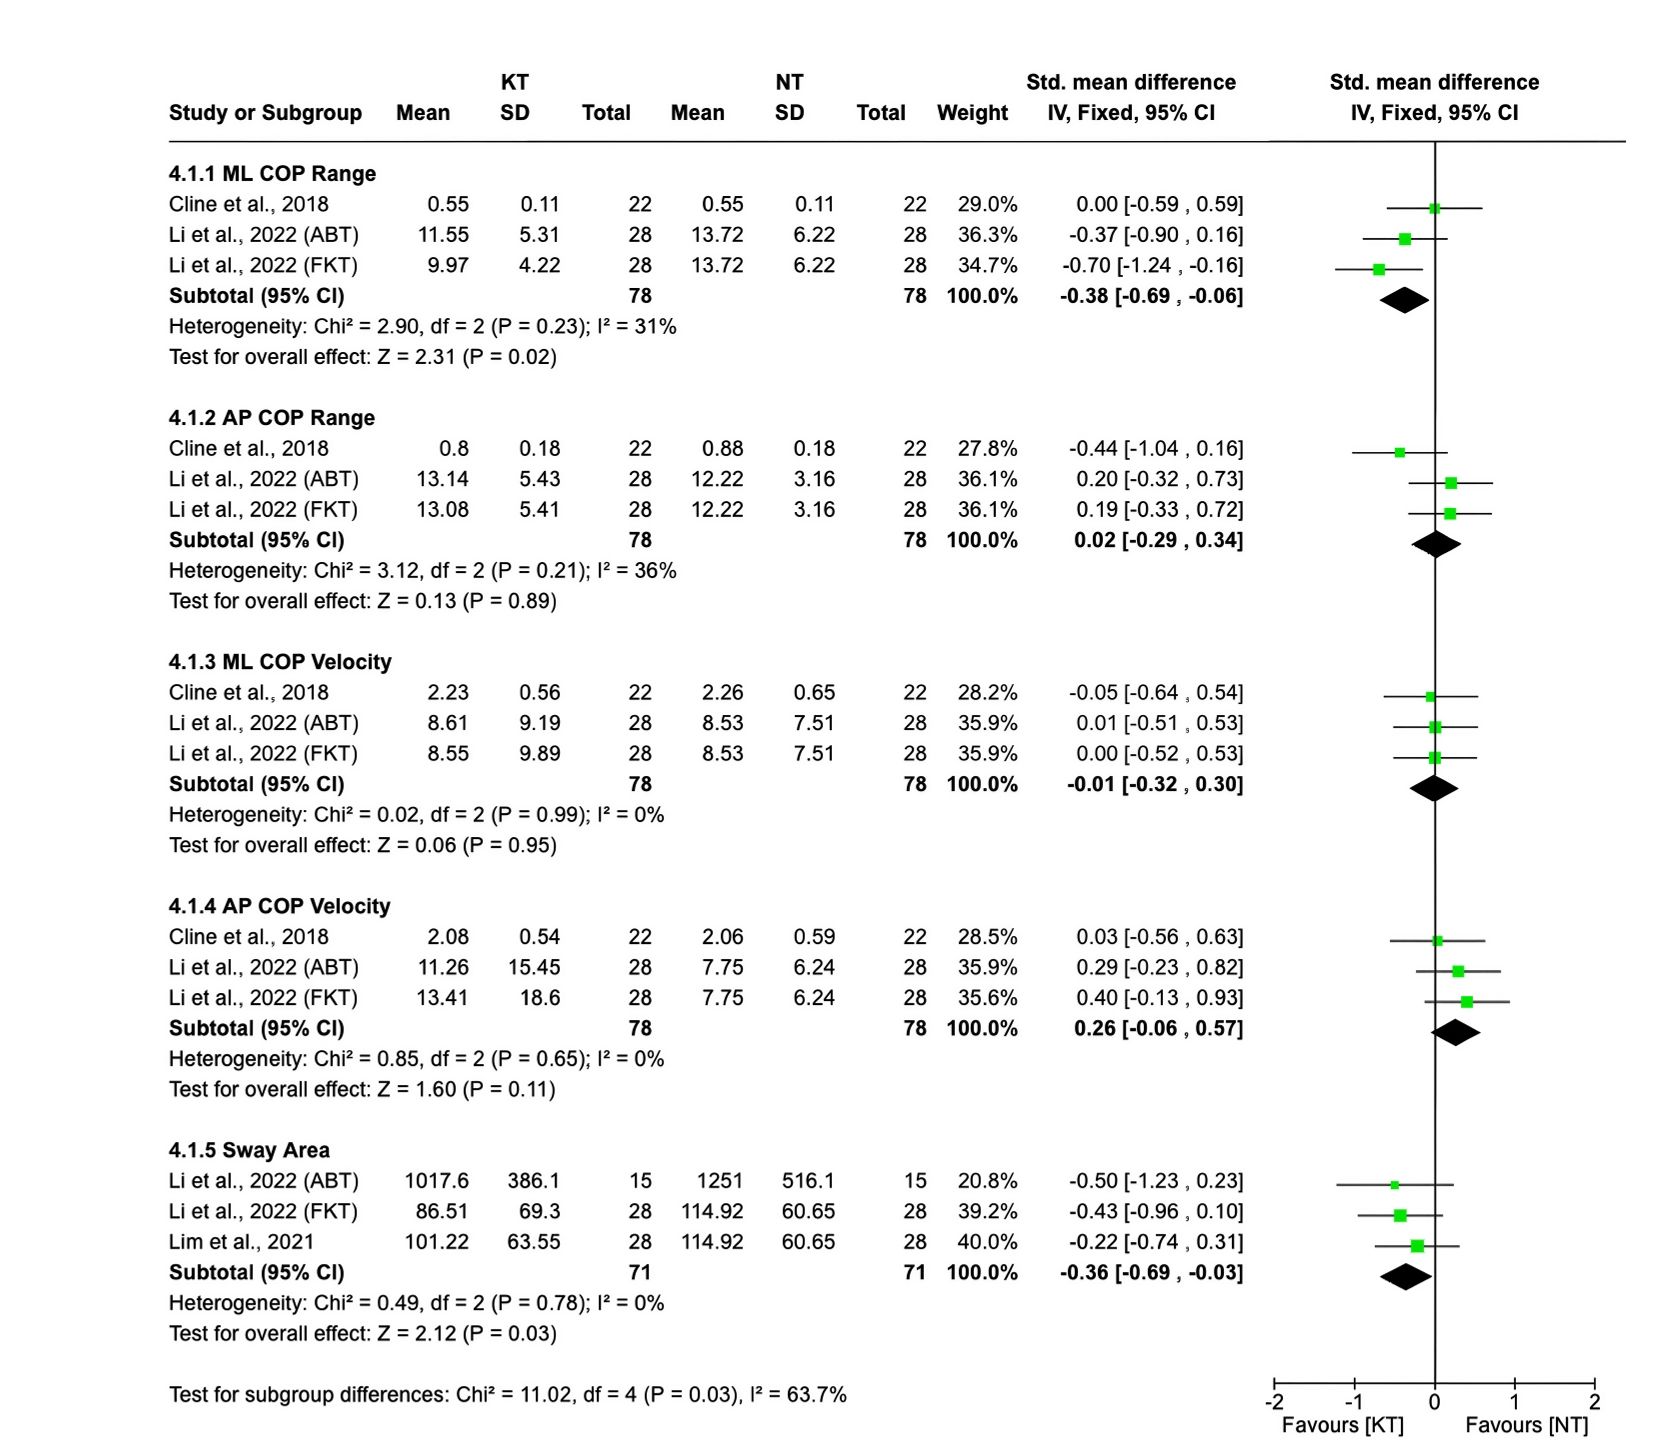
Figure 3
Meta-analyses for the effect of KT on static balance (COP) when KT is compared with NT. AP - anteroposterior, CI - confidence interval, COP - centre of pressure, KT - kinesiotape, ML - mediolateral, NT - no-tape, SD - standard deviation
Table 2.
Quality of the evidence and summary of findings in static balance
| Static balance (COP) | ||||||
|---|---|---|---|---|---|---|
| KT vs NT | ||||||
| Meta-analysis | Risk of bias | Inconsistency | Imprecision | Indirectness | Publication bias | Quality |
| ML COP range | Serious | Not serious | Not serious | Not serious | NA | Moderate |
| AP COP range | Serious | Not serious | Not serious | Not serious | NA | Moderate |
| ML COP velocity | Serious | Not serious | Not serious | Not serious | NA | Moderate |
| AP COP velocity | Serious | Not serious | Serious | Not serious | NA | Low |
| Sway area | Serious | Not serious | Serious | Not serious | NA | Low |
Two studies were not included in the meta-analysis because static balance was assessed using different outcome measures30,43. These studies reported 44 between-group comparisons, of which only one showed a statistically significant difference (Supplementary Table 4), indicating limited consistency across the non-pooled results.
Proprioception
Four studies investigated the effect of KT on proprioception30,38,44,45, using various outcome measures, including joint position sense, threshold to detect passive motion, force sense and the Ankle Inversion Discrimination Apparatus for Landing. Only inversion joint position sense outcomes were sufficiently comparable across studies to permit meta-analysis.
Pooled analysis of two studies showed no statistically significant difference between KT and NT for inversion joint position sense30,45 (SMD, −0.49; 95% CI, −1.37–0.39), based on very low-quality evidence (Supplementary Figure 5 and Table 3). Two studies were not included in any meta-analysiss38,44 due to differences in outcome measures. These two studies reported 44 between-group comparisons, none of which showed statistically significant differences (Supplementary Table 5).
Muscle activation
Three studies examined the effect of KT on muscle activation31,40,44. Reported outcomes included peak muscle activity, onset time and latency responses, antagonist co-activation and root mean square (RMS) values of muscle activity.
Compared with NT, one study found that KT was associated with higher lateral and medial gastrocnemius activity and lower peroneus longus activity during a countermovement jump task31. Another study reported that both KT and MT were associated with changes in onset time, short- and medium-latency response magnitude and antagonist co-activation during sudden inversion perturbation compared with NT40. A third study showed that, during computerised dynamic posturography, lateral gastrocnemius RMS was lower with AT than with KT under one sensory organisation condition, whereas peroneus longus RMS was lower with KT than with ST during a forward-small motor control test perturbation44.
And it was shown that both the KT and MT can affect the onset time, magnitude and antagonist co-activation of muscles during short and medium latency response compared with NT40 (Supplementary Table 6).
Muscle strength
Only one study examined the effect of KT on muscle strength using ankle isokinetic muscle strength34. Compared with NT, KT was associated with increased average ankle evertor muscle strength. (Supplementary Table 7).
Sports performance
Seven studies evaluated the effects of KT on sports performance31,34-36,39,42,46, using a variety of outcome measures, including jumping tasks, functional hopping or agility tests and gait-related tasks.
For jumping-related outcomes, one study reported that, during countermovement jump performance, KT was associated with reduced ankle inversion/eversion range of motion and increased ankle dorsiflexion–plantarflexion range of motion, jump height, ankle plantarflexion angular velocity, average peak force, rate of force development, peak power and ankle joint power compared with NT31. In another study of unexpected jumping, KT was associated with reduced ankle plantarflexion at initial contact, increased peak ankle dorsiflexion and eversion angles and moments during early landing, and reduced peak vertical ground reaction force compared with NT and ST46.
For functional hopping and agility tasks, the findings were inconsistent. Although one study reported a statistically significant difference in Figure-of-8 test performance between KT and NT36, another study found no statistically significant difference for the same test34. In addition, one study found that, in the single hop test, the KT group achieved greater hop distance than the sham group after 20 minutes and 24 hours, while in the side hop test, a statistically significant difference was observed only in average time after 20 minutes39.
For gait-related outcomes, one study reported that KT was associated with increased ankle eversion during early stance in treadmill walking compared with NT, but no difference was observed during late stance42. By contrast, two studies found no statistically significant effects of KT on gait initiation profile or on the temporal and spatial parameters of gait initiation34,35.
Overall, evidence for sports performance outcomes was heterogeneous and inconsistent across studies (Supplementary Table 8).
Perceived stability
Two studies investigated the perceived stability effects of KT32,43. Visual analogue scale scores were sufficiently comparable across studies to permit meta-analysis, with higher scores indicating greater perceived stability. Pooled analysis showed that KT was associated with higher perceived stability than NT32,43 (SMD, 0.89; 95% CI, 0.51–1.28), based on low-quality evidence from two studies (Figure 4 and Table 4).
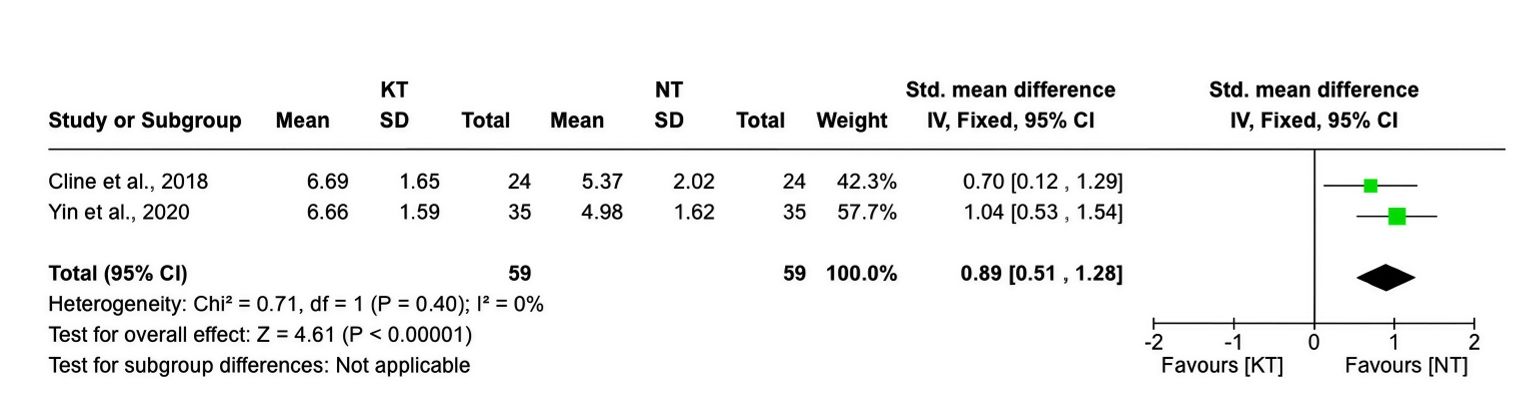
Figure 4
Meta-analyses for the effect of KT on perceived stability (VAS score) when KT is compared with NT. CI - confidence interval, KT - kinesiotape, NT - no-tape, SD - standard deviation, VAS - visual analogue scale
DISCUSSION
This systematic review and meta-analysis investigated the effectiveness of KT on functional ankle performance and perceived stability when applied to the ankles of patients with CAI. Although 17 studies were included in the review, only 10 studies contributed to the meta-analyses of dynamic balance, static balance, proprioception and perceived stability. The pooled findings suggest that KT may improve specific dynamic and static balance outcomes, as well as perceived stability, whereas no significant effect was observed for proprioception. However, these findings were based on a limited number of studies in each meta-analysis, and the quality of evidence was generally low.
One possible explanation for the improvement in dynamic and static balance is that KT may stimulate cutaneous mechanoreceptors around the ankle, thereby increasing sensory input48. In addition, when compared with the RT, KT showed a more significant effect on the SEBT reach distance, which may be due to the properties of the RT. Previous research indicated that performance is more likely to be adversely affected by tapes that are tighter and more restrictive49. However, findings related to balance are inconsistent with those of previous studies. These inconsistencies may reflect differences in sample size15, methodological heterogeneity and the definition of CAI14 across previous reviews.
No consistent evidence was found to support an effect of KT on proprioception, although the certainty of evidence was very low. This may be due to KT’s retraction force stimulation being limited to superficial skin, and thus, not reaching the deep proprioceptive receptors located in the muscle spindle and tendon organs50. In contrast to our findings, earlier research suggested that KT provides sensory input, while the central nervous system creates a new perceptual trace to improve ankle proprioceptive function in CAI45,51. A major contributor to inconsistency across studies may be the differences in proprioceptive outcome measures and taping protocols.
In sports performance, KT showed better effects in challenging tasks31,34,36,39,46 (jumping tasks and functional hopping or agility tests) than in simple tasks (gait-related outcomes)33,35,42, which may be because these tasks encompass several physical components, such as coordination and velocity, and are therefore good representatives of the functional movements required during sports practice52. One possible explanation is that KT may influence muscle activation and joint stability, which could contribute to improved performance in these complex movements53. Conversely, simpler tasks such as gait initiation may not benefit as much from KT because they involve fewer dynamic movements and fewer neuromuscular challenges54. The inconsistent Figure-of-8 test results may be related to differences in the study populations, particularly the inclusion of athletes who may use compensation strategies during the task34,36. Overall, the findings were heterogeneous across studies, suggesting that the effects of KT on sports performance may be task-specific.
Based on two studies, KT improved perceived stability in individuals with CAI32,43. Physical support provided by the tape may improve their perceived stability and confidence55, which could in turn contribute to reduced kinesiophobia and better sports performance. Because kinesiophobia occurs more often in patients with CAI than in healthy people56 and is related to decreased perceived stability with CAI10, further research is necessary to investigate the effects of KT on kinesiophobia with CAI. Understanding how KT influences psychological factors, such as confidence and kinesiophobia, could be crucial for optimising rehabilitation strategies in CAI, potentially leading to better clinical outcomes.
Because most of the results of the meta-analyses were based on low- or very low-quality evidence and the included studies generally showed an overall high risk of bias, the current findings should be interpreted with caution. Furthermore, given the statistical multiplicity in this review, the possibility that some of the significant findings observed in 6 of the 18 meta-analyses occurred by chance exists57. Therefore, these results may not fully reflect the true effects of KT. The quality of the included studies was limited, highlighting the need for more rigorous and high-quality studies. Future studies should employ larger sample sizes, apply appropriate blinding, use validated outcome measures, explore different KT techniques and include longer follow-up periods to better assess the effects of KT.
LIMITATIONS
One limitation of the current review is that only studies published in English were included, which may have introduced language bias. However, we searched five databases and used a comprehensive search strategy. In addition, the papers included in this review were published from 2014 to September 2025, following the publication of the International Ankle Consortium selection criteria for individuals with CAI17. Although these methods were intended to maximise study identification, it remains possible that some relevant studies were not identified. Furthermore, most included studies recruited young and physically active participants, which may limit the generalisability of the findings to older adults or less active individuals with CAI.
CONCLUSIONS
This systematic review and meta-analysis suggests that KT may be associated with improvements in selected dynamic and static balance outcomes, as well as perceived stability, in individuals with CAI. However, no consistent evidence of an effect was found for proprioception, and the certainty of evidence for most outcomes was low or very low. KT may therefore be considered as a potential adjunct to rehabilitation rather than a standard intervention. Further high-quality RCTs using standardised CAI definitions, validated outcome measures and longer follow-up periods are needed to clarify the effects of KT and optimise its clinical application.
Notes
[5] Conflicts of interest CONFLICTS OF INTEREST
The authors declared no potential conflicts of interest with respect to the research, authorship and/or publication of this article.
Supplementary Table 1.
Search strategy used for each database
| Database | Date range | Fields | Search strategy |
|---|---|---|---|
| PubMed | 01.2014–09.2025 | Title, abstract, MeSH Terms | ((“kinesio tap*”[Title/Abstract] OR “kinesiotap*”[Title/ Abstract] OR “elastic tap*”[Title/Abstract] OR “orthotic tap*”[Title/Abstract] OR “athletic tape”[MeSH Terms]) AND (“chronic ankle instability”[Title/Abstract] OR “functional ankle instability”[Title/Abstract])) AND ((English [Filter]) AND (2014:2025[pdat])) |
| Web of Science | 01.2014–09.2025 | Topic | TS= ((“kinesio tap*” OR “kinesiotap*” OR “elastic tap*” OR “athletic tap*” OR “orthotic tap*”) AND (“chronic ankle instability” OR “functional ankle instability”)) |
| Scopus | 01.2014–09.2025 | Article title, abstract, keywords | TITLE-ABS-KEY ((“kinesio tap*” OR “kinesiotap*” OR “elastic tap*” OR “orthotic tap*”) AND (“chronic ankle instability” OR “functional ankle instability”)) AND (PUBYEAR > 2014 AND PUBYEAR < 2025) AND (LIMIT-TO (LANGUAGE, “English”)) |
| PEDro | 01.2014–09.2025 | Abstract, title | “Chronic ankle instability” AND “kinesiotap*” |
| SPORTDiscus | 01.2014–09.2025 | ((“kinesio tap*” OR “kinesiotap*” OR “elastic tap*” OR “athletic tap*” OR “orthotic tap*”) AND (“chronic ankle instability” OR “functional ankle instability”)) |
Supplementary Table 2.
Characteristics of the included studies
| Design | Participant characteristics (N/gender/age) | Intervention and compari son | KT application methods | Outcome measures | Applying time | |
|---|---|---|---|---|---|---|
| Boonkerd et al. 202330 | Cross-over repeated measure | 28 men with CAI Age (years): 22.5 ± 3.8 | KT vs ST vs NT |
| Proprioception (JPS, TTDPM), Static balance (BESS score), Dynamic balance (SEBT | Immediately |
| Cheraghi et al. 202231 | Cross-over repeated Measure | 30 collegiate athletes with CAI (11f, 19m) Age (years): 23.91 ± 2.58 | KT vs NT |
| Ankle ROM, angular velocity; peak force, rate of force development, power; muscle activation during CMJ | 25 minutes after KT application |
| Cline et al. 201832 | Cross-over repeated measure | 24 individuals with CAI Age (years): 25.2 ± 3.34 | KT vs Non-elastic Tape vs NT |
| Dynamic balance (SEBT), static balance (COP, TTB), perceived stability (VAS) | Immediately |
| Fereydounnia et al. 201933,34 | Cross-over repeated measure | 15 male athletes with FAI Age (years): 23.07 ± 4.76 15 healthy athletes Age (years): 23.73 ± 4.95 | Distal KT vs NT |
| COP displacement of gait initiation profile | 30 minutes after KT application |
| Fereydounnia et al. 201933,34 | Cross-over repeated measure | 15 male athletes with FAI Age (years): 23.07 ± 4.76 15 healthy athletes Age (years): 23.73 ± 4.95 | Distal KT vs NT |
| Dynamic balance (SEBT), side hop test, figure-of-8 test | 30 minutes after KT application |
| Boonkerd et al. 202330 | Cross-over repeated measure | 28 men with CAI Age (years): 22.5 ± 3.8 | KT vs ST vs NT |
| Proprioception (JPS, TTDPM), Static balance (BESS score), Dynamic balance (SEBT | Immediately |
| Cheraghi et al. 202231 | Cross-over repeated Measure | 30 collegiate athletes with CAI (11f, 19m) Age (years): 23.91 ± 2.58 | KT vs NT |
| Ankle ROM, angular velocity; peak force, rate of force development, power; muscle activation during CMJ | 25 minutes after KT application |
| Cline et al. 201832 | Cross-over repeated measure | 24 individuals with CAI Age (years): 25.2 ± 3.34 | KT vs Non-elastic Tape vs NT |
| Dynamic balance (SEBT), static balance (COP, TTB), perceived stability (VAS) | Immediately |
| Fereydounnia et al. 201933,34 | Cross-over repeated measure | 15 male athletes with FAI Age (years): 23.07 ± 4.76 15 healthy athletes Age (years): 23.73 ± 4.95 | Distal KT vs NT |
| COP displacement of gait initiation profile | 30 minutes after KT application |
| Fereydounnia et al. 201933,34 | Cross-over repeated measure | 15 male athletes with FAI Age (years): 23.07 ± 4.76 15 healthy athletes Age (years): 23.73 ± 4.95 | Distal KT vs NT |
| Dynamic balance (SEBT), side hop test, figure-of-8 test | 30 minutes after KT application |
| Boonkerd et al. 202330 | Cross-over repeated measure | 28 men with CAI Age (years): 22.5 ± 3.8 | KT vs ST vs NT |
| Proprioception (JPS, TTDPM), Static balance (BESS score), Dynamic balance (SEBT) | Immediately |
| Cheraghi et al. 202231 | Cross-over repeated Measure | 30 collegiate athletes with CAI (11f, 19m) Age (years): 23.91 ± 2.58 | KT vs NT |
| Ankle ROM, angular velocity; peak force, rate of force development, power; muscle activation during CMJ | 25 minutes after KT application |
| Cline et al. 201832 | Cross-over repeated measure | 24 individuals with CAI Age (years): 21.25 ± 3.34 | KT vs Non-elastic Tape vs NT |
| Dynamic balance (SEBT), static balance (COP, TTB), perceived stability (VAS) | Immediately |
| Fereydounnia et al. 201933,34 | Cross-over repeated measure | 15 male athletes with FAI Age (years): 23.07 ± 4.76 15 healthy athletes Age (years): 23.73 ± 4.95 | Distal KT vs NT |
| COP displacement of gait initiation profile | 30 minutes after KT application |
| Fereydounnia et al. 201933,34 | Cross-over repeated measure | 15 male athletes with FAI Age (years): 23.07 ± 4.76 15 healthy athletes Age (years): 23.73 ± 4.95 | Distal KT vs NT |
| Dynamic balance (SEBT), side hop test, figure-of-8 test | 30 minutes after KT application |
| Fereydounnia et al. 202135 | Cross-over repeated measure | 15 male athletes with FAI Age (years): 23.07 ± 4.76 15 healthy athletes Age(years): 23.73 ± 4.95 | Distal KT vs NT |
| RP, APAP, velocity of COP displacement of gait initiation profile | 30 minutes after KT application |
| Gehrke et al. 201836 | Cross-over repeated measure | 21 basketball athletes with CAI (7f, 14m) Age (years): 23.7 ± 3.2 | KT vs RT vs NT |
| Dynamic balance (SEBT), figure-of-8 test, comfort | Immediately |
| Lim et al. 202137 | Cross-over repeated measure | 15 participants with CAI (6f, 9m) Age (years): 23.5 ± 1.7 | KT vs DT vs NT |
| Dynamic balance (modified SEBT), static balance (COP parameters of the OLST) | Immediately |
| Li et al. 202238 | Cross-over repeated measure | 28 participants with FAI (13f/15m) Age (years): 21.2 ± 2.0 | FKT vs ABT vs ST vs NT |
| Muscle strength (MVIC), proprioception (JPS, FS), dynamic balance (YBT scores), static balance (COP parameters of the unilateral stance) | Immediately |
| Safari et al. 202339 | RCT | KT: 13 female volleyball players Age (years): 25.08 ± 3.23 PT: 13 female volleyball players Age (years): 24.15 ± 1.72 | KT vs ST |
| Side hop test, single hop distance test, dynamic balance (YBT scores) | 20 minutes after KT application/24 hours after KT application |
| Shadegani et al. 202340 | Cross-over Repeated Measure | 16 individuals with CAI (11f, 5m) Age (years): 29.37 ± 6.08 | KT vs MT vs NT |
| Muscle Activation (The onset time and magnitude of SLR and MLR for PB, PL, TA, SOL muscles, the TA/P and SOL/TA antagonist co-activation) | 24 hours after KT application |
| Wang et al. 202341 | Cross-over Repeated Measure | 16 individuals without CAI (6f, 10m) Age (years): 23.880 ± 2.306 16 individuals with CAI (8f, 8m) Age (years): 23.060 ± 3.043 | KT vs NT |
| Dynamic balance (YBT scores) | Immediately |
| Wang et al. 202446 | Cross-over repeated measure | 21 participants with CAI (11f, 10m) Age (years): 22.0 ± 2.9 | KT vs ST vs NT |
| Ankle plantarflexion/inversion/eversion angle, time to peak vGRF, peak ankle dorsiflexion/eversion angle, peak ankle dorsiflexion/eversion angular velocity, peak vGRF, peak ankle dorsiflexion/eversion moment | Immediately |
| Yen et al. 201842 | RCT | KT:8f, 2m Age (years):22.8 ± 1.3 AT:7f, 3m Age (years):23 ± 2.3 | KT vs AT |
| Foot position, tibial position of walking | Immediately |
| Yin et al. 202043 | Cross-over repeated measure | 35 male participants with CAI Age (years): 22.97 ± 2.81 | KT vs AT vs ST vs NT |
| Postural stability (SOT, US, LOS, MCT, ADT), perceived stability (VAS) | Immediately |
| Yin et al. 202144 | Cross-over repeated measure | 35 male participants with CAI Age (years): 22.97 ± 2.81 | KT vs AT vs ST vs NT |
| Muscle activation, proprioception (TTDPM) | Immediately |
| Yu et al. 202145 | Cross-over repeated measure | 15 individuals without CAI (7f, 8m) Age (years):23.1 ± 2.0 15 individuals with CAI (8f, 7m) Age (years):23.9 ± 2.6 | KT (short/ mid/long) vs NT |
| Proprioception (AIDAL) | Immediately |
[i] ABT - ankle balance taping, AIDAL - ankle inversion discrimination apparatus for landing, ADT - adaptation test, APAP - anticipatory postural adjustment phase, AT - athletic tape, BESS - balance error scoring system, CAI - chronic ankle instability, CMJ - countermovement jump, COP - centre of pressure, DT - dynamic tape, FAI - functional ankle instability, FKT - facilitatory kinesio taping, FS - force sense, GL - gastrocnemius lateralis, GM - gastrocnemius medialis, JPS - joint position sense, KT - kinesiotape, LOS - limit of stability, MCT - motor control test, MLR - medium latency response, MT - mulligan tape, MVIC - maximum voluntary isometric contraction, NT - no-tape, OLST - one-leg standing test, PB - peroneus brevis, RCT - randomised controlled trial, ROM - range of motion, RP - reaction phase, SEBT - star excursion balance test, SLR - short latency response, SOL - soleus, SOT - sensory organisation test, ST - sham tape, TA - tibialis anterior, TP - tibialis posterior, TTB - time-to-boundary, TTDPM - threshold for detecting passive motion, US - unilateral stance, VAS - visual analogue scale, vGRF - vertical ground reaction force, vs - versus, YBT - Y balance test.
Supplementary Table 3.
Summary of non-pooled findings for dynamic balance
| Variable | Study | Intervention and comparison | Outcome measures(units) | Additional information | Timing | Significant effect |
|---|---|---|---|---|---|---|
| Dynamic balance | Yin et al. 202043 | KT vs NT vs ST vs AT | LOS DCL (%) | Ant | Immediately | p = 0.956 |
| KT vs NT vs ST vs AT | LOS DCL (%) | AR | Immediately | p = 0.724 | ||
| KT vs NT vs ST vs AT | LOS DCL (%) | R | Immediately | p = 0.533 | ||
| KT vs NT vs ST vs AT | LOS DCL (%) | PR | Immediately | p = 0.518 | ||
| KT vs NT vs ST vs AT | LOS DCL (%) | P | Immediately | p = 0.836 | ||
| KT vs NT vs ST vs AT | LOS DCL (%) | PL | Immediately | p = 0.842 | ||
| KT vs NT vs ST vs AT | LOS DCL (%) | L | Immediately | p = 0.619 | ||
| KT vs NT vs ST vs AT | LOS DCL (%) | AL | immediately | p = 0.201 | ||
| KT vs NT | Amplitude scaling scores | MCT (forward-small slip) | Immediately | p < 0.001 | ||
| KT vs NT | Amplitude scaling scores | MCT (forward-medium slip) | Immediately | ns | ||
| KT vs NT | Amplitude scaling scores | MCT (forward-large slip) | Immediately | ns | ||
| KT vs NT | Amplitude scaling scores | MCT (backward-small slip) | Immediately | ns | ||
| KT vs NT | Amplitude scaling scores | MCT (backward-medium slip) | Immediately | ns | ||
| KT vs NT | Amplitude scaling scores | MCT (backward-large slip) | Immediately | ns | ||
| KT vs NT | Sway energy | ADT (Toes up) | Immediately | ns | ||
| KT vs NT | Sway energy | ADT (Toes down) | Immediately | ns | ||
| KT vs AT | Amplitude scaling scores | MCT (forward-small slip) | Immediately | ns | ||
| KT vs AT | Amplitude scaling scores | MCT (forward-medium slip) | Immediately | ns | ||
| KT vs AT | Amplitude scaling scores | MCT (forward-large slip) | Immediately | ns | ||
| KT vs AT | Amplitude scaling scores | MCT (backward-small slip) | Immediately | ns | ||
| KT vs AT | Amplitude scaling scores | MCT (backward-medium slip) | Immediately | ns | ||
| KT vs AT | Amplitude scaling scores | MCT (backward-large slip) | Immediately | ns | ||
| KT vs AT | Sway energy | ADT (Toes up) | Immediately | ns | ||
| KT vs AT | Sway energy | ADT (Toes down) | Immediately | ns | ||
| KT vs ST | Amplitude scaling scores | MCT (forward-small slip) | Immediately | ns | ||
| KT vs ST | Amplitude scaling scores | MCT (forward-medium slip) | Immediately | ns | ||
| KT vs ST | Amplitude scaling scores | MCT (forward-large slip) | Immediately | ns | ||
| KT vs ST | Amplitude scaling scores | MCT (backward-small slip) | Immediately | ns | ||
| KT vs ST | Amplitude scaling scores | MCT (backward-medium slip) | Immediately | ns | ||
| KT vs ST | Amplitude scaling scores | MCT (backward-large slip) | Immediately | p = 0.035 | ||
| KT vs ST | Sway energy | ADT (Toes up) | Immediately | ns | ||
| KT vs ST | Sway energy | ADT (Toes down) | Immediately | ns |
Supplementary Table 4.
Summary of non-pooled findings for static balance
| Variable | Study | Intervention and comparison | Outcome measures(units) | Additional information | Timing | Significant effect |
|---|---|---|---|---|---|---|
| Static balance | Boonkerd et al. 202330 | KT vs placebo tape | BESS scores | Immediately | p = 0.134 | |
| KT vs NT | BESS scores | Immediately | p = 0.032 | |||
| Yin et al. 202043 | KT vs NT | SOT ES | Condition1-6 | Immediately | ns | |
| KT vs AT | SOT ES | Condition1-6 | Immediately | ns | ||
| KT vs ST | SOT ES | Condition1-6 | Immediately | ns | ||
| KT vs NT | SOT COMP | Condition1-6 | Immediately | ns | ||
| KT vs AT | SOT COMP | Condition1-6 | Immediately | ns | ||
| KT vs ST | SOT COMP | Condition1-6 | Immediately | ns | ||
| KT vs NT | Sway velocity of COG (⌧/s) | US-EO | Immediately | ns | ||
| KT vs AT | Sway velocity of COG (⌧/s) | US-EO | Immediately | ns | ||
| KT vs ST | Sway velocity of COG (⌧/s) | US-EO | Immediately | ns | ||
| KT vs NT | Sway velocity of COG (⌧/s) | US-EC | Immediately | ns | ||
| KT vs AT | Sway velocity of COG (⌧/s) | US-EC | Immediately | ns | ||
| KT vs ST | Sway velocity of COG (⌧/s) | US-EC | Immediately | ns |
Supplementary Table 5.
Summary of non-pooled findings for proprioception
| Variable | Study | Intervention and comparison | Outcome measures(units) | Additional information | Timing | Significant effect |
|---|---|---|---|---|---|---|
| Proprioception | Yin et al. 202144 | KT vs AT vs ST vs NT | TTDPM (°) | Inversion | Immediately | ns |
| KT vs AT vs ST vs NT | TTDPM (°) | Eversion | Immediately | ns | ||
| KT vs AT vs ST vs NT | TTDPM (°) | Plantar flexion | Immediately | ns | ||
| KT vs AT vs ST vs NT | TTDPM (°) | Dorsiflexion | Immediately | ns | ||
| Li et al. 202238 | ABT/FKT vs ST vs NT | PF-AEJPS (°) | Immediately | ns | ||
| ABT/FKT vs ST vs NT | DF-AEJPS (°) | Immediately | ns | |||
| ABT/FKT vs ST vs NT | PF-VEJPS (°) | Immediately | ns | |||
| ABT/FKT vs ST vs NT | DF-VEJPS (°) | Immediately | ns | |||
| ABT/FKT vs ST vs NT | PF-RAEFS(°/N) | Immediately | ns | |||
| ABT/FKT vs ST vs NT | DF-RAEFS (°/N) | Immediately | ns | |||
| ABT/FKT vs ST vs NT | PF-RVEFS (°/N) | Immediately | ns | |||
| ABT/FKT vs ST vs NT | DF-RVEFS (°/N) | Immediately | ns | |||
| ABT/FKT vs sham tape vs NT | DF-RVEFS (°/N) | Immediately | ns |
1 ABT - ankle balance taping, AEJPS - absolute error of joint position sense, AT - athletic tape, DF - dorsiflexion, FKT - facilitatory kinesio taping, KT - kinesiotape, NS - no significance, NT - no-tape, PF - plantarflexion, RAEFS - relative absolute error of force sense, RVEFS - relative variable error of force sense, ST - sham tape, TTDPM - threshold for detecting passive motion, VEJPS - variable error of joint position sense, vs - versus.
Supplementary Table 6.
Summary of non-pooled findings for muscle activation
| Variable | Study | Intervention and comparison | Outcome measures(units) | Additional information | Timing | Significant effect |
|---|---|---|---|---|---|---|
| Muscle activation | Cheraghi et al. 2022 | KT vs NT | LG muscle activity(%peak) | Propulsion phase of CMJ | Immediately | p = 0.028 |
| KT vs NT | MG muscle activity(%peak) | Propulsion phase of CMJ | Immediately | p = 0.015 | ||
| KT vs NT | TA muscle activity(%peak) | Propulsion phase of CMJ | Immediately | p = 0.781 | ||
| KT vs NT | PL muscle activity(%peak) | Propulsion phase of CMJ | Immediately | p = 0.045 | ||
| Shadegani et al. 202340 | KT vs NT | Onset time pf MLR (ms) | Immediately | p < 0.013 | ||
| KT vs NT | Magnitude of SLR | Immediately | p < 0.001 | |||
| KT vs NT | Magnitude of MLR | Immediately | p < 0.018 | |||
| KT vs MT | Magnitude of SLR | Immediately | p < 0.005 | |||
| KT vs MT | Magnitude of MLR | Immediately | p < 0.013 | |||
| Yin et al. 202144 | KT vs AT | LG RMS values(%MVIC) | Condition 4 during SOT | Immediately | p = 0.038 | |
| KT vs ST | PL RMS values(%MVIC) | Forward-small translation during MCT | Immediately | p = 0.046 |
[i] AT - athletic tape, CMJ - countermovement jump, KT - kinesiotape, LG - lateral gastrocnemius, MCT - motor control test, MLR - medium latency response, MG - medial gastrocnemius, MT - mulligan tape, MVIC - maximum voluntary isometric contraction, RMS - root mean square, SLR - short latency response, SOT - sensory organization test, ST - sham tape, TA - tibialis anterior, vs - versus.
Supplementary Table 7.
Summary of non-pooled findings for muscle strength
| Variable | Study | Intervention and comparison | Outcome measures(units) | Additional information | Timing | Significant effect |
|---|---|---|---|---|---|---|
| Muscle strength | Fereydounnia et al. 2019 [33, 34] | KT vs NT | Ankle evertors (N) | Immediately | p = 0.000 |
Supplementary Table 8.
Summary of non-pooled findings for sports performance
| Variable | Study | Intervention and comparison | Outcome measures(units) | Additional information | Timing | Significant effect |
|---|---|---|---|---|---|---|
| Sports performance | Cheraghi et al. 202231 | KT vs NT | Jump height(cm) | Propulsion phase of CMJ | Immediately | p = 0.001 |
| KT vs NT | Inversion/eversion ROM (°) | Propulsion phase of CMJ | Immediately | p = 0.002 | ||
| KT vs NT | Dorsi-plantar flexion ROM (°) | Propulsion phase of CMJ | Immediately | p = 0.006 | ||
| KT vs NT | Plantar flexion angular velocity (°/s) | Propulsion phase of CMJ | Immediately | p = 0.009 | ||
| KT vs NT | Average peak force(N) | Propulsion phase of CMJ | Immediately | p < 0.001 | ||
| KT vs NT | RFD (N/s) | Propulsion phase of CMJ | Immediately | p < 0.001 | ||
| KT vs NT | Peak power(W) | Propulsion phase of CMJ | Immediately | p < 0.001 | ||
| KT vs NT | Joint power☒%☒total | Propulsion phase of CMJ | Immediately | p = 0.021 | ||
| Sports performance | Fereydounnia et al. 201933,34 | KT vs NT | Figure-of-8(s) | Immediately | ns | |
| Fereydounnia et al. 201933,34 | Distal KT vs NT | AP COP displacement(cm) | Anticipatory phase of GI | Immediately | ns | |
| Distal KT vs NT | ML COP displacement(cm) | Anticipatory phase of GI | Immediately | ns | ||
| Distal KT vs NT | Resultant COP displacement(cm) | Anticipatory phase of GI | Immediately | ns | ||
| Distal KT vs NT | AP COP displacement(cm) | Weight transfer phase of GI | Immediately | ns | ||
| Distal KT vs NT | ML COP displacement(cm) | Weight transfer phase of GI | Immediately | ns | ||
| Distal KT vs NT | Resultant COP displacement(cm) | Weight transfer phase of GI | Immediately | ns | ||
| Distal KT vs NT | AP COP displacement(cm) | Locomotive phase of GI | Immediately | ns | ||
| Distal KT vs NT | ML COP displacement(cm) | Locomotive phase of GI | Immediately | ns | ||
| Distal KT vs NT | Resultant COP displacement(cm) | Locomotive phase of GI | Immediately | ns | ||
| Fereydounnia et al. 202135 | Distal KT vs NT | RP (ms) | Immediately | ns | ||
| Distal KT vs NT | APAP (ms) | Immediately | ns | |||
| Distal KT vs NT | VELS1(cm/s) | S1: Anticipatory phase of GI | Immediately | ns | ||
| Distal KT vs NT | VELS2(cm/s) | S2: Weight transfer phase of GI | Immediately | ns | ||
| Distal KT vs NT | VELS3(cm/s) | S3: Locomotive phase of GI | Immediately | ns | ||
| Gehrke et al. 201836 | KT vs NT | Figure-of-8(s) | Immediately | p = 0.049 | ||
| Safari et al. 202337 | KT vs ST | Single hop test (cm) | 20 minutes | p = 0.0003 | ||
| KT vs ST | Single hop test (cm) | 24 hours | p = 0.0002 | |||
| KT vs ST | Side hop test (s) | 20 minutes | p < 0.0001 | |||
| Wang et al. 202445 | KT vs NT | Ankle plantarflexion angles (°) | Initial contact in LSJ movements | Immediately | p = 0.001 | |
| KT vs NT | Ankle plantarflexion angles (°) | Initial contact in RSJ movements | Immediately | p = 0.048 | ||
| KT vs NT | Peak ankle dorsiflexion angle (°) | Early landing phase in LSJ movements | Immediately | p = 0.012 | ||
| KT vs NT | Peak ankle dorsiflexion angle (°) | Early landing phase in RSJ movements | Immediately | p < 0.001 | ||
| KT vs NT | Peak ankle eversion angle (°) | Early landing phase in LSJ movements | Immediately | p = 0.043 | ||
| KT vs NT | Peak ankle eversion angle (°) | Early landing phase in RSJ movements | Immediately | p = 0.042 | ||
| KT vs NT | Time to peak vGRF (ms) | Early landing phase in LSJ movements | Immediately | p = 0.035 | ||
| KT vs NT | Time to peak vGRF (ms) | Early landing phase in RSJ movements | Immediately | p = 0.024 | ||
| KT vs NT | Peak vGRF (BW) | Early landing phase in LSJ movements | Immediately | p = 0.023 | ||
| KT vs NT | Peak vGRF (BW) | Early landing phase in RSJ movements | Immediately | p = 0.009 | ||
| KT vs NT | Peak ankle dorsiflexion moment (Nm/kg) | Early landing phase in LSJ movements | Immediately | p = 0.003 | ||
| KT vs NT | Peak ankle eversion moment (Nm/kg) | Early landing phase in LSJ movements | Immediately | P = 0.003 | ||
| KT vs NT | Peak ankle eversion moment (Nm/kg) | Early landing phase in RSJ movements | Immediately | p < 0.0001 | ||
| KT vs ST | Peak ankle dorsiflexion angle (°) | Early landing phase in LSJ movements | Immediately | p = 0.015 | ||
| KT vs ST | Peak ankle dorsiflexion angle (°) | Early landing phase in RSJ movements | Immediately | p = 0.001 | ||
| KT vs ST | Peak ankle eversion angle (°) | Early landing phase in LSJ movements | Immediately | p = 0.004 | ||
| KT vs ST | Peak ankle eversion angle (°) | Early landing phase in RSJ movements | Immediately | p = 0.037 | ||
| KT vs ST | Time to peak vGRF (ms) | Early landing phase in LSJ movements | Immediately | p = 0/022 | ||
| KT vs ST | Time to peak vGRF (ms) | Early landing phase in RSJ movements | Immediately | p = 0.031 | ||
| KT vs ST | Peak vGRF (BW) | Early landing phase in LSJ movements | Immediately | p = 0.026 | ||
| KT vs ST | Peak vGRF (BW) | Early landing phase in RSJ movements | Immediately | p = 0.023 | ||
| KT vs ST | Peak ankle eversion moment (Nm/kg) | Early landing phase in LSJ movements | Immediately | p = 0.002 | ||
| KT vs ST | Peak ankle eversion moment (Nm/kg) | Early landing phase in RSJ movements | Immediately | p < 0.001 | ||
| Yen et al. 201842 | KT vs NT | Foot position: frontal plane (°) | Stance phase of walking zone1 | Immediately | p = 0.03 | |
| KT vs AT | Foot position change: frontal plane (°) | Stance phase of walking zone7 | Immediately | P = 0.049 | ||
| KT vs AT | Tibial position change: transverse plane (°) | Stance phase of walking zone7 | Immediately | p = 0.03 | ||
| KT vs AT | Tibial position change: transverse plane (°) | Stance phase of walking zone8 | Immediately | p = 0.03 | ||
| KT vs AT | Tibial position change: transverse plane (°) | Stance phase of walking zone9 | Immediately | p = 0.04 |
[i] ADT - adaptation test, AEJPS - absolute error of joint position sense, AP - anterior-posterior, APAP - anticipatory postural adjustment phase, BBS - biodex balance system, BESS - balance error scoring system, CMJ - countermovement jump, COG - center of gravity, COMP - composite scores, DCL - directional control, DF - dorsiflexion, EC - eyes closed, EO - eyes open, ES - equilibrium scores, GI - gait initiation, L - left, LG - lateral gastrocnemius, LOS - limit of stability, LSJ - left-sided jumping, MCT - motor control test, MG - medial gastrocnemius, ML - medial-lateral, MLR - medium latency response, ns - no significance, P - posterior, PF - plantarflexion, PL - posterolateral, PM - posteromedial, R - right, RAEFS - relative absolute error of force sense, RFD - rate of force development, RMS - root mean square, RP - reaction phase, RSJ - right-sided jumping, RVEFS - relative variable error of force sense, S1 - Anticipatory Phase, SEBT - star excursion balance Test, SLR - short latency response, SOT - sensory organization test, TA - tibialis anterior, TTDPM - threshold for detecting passive motion, US - unilateral stance, VEL - velocity, VEJPS - variable error of joint position sense, vGRF - vertical ground reaction force, vs - versus.
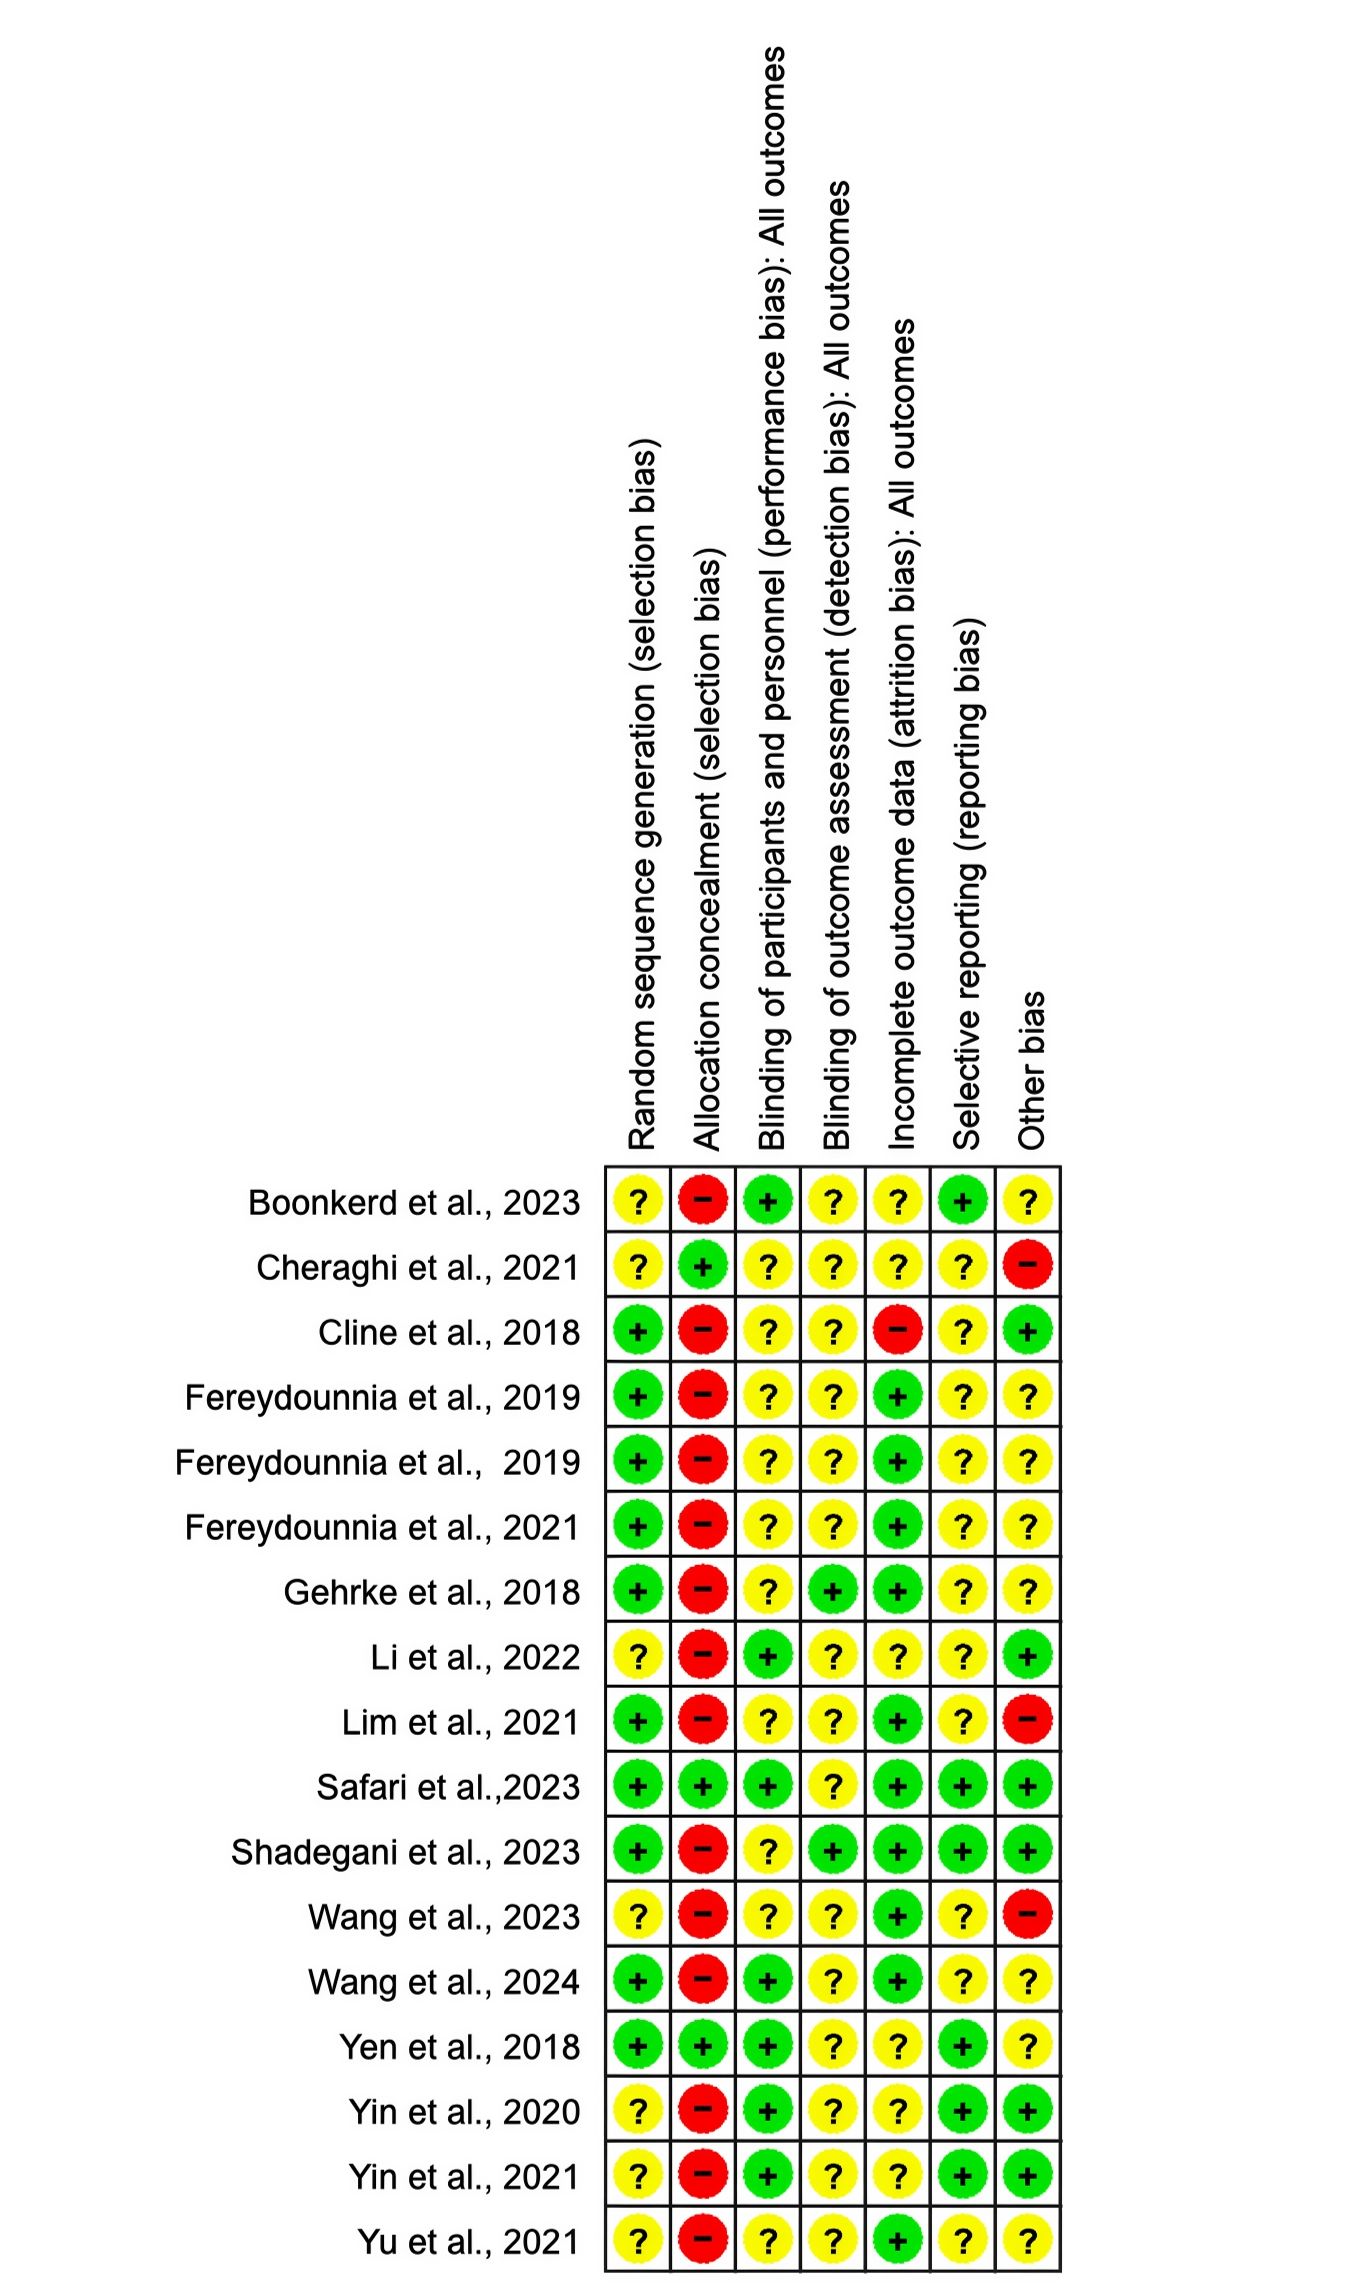
Supplementary Figure 1
Risk of bias summary for each included RCT study. RCT - randomized controlled trial
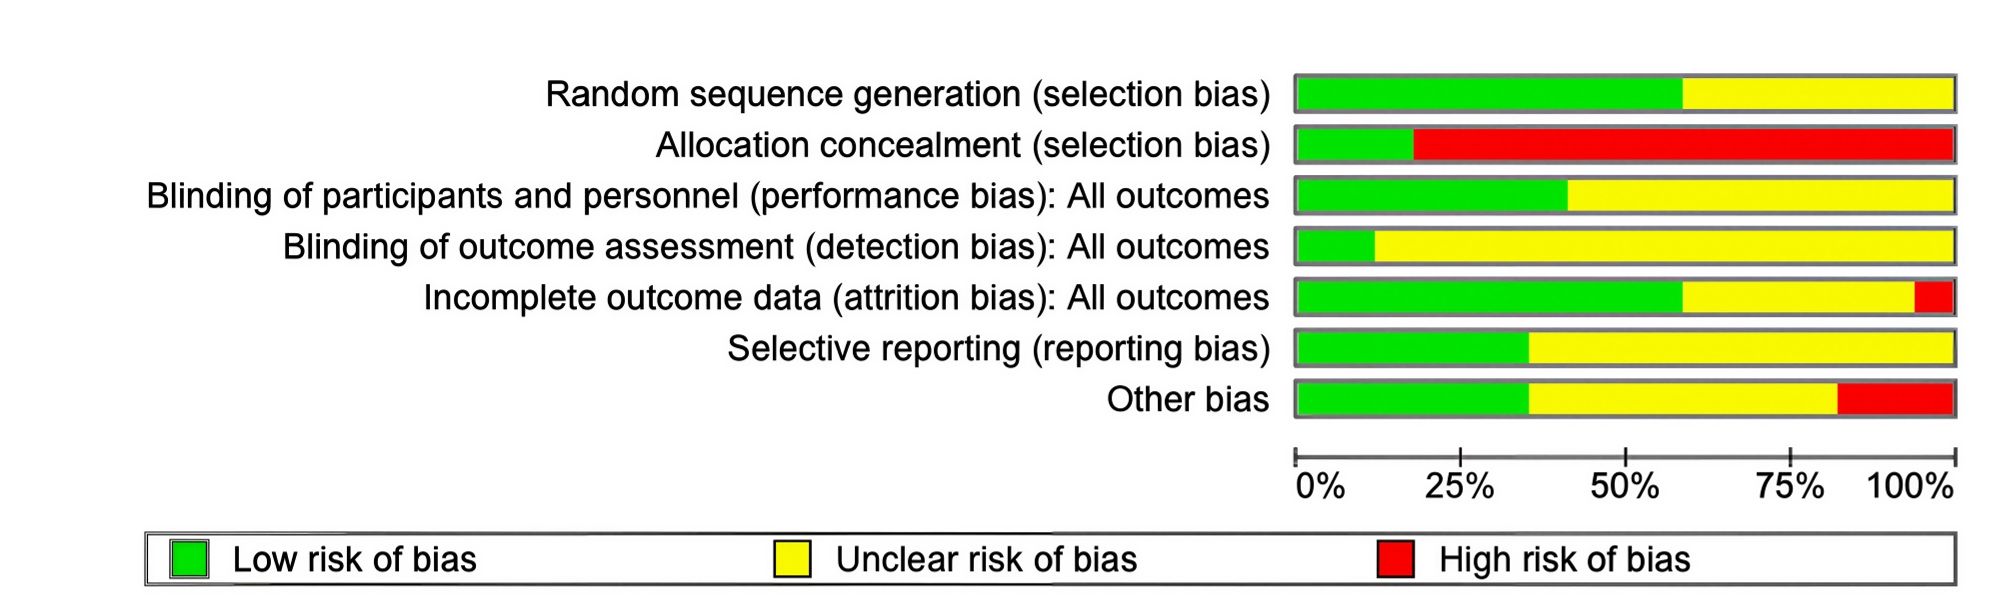
Supplementary Figure 2
Risk of bias graph for each included RCT study. RCT - randomized controlled trial
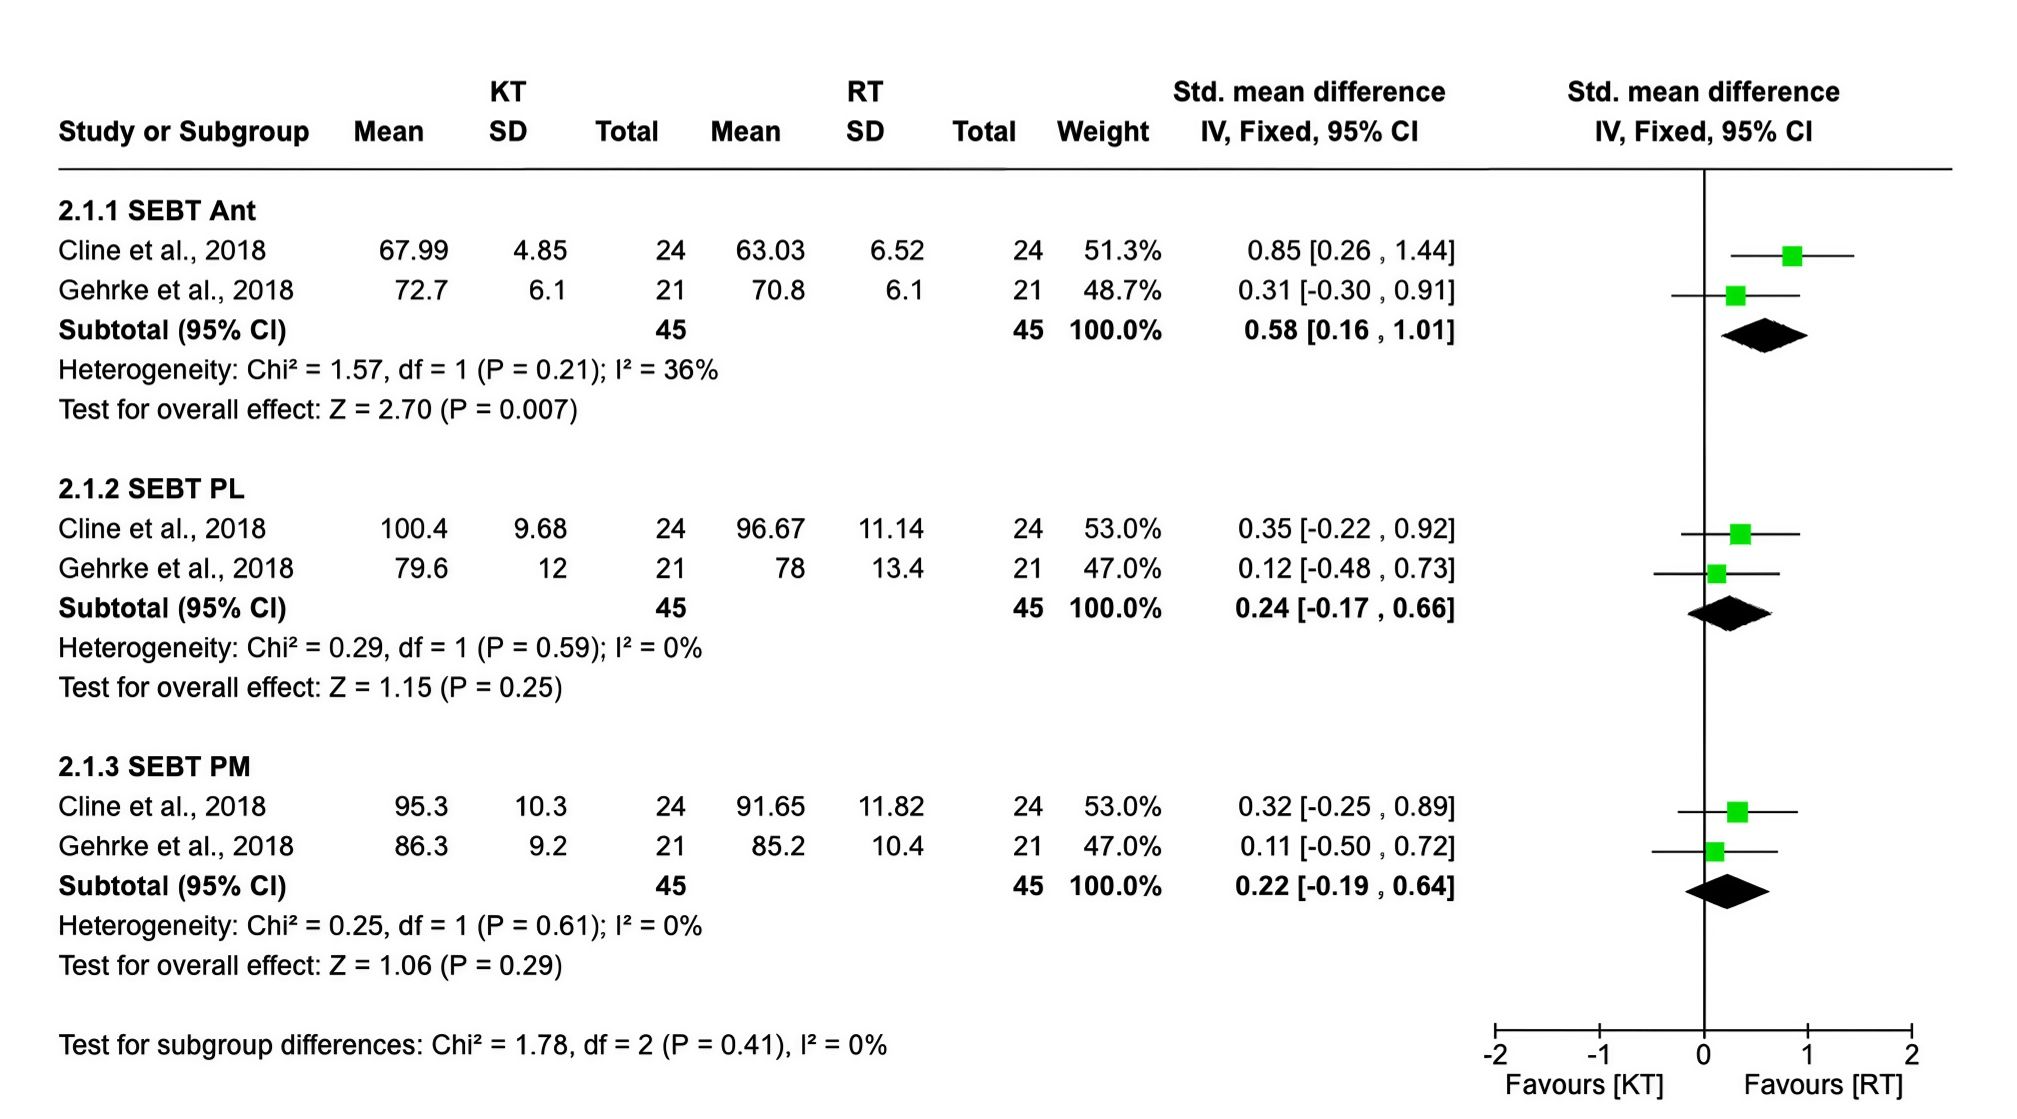
Supplementary Figure 3
Meta-analyses for the effect of KT on dynamic balance (SEBT) when KT is compared with RT. Ant - anterior, CI - confidence interval, KT - kinesiotape, PL - posterolateral, PM - posteromedial, RT - rigid tape, SD - standard deviation, SEBT - star excursion balance test
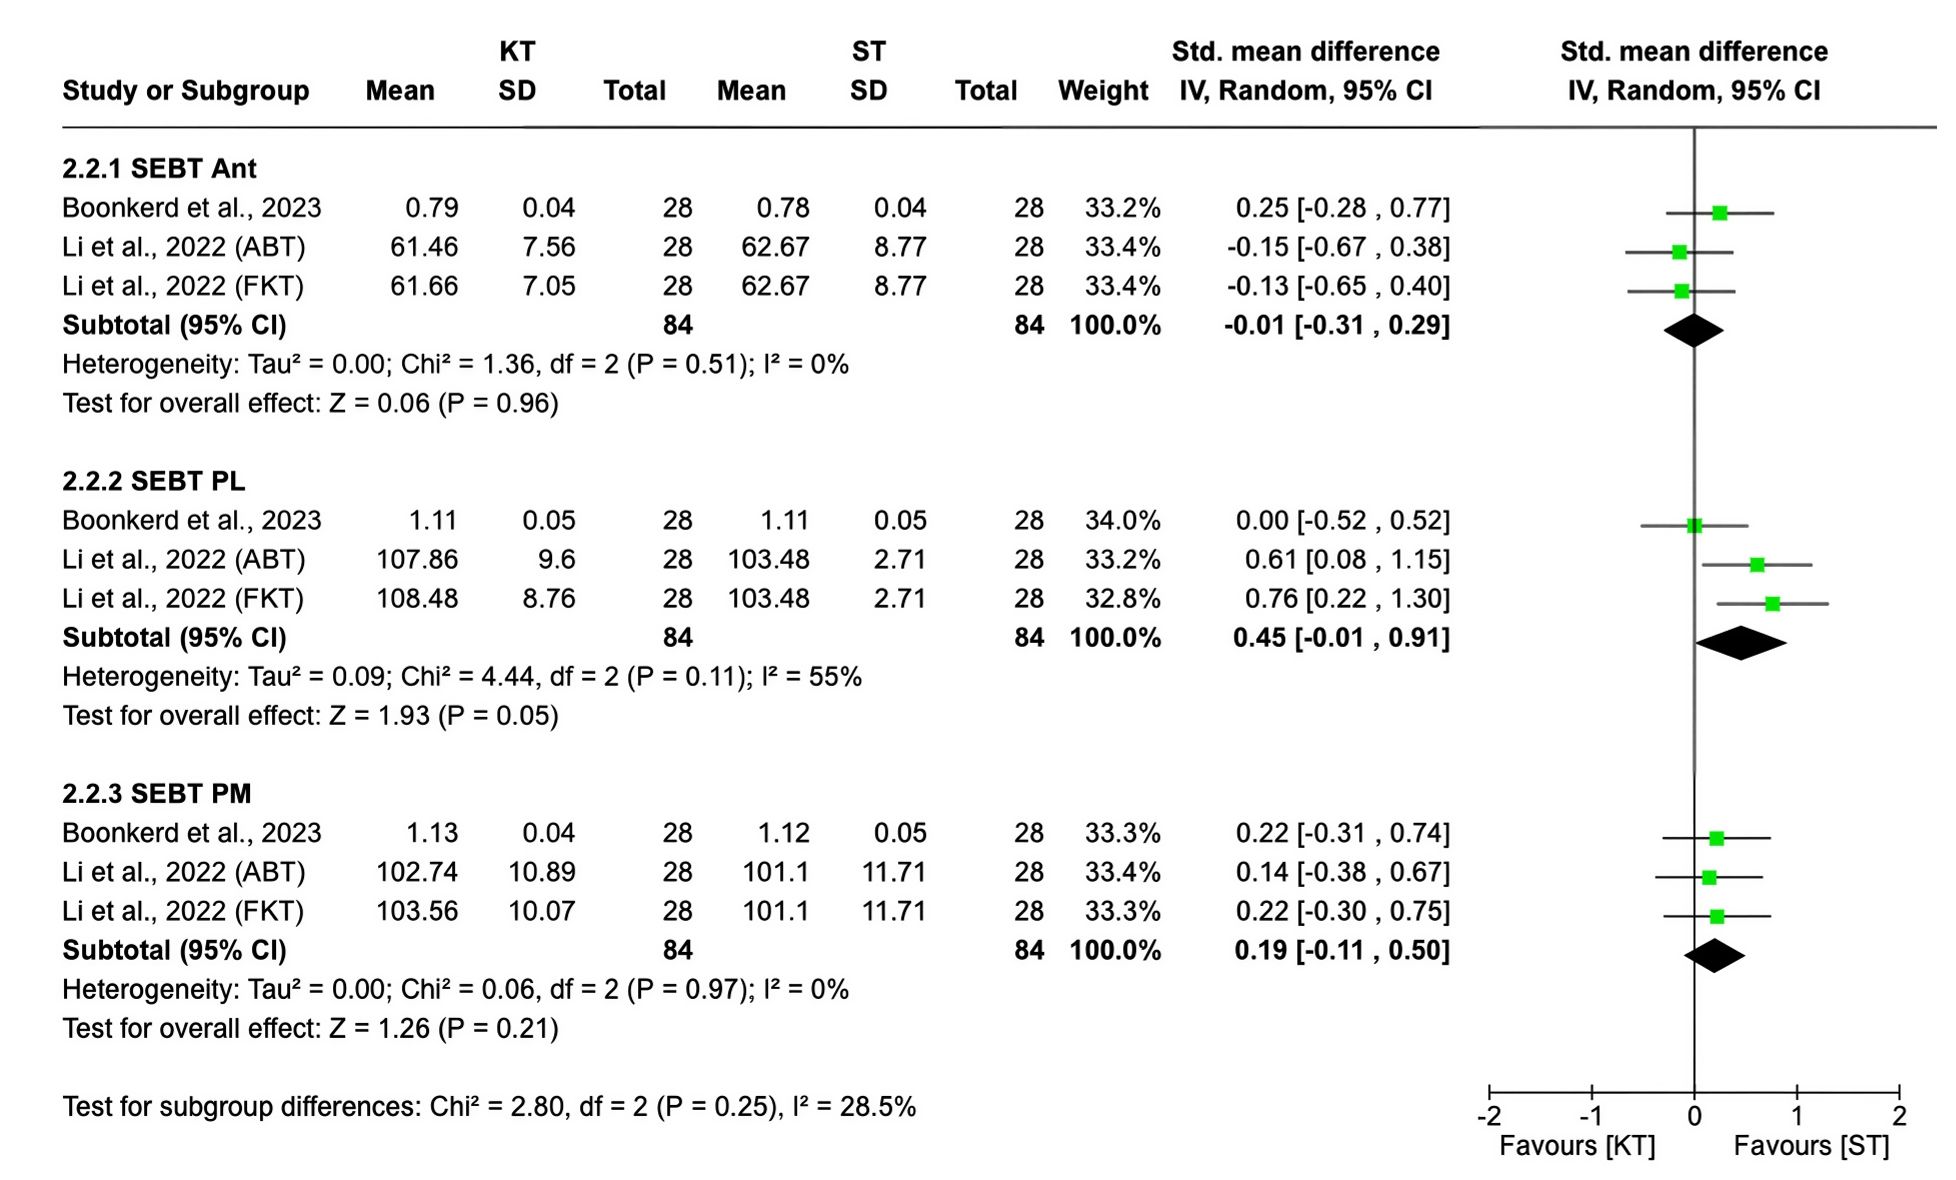
Supplementary Figure 4
Meta-analyses for the effect of KT on dynamic balance (SEBT) when KT is compared with ST. Ant - anterior; CI - confidence interval, KT - kinesiotape, PL - posterolateral, PM - posteromedial, SD - standard deviation, SEBT - star excursion balance test, ST - sham tape
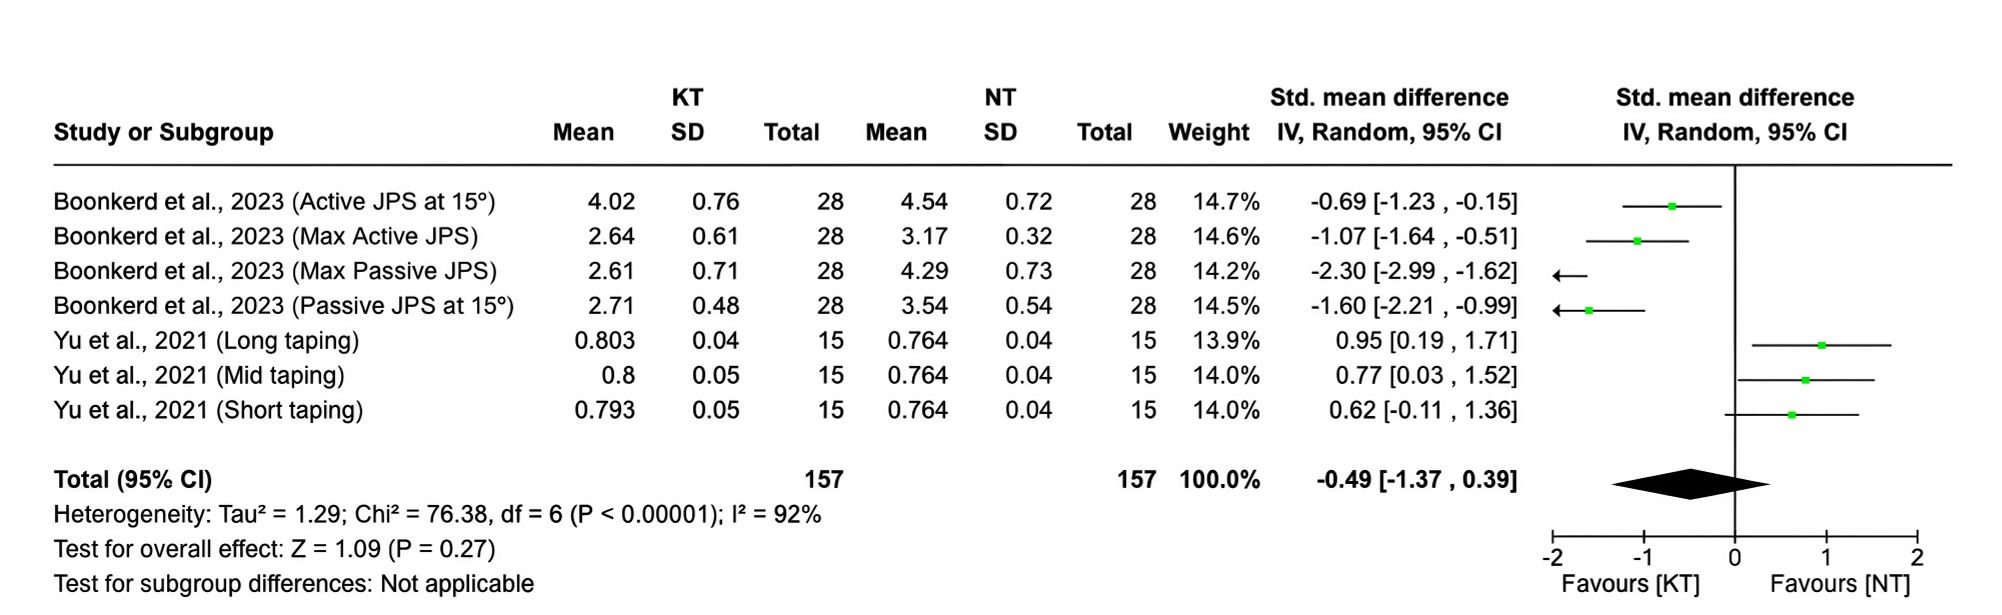
Supplementary Figure v5
Meta-analyses for the effect of KT on proprioception (inversion) when KT is compared with NT. CI - confidence interval, KT - kinesiotape, M - medial, NT - no-tape, SD - standard deviation