
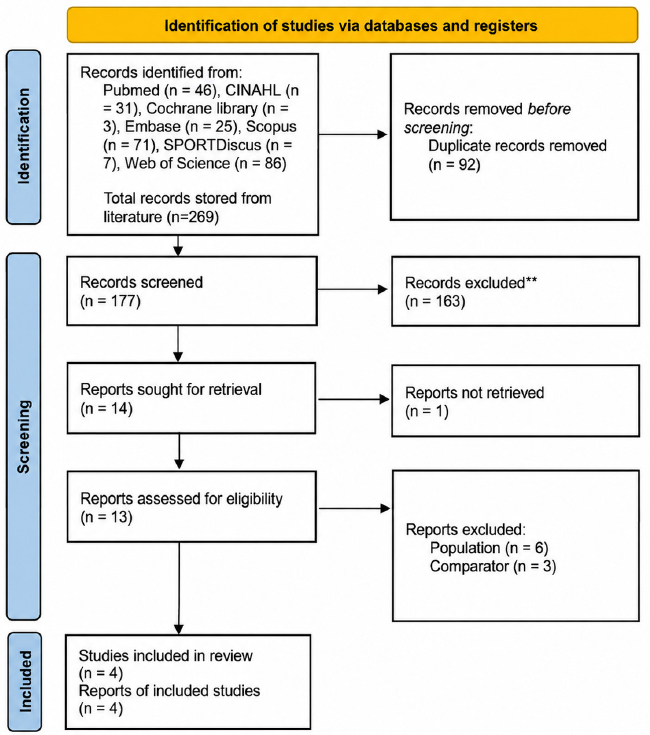
Figure 1.
PRISMA flow diagram. PRISMA, preferred reporting items for systematic reviews and meta-analysis
Table 1.
Characteristics of studies included in the systematic review and meta-analysis
| Study | Country | Study design | Sample size (ACL/Control) | Age(years) Mean ± SD | Sex (% Male) | Sport/activity | ISI measurement method | Measurement timing | ISI Mean ± SD (ACL/control) | Followup duration |
|---|---|---|---|---|---|---|---|---|---|---|
| Degnan et al.23 | USA | Case-control | 70 (34/36) | ACL: 12.4 ± 1.4 Control: 12.8 ± 2.1 | ACL: 73.5% Control: 80.6% | Youth athletes | Traditional ISI (MRI sagittal PD) | After ACL tear | ACL: 1.16 ± 0.16 Control: 0.99 ± 0.14 | N/A |
| Kwak et al. 24 | South Korea | Prospective cohort | 231 (116/115) | ACL: 14 ± 3.7 Control: 14.2 ± 3.6 | 100% | Soccer | Traditional ISI (MRI sagittal PD) | Before ACL tear | ACL: 0.90 ± 0.20 Control: 1.00 ± 0.20 | N/A |
| Güven et al.25 | Turkey | Prospective cohort | 210 (120/90) | ACL: 29.1. ± 8.2 Control: 31.8 ± 9.8 | 100% | Not specified | Traditional ISI (MRI sagittal PD) | Before ACL tear | ACL: 1.01 ± 0.15 Control: 0.96 ± 0.14 | 2014–2020 |
| Lin et al. 26 | China | Prospective | 380 (190/190) | ACL: 27.72 ± 7.55 Control: 30.30 ± 6.62 | ACL: 75.3% Control: 63.2% | Not specified | Modified ISI (MRI sagittal PD/T2) | Before ACL tear | ACL: 1.74 ± 0.23 Control: 1.64 ± 0.15 | 2019–2023 |
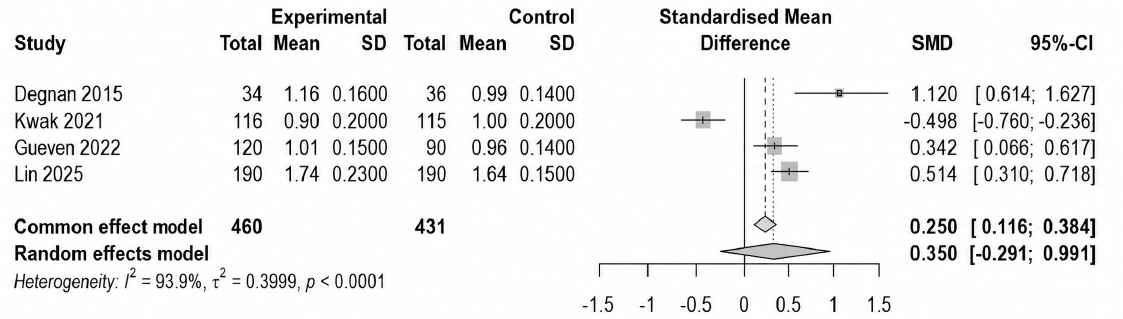
Figure 2.
Forest plot of the ISI in ACL - injured patients and controls. ACL - anterior cruciate ligament, CI - confidence intervals, ISI - Insall-Salvati index, PI - prediction interval, SD - standard deviation, SMD - standardised mean differences
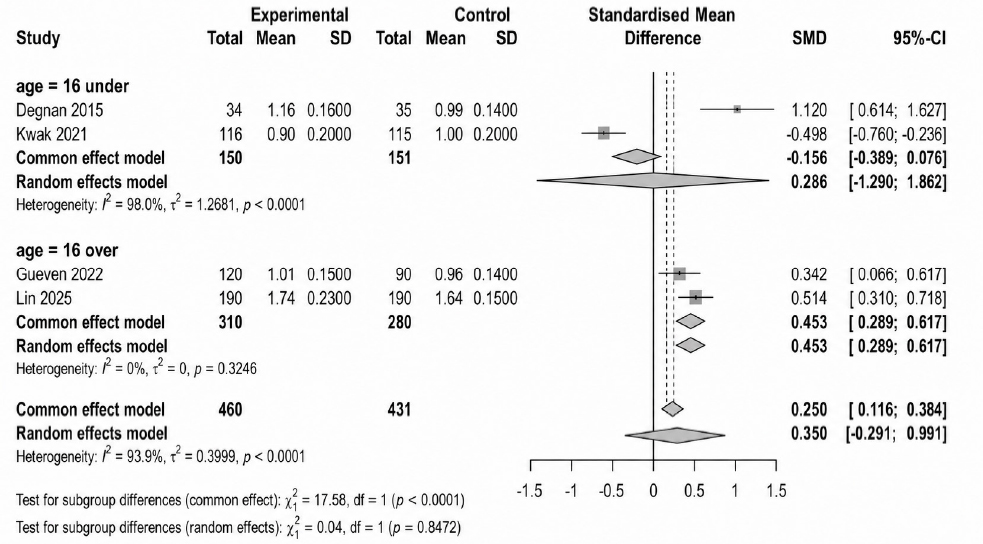
Figure 3.
Subgroup analysis by age group. CI - confidence intervals, SD - standard deviation, SMD - standardised mean differences
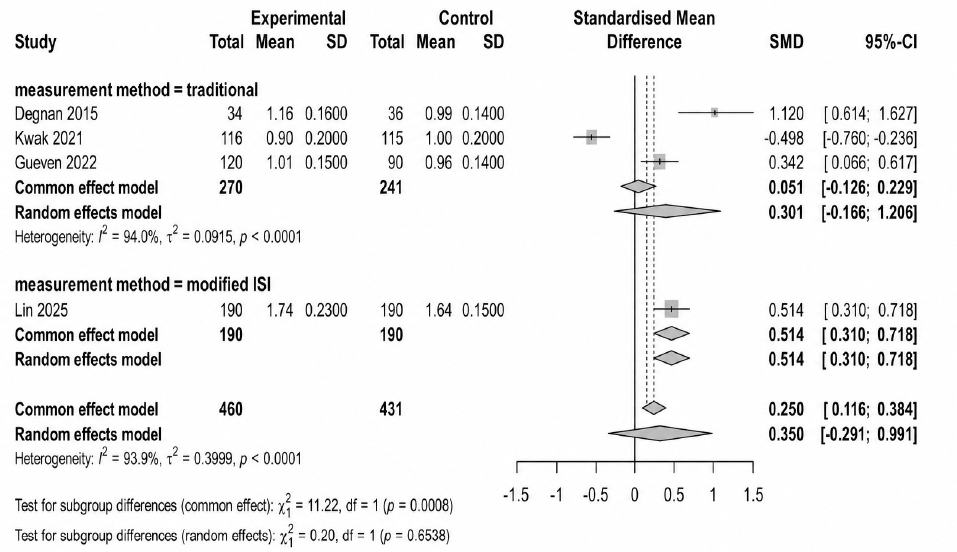
Figure 4.
Subgroup analysis by measurement method. CI - confidence intervals, SD - standard deviation, SMD - standardised mean differences
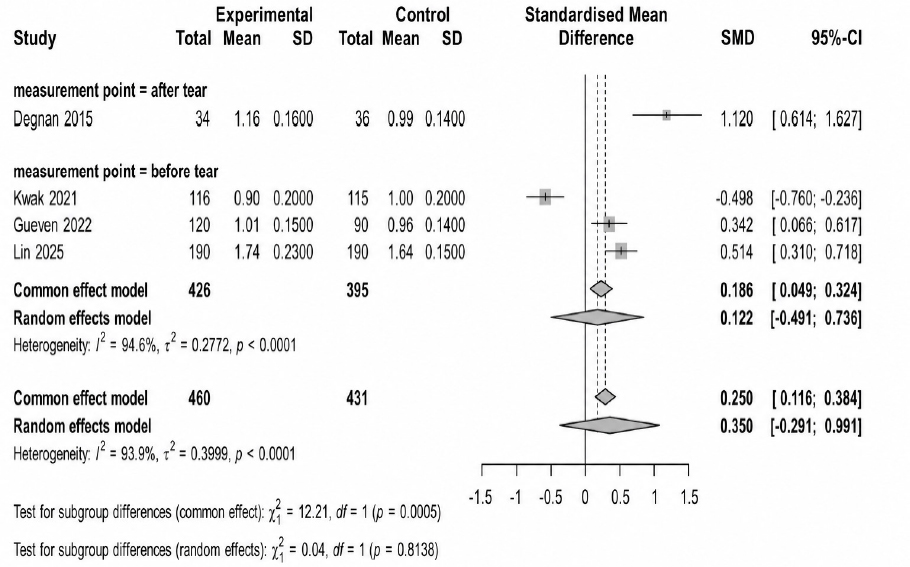
Figure 5.
Subgroup analysis by measurement timing. CI - confidence intervals, SD - standard deviation, SMD - standardised mean differences
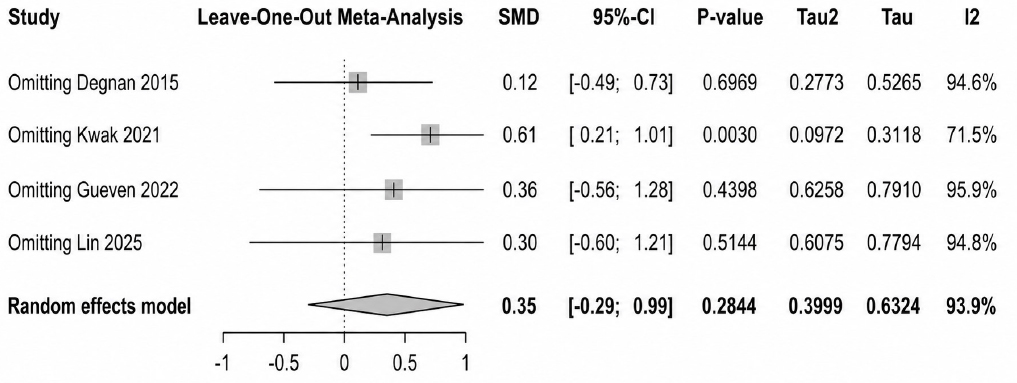
Figure 6.
Forest plot of the leave-one-out sensitivity analysis. CI - confidence intervals, SMD - standardised mean differences
Table 3.
GRADE Summary of findings for the association between patellar height (ISI) and ACL injury
| Certainty assessment | No of patients | Effect | Certainty | Importance | ||||||||
|---|---|---|---|---|---|---|---|---|---|---|---|---|
| No. of studies | Study design | Risk of bias | Inconsistency | Indirectness | Imprecision | Other considerations | ACL injury | Non--ACL injury | Relative (95% CI) | Absolute (95% CI) | ||
| Outcome 1: ISI difference (overall) (assessed with: [ISI]; Scale from: 0 to 3) | ||||||||||||
| 4 | Non-ran-domised studies | Not serious | Very seriousa | not serious | seriousb | none | 460 | 431 | - | SMD 0.35 SD higher (0.291 lower to 0.991 higher) | ⴲⵔⵔⵔ Very lowa,b | CRITICAL |
| Outcome 2: ISI difference (age > 16 years) (assessed with: [ISI]; Scale from: 0 to 3) | ||||||||||||
| 2 | Non-ran-domised studies | Not serious | Not serious | not serious | not serious | none | 310 | 280 | - | SMD 0.453 SD higher (0.289 higher to 0.617 higher) | ⴲⴲⵔⵔ Low | CRITICAL |
| Outcome 3: ISI difference (age ≤ 16 years) (assessed with: [ISI]; Scale from: 0 to 3) | ||||||||||||
| 2 | Non-ran-domised studies | Not serious | Very seriousc | not serious | very seriousd | none | 150 | 151 | - | 0.296 higher (1.29 higher to 1.882 higher) | ⴲⵔⵔⵔ Very lowc,d | IMPORTANT |
| Outcome 4: ISI difference (measurement timing – before tear) (assessed with: [ISI] – prospective measurement) | ||||||||||||
| 3 | Non-ran-domised studies | Not serious | Very seriouse | not serious | seriousf | none | 426 | 395 | - | SMD 0.122 SD higher (0.491 lower to 0.735 higher) | ⴲⵔⵔⵔ Very lowee,f | IMPORTANT |
| Outcome 6: ISI difference (traditional measurement method) (assessed with: Traditional ISI [patellar tendon/patella length ratio]) | ||||||||||||
| 3 | Non-ran-domised studies | Not serious | Very seriousg | not serious | serioush | none | 270 | 241 | - | SMD 0.301 SD higher (0.605 lower to 1.208 higher) | ⴲⵔⵔⵔ Very lowgg,h | IMPOR-TANTlea |
1a Very high heterogeneity (I2 = 93.9%, p < 0.0001) with unexplained variation in effect sizes across studies
1c Very high heterogeneity (I2 = 96.8%, p < 0.0001) with large variation in effect estimates between two studies
1e Very high heterogeneity (I2 = 94.6%, p < 0.0001) with the opposite direction of effect in one study (Kwak 2021: SMD −0.498)