
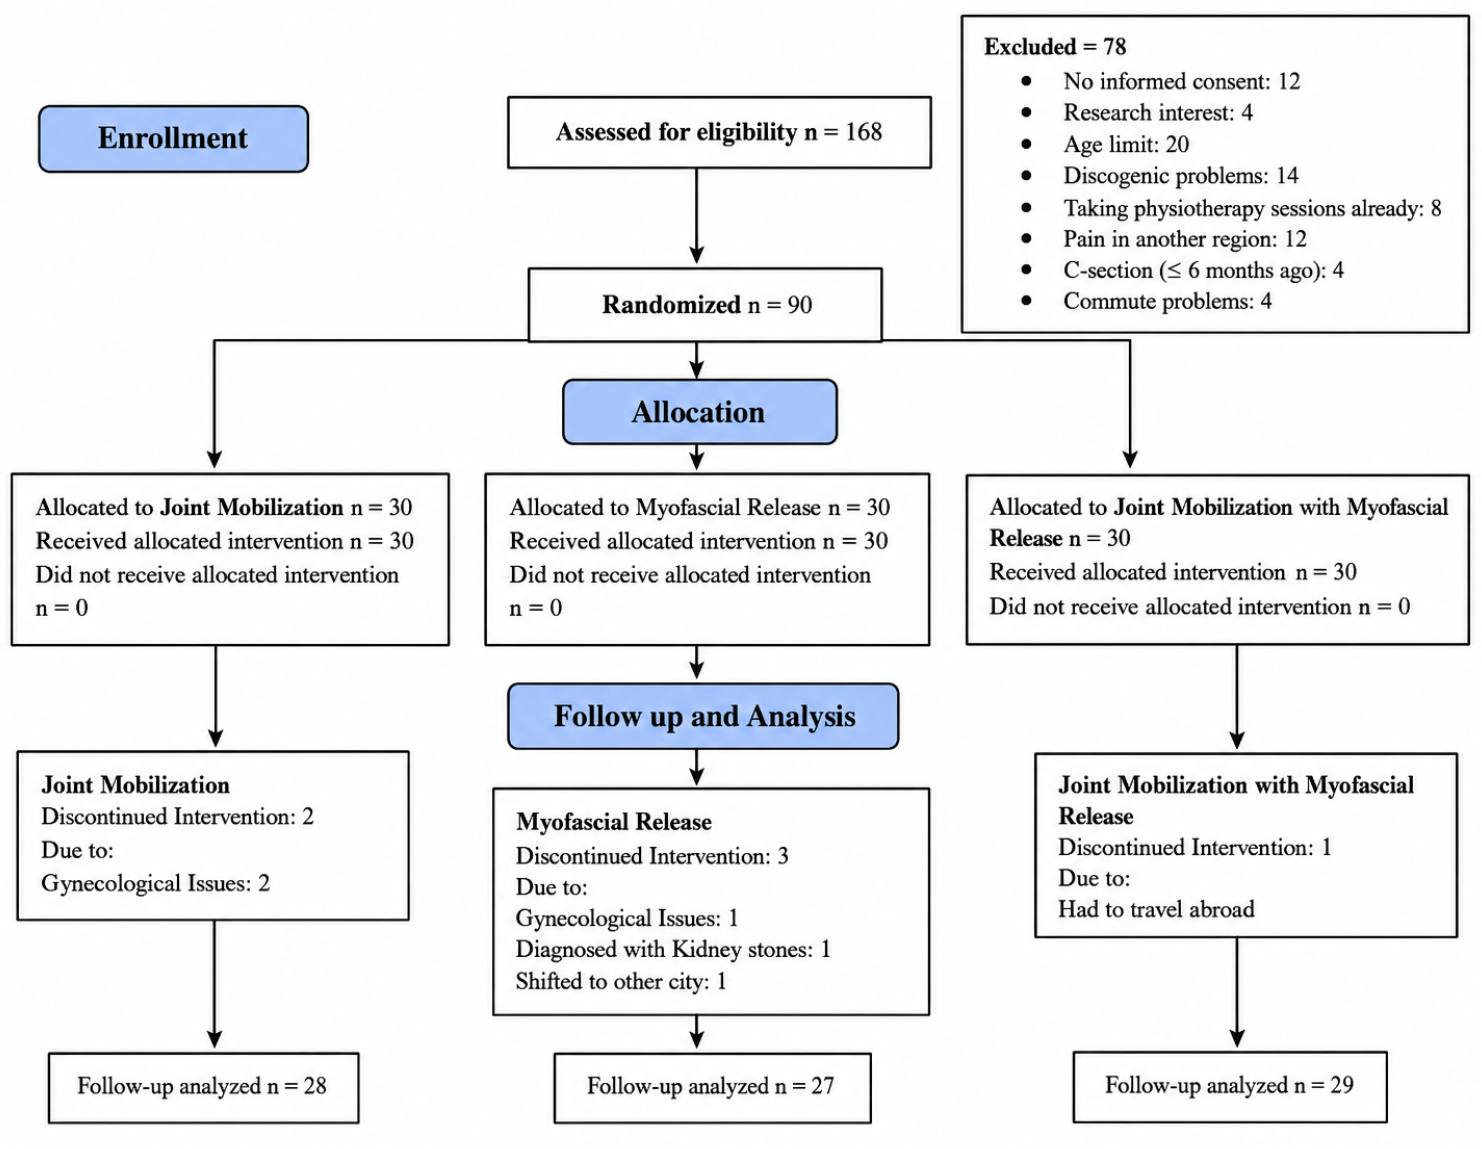
Figure 1.
CONSORT Flow diagram. CONSORT – consolidated standards of reporting trials
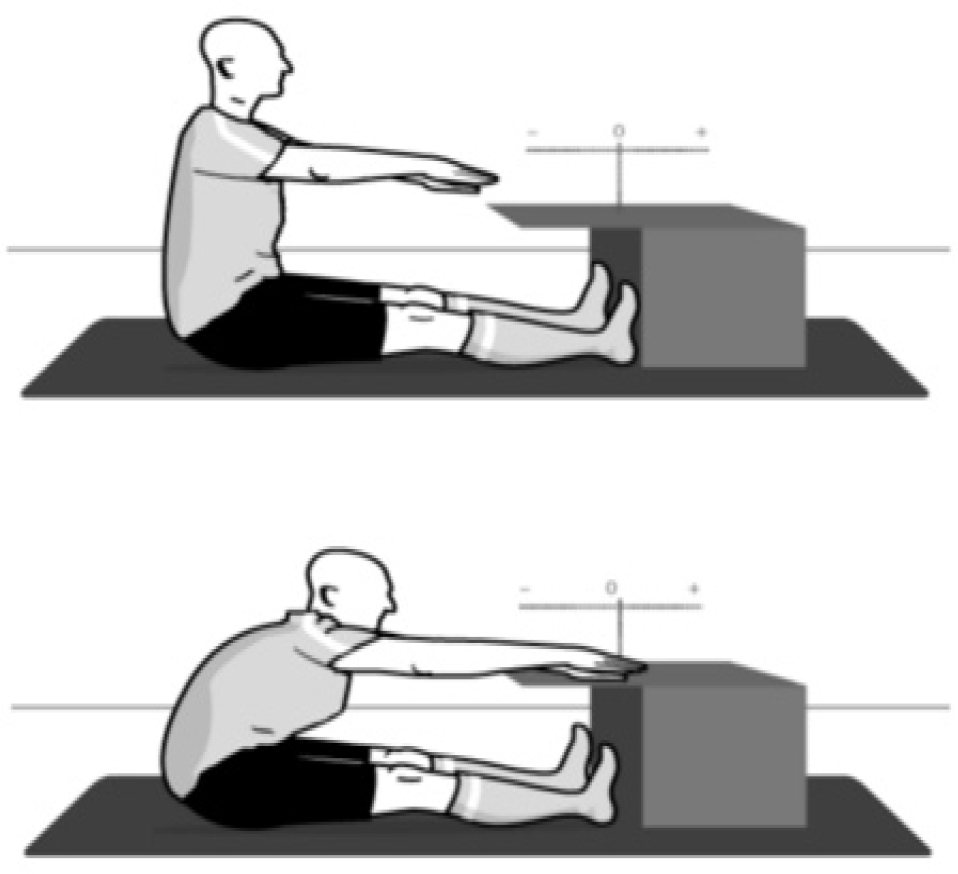
Figure 2.
Sit-and-reach test16
Table 1.
Mean score comparison within and among groups, as well as time and group interaction in STR test
| Assessment | RM-A-NOVA | Time main Effect | Group main Effect | Time × group interaction effect | ||||||||||
|---|---|---|---|---|---|---|---|---|---|---|---|---|---|---|
| Groups | Baseline | Post-day 1 | Post-day 4 | Post-day 8 | Post-day 12 | Follow-up in 4th week | Sig. | F-value (effect size) | Sig. | F-value (effect size) | Sig. | F-value (effect size) | Sig. | |
| STR | JM | 35.50 ± 12.06 | 39.30 ± 13.67 | 38.78 ± 11.63 | 37.45 ± 9.36 | 41.40 ± 9.73 | 42.38 ± 10.23 | 0.090 | 13.72* (0.155) | 0.000 | 20.528* (0.354) | 0.000 | 4.13* (0.099) | 0.001 |
| MFR | 32.13 ± 9.49 | 33.94 ± 9.47 | 33.54 ± 8.28 | 35.34 ± 9.23 | 34.61 ± 9.19 | 34.64 ± 6.89 | 0.441 | |||||||
| JM + MFR | 38.40 ± 11.80 | 41.37 ± 12.19 | 44.94 ± 13.53 | 49.44 ± 10.64 | 51.13 ± 9.28 | 53.37 ± 10.13 | 0.001 | |||||||
| Sig. | 0.11 | 0.06 | 0.00 | 0.00 | 0.00 | 0.00 | ||||||||
1 Effect Size – partial eta squared (η2), F-Value – F statistic, JM – joint mobilisation, JM + MFR – joint mobilisation with myofascial release, MFR – myofascial release, RM-ANOVA – repeated measures analysis of variance, Sig. – significance (p-value), STR – sit and reach, Time × Group Interaction Effect – interaction between time and treatment groups
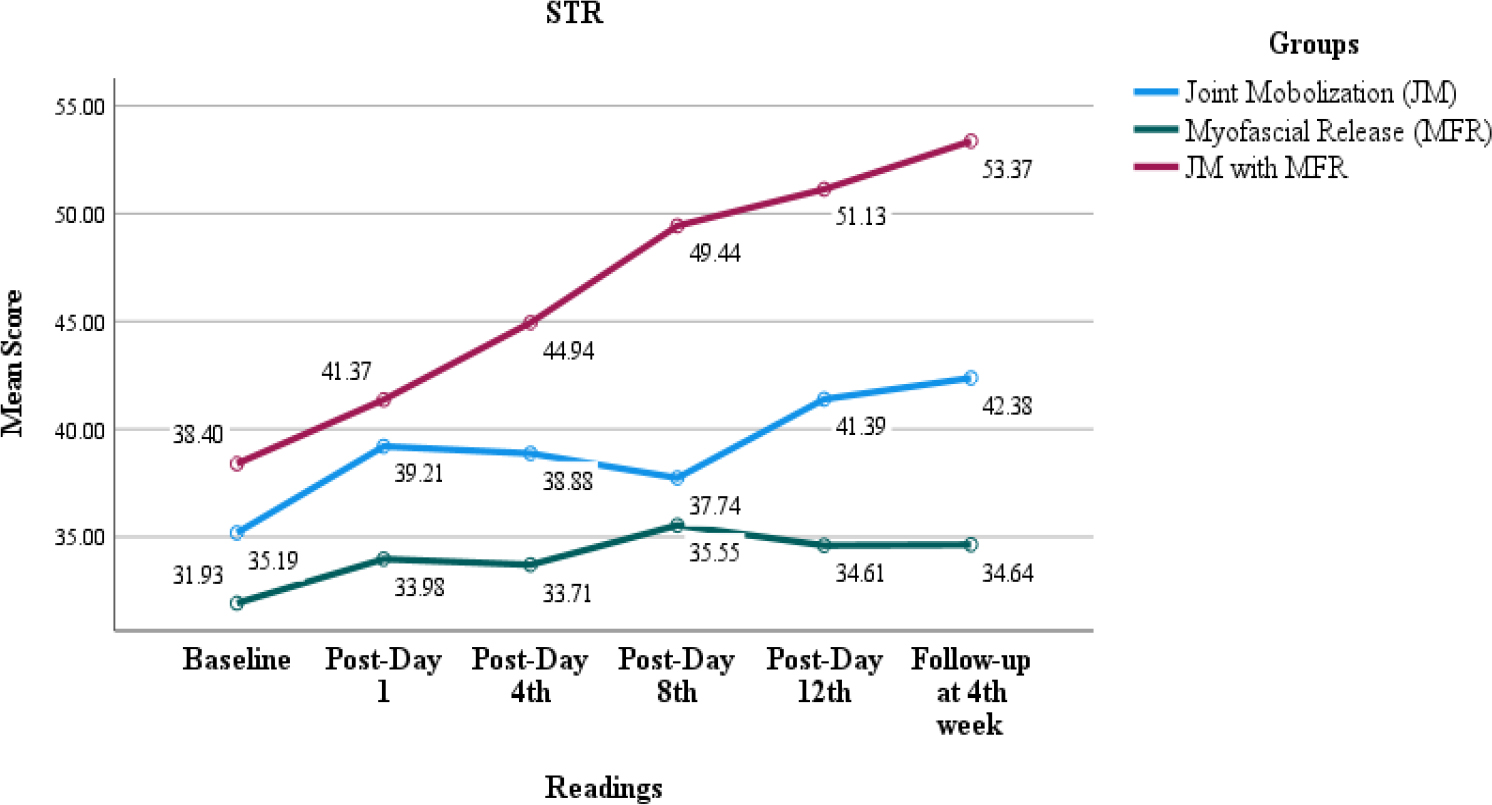
Figure 3.
Line chart STR test. JM – joint mobilization, JM + MFR – joint mobilization with myofascial release, MFR – myofascial release, STR – sit and reach