
Introduction
Non-specific low back pain (NSLBP) lacks a well-defined pathology; therefore, the primary goal of its treatment is to reduce pain and enhance trunk functional mobility1,2. Several studies infer that reduced lumbar spine and hamstring muscle flexibility may alter lumbopelvic mechanics, increase spinal loading and maintain low back pain (LBP); hence, enhancing posterior kinetic chain flexibility may be considered an important component in the prevention and rehabilitation of LBP3,4.
Despite these theories, limited and inconclusive evidence exists to support the idea of a direct and consistent relationship between physical fitness components (especially flexibility) and LBP. Another study5 found that the relationships between LBP and the parameters of physical fitness are weak, which means that NSLBP is multifactorial. However, flexibility tests, such as the sit-and-reach (STR) test, are widely applied in clinical and research studies, to measure combined hamstring and lumbar spine flexibility, since the two can be biomechanically connected during trunk movement6,7.
Previous studies have tried to correlate hamstring and lumbar flexibility with LBP outcomes, with some showing that less flexibility results in more pain or disability, whereas other studies have shown little or no effect8. This inconsistency indicates an existing gap in the literature, especially on the effect of flexibility in response to certain manual therapy interventions, and how such changes influence functional outcomes. Joint mobilisation (JM) and myofascial release (MFR) are also commonly used clinical interventions to treat NSLBP, because they may have an impact on joint mobility, the extensibility of soft tissues and neuromuscular performance2. JM works to restore accessory joint movement, enhance proprioception and reduce stiffness, whereas MFR works on fascial restrictions that inhibit movement and contribute to pain9. However, there is a lack of comparative evidence on their impact on outcomes associated with flexibility, including hamstring and lumbar extensibility, which is why the current study is justified10.
Abdominal muscle strength, lumbar back strength and hamstring flexibility have been postulated to be involved in the prevention and management of LBP, although evidence supporting physical fitness as a deterrent to LBP is still lacking. Manual treatments like JM and MFR have been found to be beneficial in alleviating symptoms by increasing joint mobility, decreasing fascial restriction and improving muscle function. While MFR affects the connective tissue to reduce pain and enhance movement, JM increases proprioception and joint flexibility. Despite the increasing use of these methods, researchers are yet to thoroughly investigate the overall influence of MFR and JM on flexibility, as measured by the STR test. The study aims to fill this gap by comparing the effects of MFR and JM therapy on flexibility using the STR test in NSLBP.
MATERIALS AND METHODS
Study design and participants
This randomised clinical trial was conducted at the Al-Razi Healthcare and Riphah Rehabilitation Centre, Lahore, after approval by the Institutional Review Board (Ethics No. REC/RCR & AHS/21/1104). This study was registered on ClinicalTrials.gov (NCT04860726). The sample size was calculated using n4studies software (version 1.4), based on the estimates from a pilot study (n = 30), with a = 0.05, power = 80% and a two-tailed independent comparison. The required sample was 25 participants per group (n = 75). After adding 20% for attrition, 90 participants were recruited, with 84 completing the study11. Participants were randomly allocated to three different groups using a randomisation tool (randomizer.org) and concealed envelopes were assigned to them. The assessor was blinded. The enrolled subjects were aged 20–50 years with no more than 3 months of NSLBP. This study adhered to the Consolidated Standards of Reporting Trials guidelines, as illustrated in Figure 1.
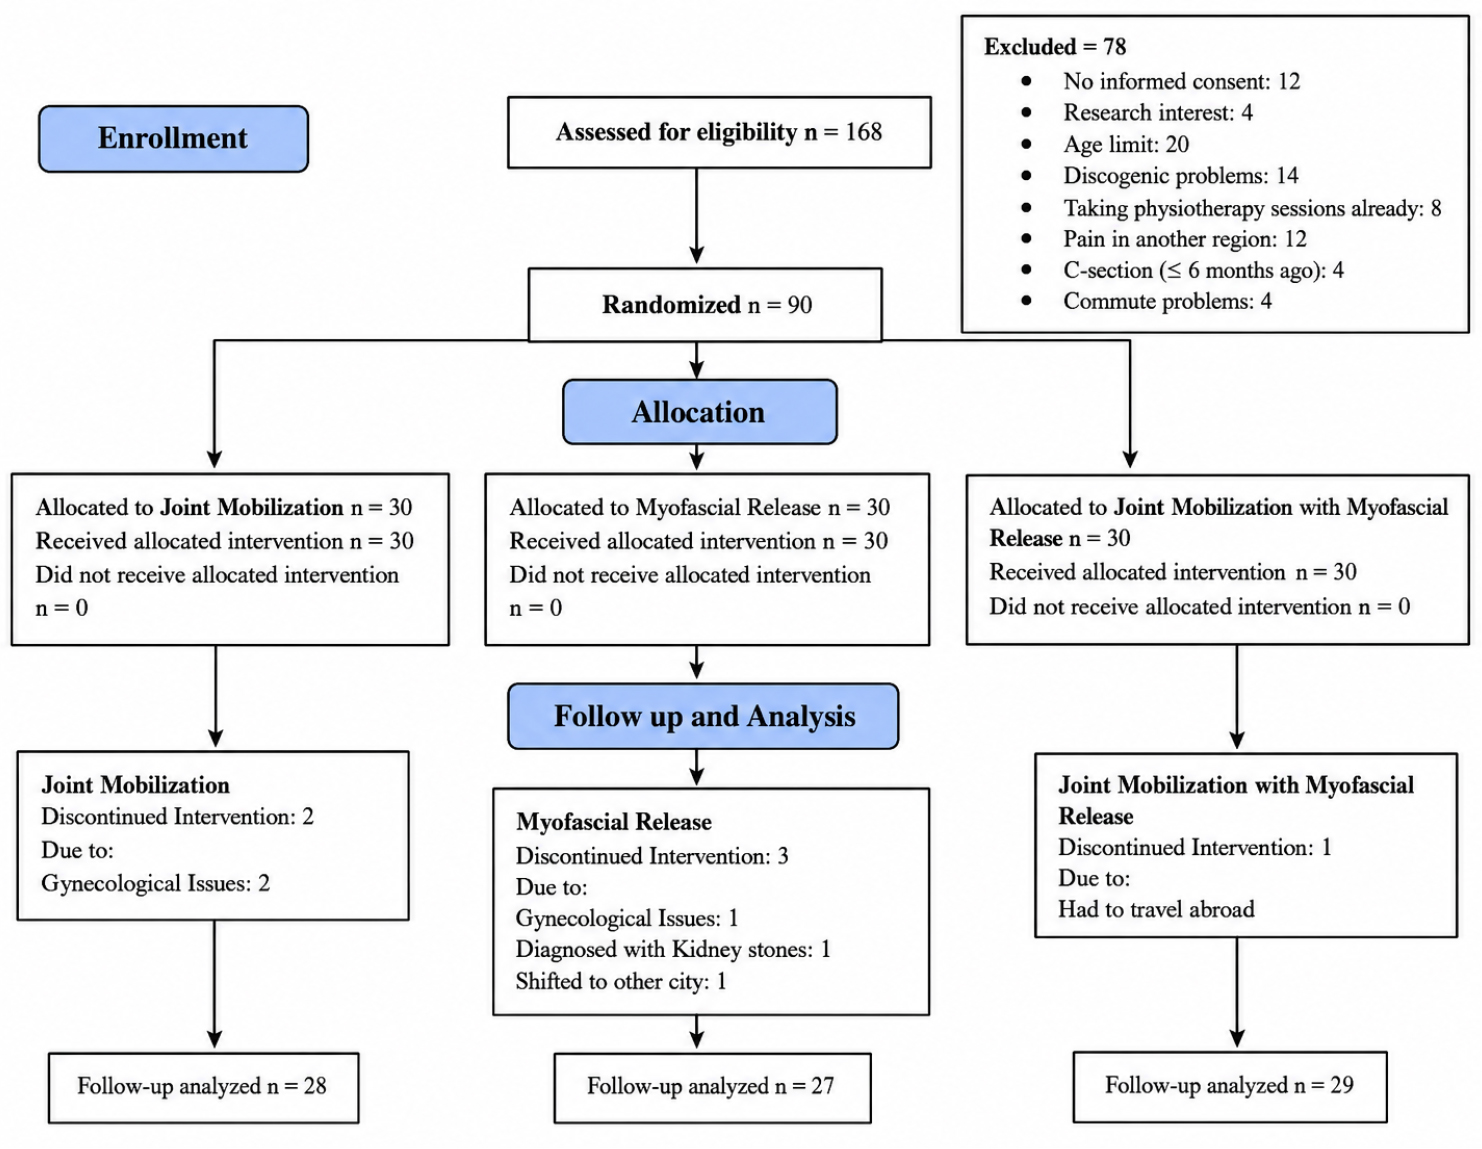
Figure 1.
CONSORT Flow diagram. CONSORT – consolidated standards of reporting trials
The diagnosis was confirmed by a physical test, which involved a standing, sitting and lying position test and a neurological screen: the Flexion, Abduction, and External Rotation (FABER) and Straight Leg Raise (SLR) tests. Respondents with a Numeric Pain Rating Scale pain score of 3–7 should not have undergone any type of physical therapy or exercise within the past 3 months. The exclusion criteria in this study included participants having underlying systemic causes of back pain, red flag symptoms (such as cauda equina syndrome or cancer) or pregnancy; those who had previously been affected in the lumbar area; and those who had sensory or motor impairments12,13.
Informed written consent was obtained, and a self-administered questionnaire was used to obtain demographic information, such as age, gender, height, weight and medical history. In addition, the participants gave a concise description of their LBP, such as the duration of the pain, its worsening factors and the treatment measures tried. The outcome report was the Sit and Reach Test (STR) test, which evaluated the initial flexibility of each of the participants14.
The STR was chosen because of its high reliability (ICC = 0.92) and for its use in daily life conditions to measure the flexibility of the hamstring and the lower back muscles7,15. The test was performed with a normal STR box with centimetre lines, as referred to in Figure 2. The participants sat on the floor with their legs stretched straight in front of them, knees flat and feet against the box. The hands were outstretched, and they slowly bent forward to reach the measuring scale and held the reach position for 2 seconds, without any shaking. The test was done thrice, with a 10-second pause in between. The three trials were evaluated by determining the best score (in centimetres). A positive score (above 0) meant that the person had gone past their toes, whereas a negative score (below 0) meant that the person had not reached their toes16.
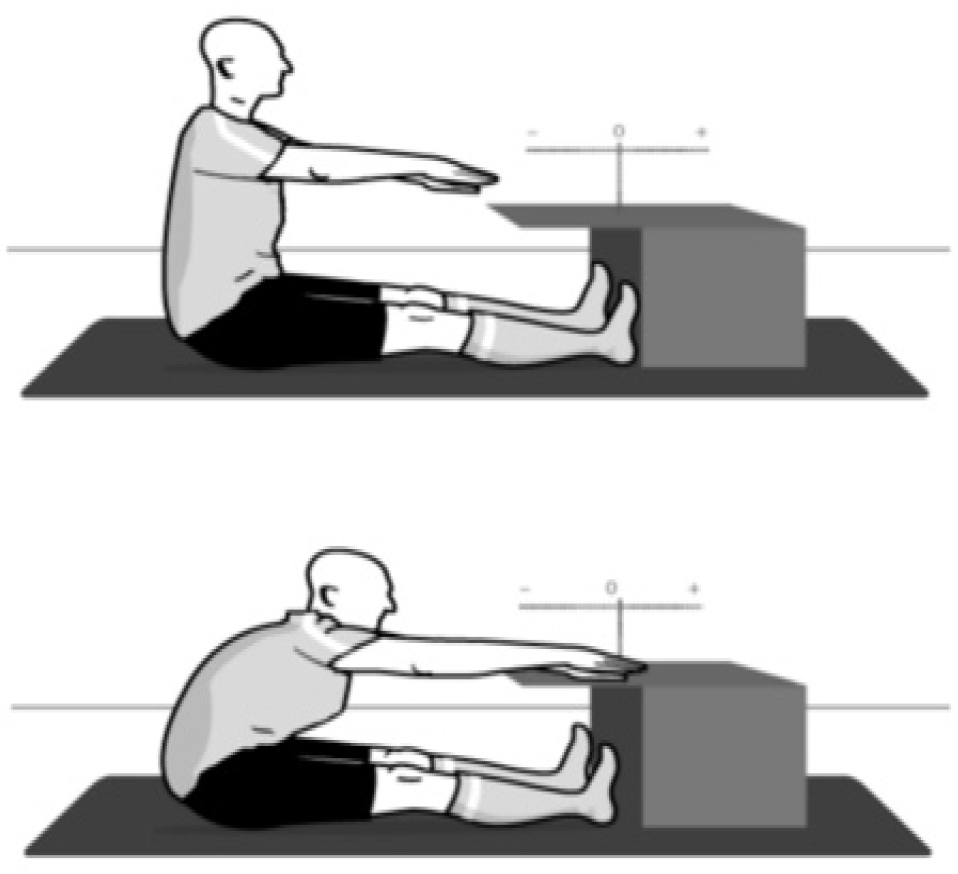
Figure 2.
Sit-and-reach test16
All the patients were subjected to four sessions of therapy during 2 weeks, that is, on days 1, 4, 8 and 12. Group A underwent Maitland JM Methods (Grades III and IV), which included passive accessory oscillatory motions for the lumbar vertebrae. These movements mainly comprise anterior–posterior, central, and unilateral pressures. These techniques were applied to prone patients following a standard protocol of manual treatment17, using large amplitude oscillations at end-range (Grade III) or small amplitude oscillations which surpassed the resistance (Grade IV).
The members of Group B were treated with MFR, which focused on the thoracolumbar fascia (TLF). The positioning in the lateral raphe of the TLF was common to the side-lying position, with a regular vertical pressure against the centre of the lateral raphe maintained at 90–120 seconds over the anatomical bones. The pain rating was given by the participants on a scale of 0–10, based on their comfort level, and the pressure from the therapist was also adjusted to a level that the participants could tolerate. In case a participant scored 10 (which means it was unbearable pain), then the therapy was cancelled18. Group C was treated to both forms of treatment in the same session.
A standard 15-minute application of a heat pack was done on all the participants before each treatment session, to prepare their soft tissues. Furthermore, there were six intervals at which the STR scores were measured, including not receiving treatment (day 1) and right after treatment (day 1), days 4, 8, 12 and 1 month later. To be consistent, all the assessments were carried out by a single qualified physiotherapist. All tests were done with the same STR box, in the same environment and with the same verbal instructions.
Data collection
The protocol was strictly followed during the data collection process. Before every STR test, the participants were engaged in short dynamic stretches to warmup. The room temperature and the flooring conditions were maintained evenly. The assessor recorded the outcomes on a structured log sheet after every attempt at STR. The assessor did not know the group assignments of the participants in the study, and did not make any encouraging signals during the assessment to reduce bias in the measurements.
Statistical analysis
Statistical analysis was done using SPSS version 26. The mean and standard deviation of the STR scores across all time points were calculated. The Kolmogorov–Smirnov test was employed to assess normality. Since the assumptions of normality were satisfied, repeated measures analysis of variance was employed to investigate the within-group changes, between-group differences and interaction effects. Post hoc analysis was applied to investigate the differences among the intervention groups. A significance threshold was set at a p-value of <0.05.
RESULTS
Table 1 shows the STR test results at all time points of assessment for the three intervention groups. The results of the repeated measures analysis of variance showed that there was no significant main effect for time (p > 0.090, F = 13.72), suggesting that there were no changes in flexibility that occurred in the same direction for all participants over time. However, there was a significant main effect for group (p < 0.001, F = 20.528), as well as a significant time × group interaction effect (p < 0.001, F = 4.13), indicating that the changes in STR scores were significantly different among the three intervention groups. It is worth noting that the group that experienced the most improvement in STR scores from baseline to 4 weeks was the JM + MFR group.
Table 1.
Mean score comparison within and among groups, as well as time and group interaction in STR test
| Assessment | RM-A-NOVA | Time main Effect | Group main Effect | Time × group interaction effect | ||||||||||
|---|---|---|---|---|---|---|---|---|---|---|---|---|---|---|
| Groups | Baseline | Post-day 1 | Post-day 4 | Post-day 8 | Post-day 12 | Follow-up in 4th week | Sig. | F-value (effect size) | Sig. | F-value (effect size) | Sig. | F-value (effect size) | Sig. | |
| STR | JM | 35.50 ± 12.06 | 39.30 ± 13.67 | 38.78 ± 11.63 | 37.45 ± 9.36 | 41.40 ± 9.73 | 42.38 ± 10.23 | 0.090 | 13.72* (0.155) | 0.000 | 20.528* (0.354) | 0.000 | 4.13* (0.099) | 0.001 |
| MFR | 32.13 ± 9.49 | 33.94 ± 9.47 | 33.54 ± 8.28 | 35.34 ± 9.23 | 34.61 ± 9.19 | 34.64 ± 6.89 | 0.441 | |||||||
| JM + MFR | 38.40 ± 11.80 | 41.37 ± 12.19 | 44.94 ± 13.53 | 49.44 ± 10.64 | 51.13 ± 9.28 | 53.37 ± 10.13 | 0.001 | |||||||
| Sig. | 0.11 | 0.06 | 0.00 | 0.00 | 0.00 | 0.00 | ||||||||
1 Effect Size – partial eta squared (η2), F-Value – F statistic, JM – joint mobilisation, JM + MFR – joint mobilisation with myofascial release, MFR – myofascial release, RM-ANOVA – repeated measures analysis of variance, Sig. – significance (p-value), STR – sit and reach, Time × Group Interaction Effect – interaction between time and treatment groups
Figure 3 illustrates changes in the STR test scores across assessment time points for all groups. The JM + MFR group demonstrated the greatest and most consistent improvement in flexibility, particularly at later assessments and at the 4th-week follow-up, compared with JM and MFR alone.
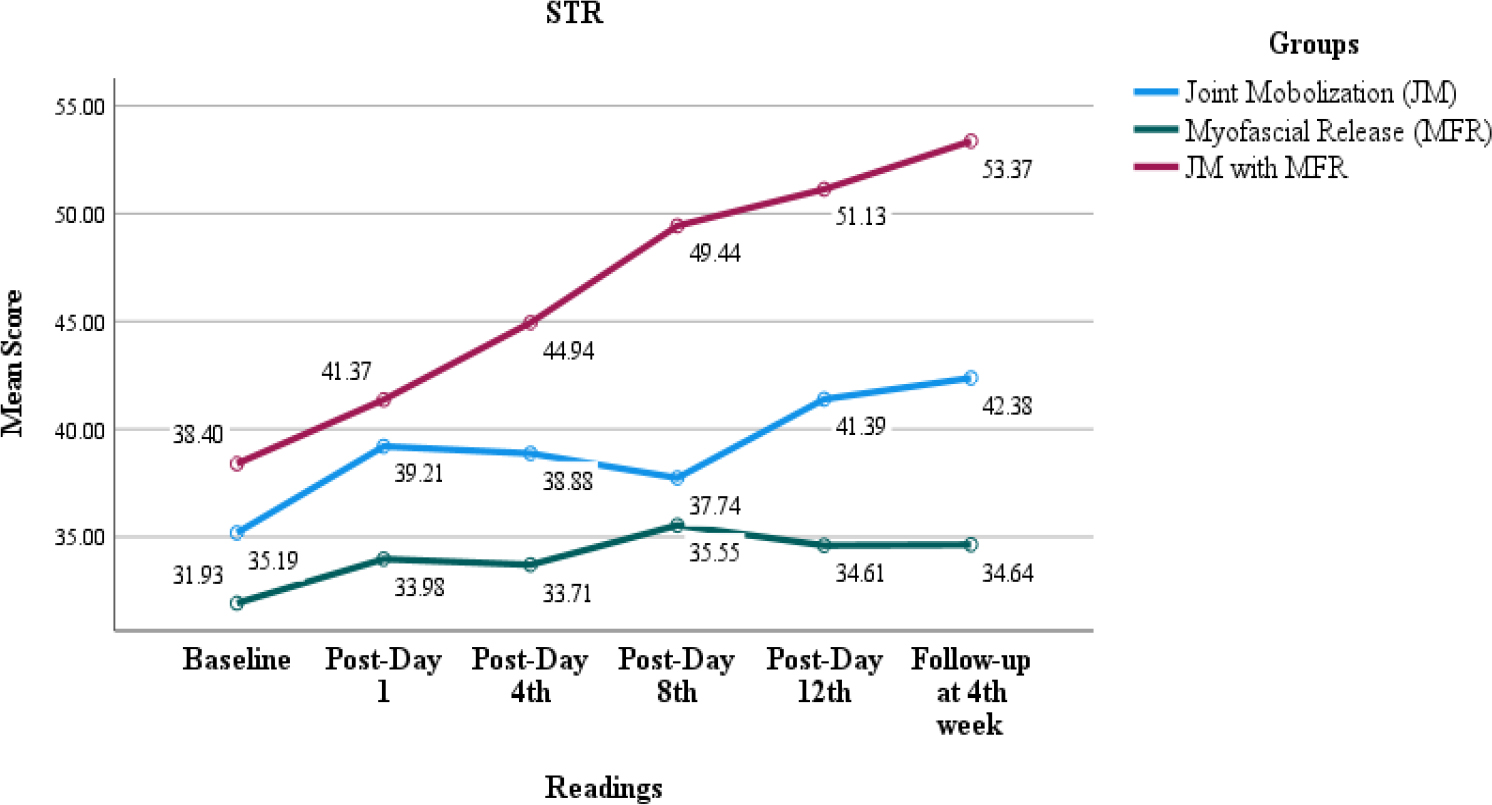
Figure 3.
Line chart STR test. JM – joint mobilization, JM + MFR – joint mobilization with myofascial release, MFR – myofascial release, STR – sit and reach
Table 2 presents the percentage changes in STR scores across the JM, MFR and JM with MFR groups. The JM group showed the greater percentage changes at 61.6%, followed by MFR at 26.8% and JM + MFR at 23.3%. However, post hoc comparisons indicated that the JM + MFR group differed significantly from both JM and MFR (p < 0.001).
DISCUSSION
In this study, the impact of JM, MFR and the combination of these techniques on flexibility in patients with NSLBP, as measured by the STR, was investigated. The results show significant between-group differences and a significant time × group interaction, which means that the changes in flexibility were dependent on the group to which the subjects belonged. In general, the combination of JM and MFR showed the greatest improvements in flexibility.
The average STR values for Group C showed a significant increase from 38.40 ± 11.80 at baseline to 53.37 ± 10.13 at the 4-week follow-up, suggesting that this improvement may be attributed to the complementary effects of JM and MFR, which together enhance both joint mobility and fascial extensibility. The combined modulation of joint and fascial components offers a rational biomechanical explanation for the greater improvements observed in the JM + MFR group. JM is known to mainly focus on reducing capsular stiffness and joint hypomobility19, while MFR may improve the glide and elasticity of fascial tissues.
The significant time × group interaction (p 0.001, η2 = 0.099) indicates a low to moderate effect size according to Cohen’s criterion. This finding is consistent with the findings of Shehada and Halaweh20, who also showed low to moderate effect sizes in individuals undergoing MFR for chronic low back pain (CLBP). The standard deviation found at the start for Group C (11.80) indicates significant inter-individual variability in baseline flexibility and symptom presentation, supporting the finding that numerous physical factors have an impact on how LBP shows up21. Consequently, although improvements in Group C were significant, their interpretation needs to account for the variability in patient responses.
The greater improvements of Group C in STR are consistent with the results of Jamali Brayjani et al.22, who found improved lumbar ROM when MFR was combined with motor control training. However, as Lopez et al.23 contend, multimodal treatments, while beneficial, introduce confusing factors that mask which method produces the best results. This finding underlines the need for factorial design studies in separating and evaluating intervention elements strictly. Clinically, especially in patients with mechanical CLBP, the results show encouraging evidence for employing JM + MFR for treating lumbar-pelvic mobility impairments. However, participant homogeneity and a lack of distinction between mechanical and neuropathic LBP sub-types restrict generalizability24.
The significant percentage increase seen in the JM group (61.6% ± 93.5) most certainly reflects statistical artefacts rather than actual clinical improvements. Although a typical mistake in interpreting normalised change measures, participants in this group may have had lower baseline STR scores, which therefore exaggerates their relative percentage change, even with small absolute improvements. Patients with little baseline flexibility often show more proportionate increases, as Schleip R21 pointed out, which might distort perceived efficacy without any functional benefits. Furthermore, the high standard deviation points to outlier responses that distort the group mean, therefore generating questions regarding inter-individual variability and unequal treatment response.
LIMITATIONS AND RECOMMENDATIONS
Although the results appear favourable, several issues should be emphasised. First, the study did not conduct a long-term follow-up, which complicates the ability to determine how long the benefits of flexibility last, particularly for individuals with CLBP. Second, while the STR is a widely used measure of flexibility, it does not entirely reflect dynamic or functional movement patterns that are vital for daily activities. Another concern is the possibility of anticipation and placebo effects, as it was not feasible to blind either the therapists or the participants due to the hands-on nature of the therapies.
Moreover, the high diversity level among all individuals, especially in Group C, implies that preliminary flexibility and pain sensitivity might be determining factors. Finally, although significant effects have been observed, the small size of the samples in each group and the non-uniform change in percentages (e.g. a large positive change in JM because the values were low at the baseline) imply the need for additional rigorous, factorial-design, randomised controlled trials to understand the actual effects of MFR and JM.
Future research should carry out the assessment again after 3 and 6 months to determine whether the clinical benefits are long-term. Future studies must include task-specific functional testing, such as assessing how well individuals can bend forward and lift objects. Sham-controlled designs would be beneficial in separating the actual effects of therapy and the expectations of patients. The research in the future needs to separate the participants according to their disability levels at the baseline. To improve the validity of the findings and the insights into the underlying mechanisms, it is advisable to increase the sample size, apply imaging techniques, such as ultrasound elastography, to prove the change in fascia, and study different populations with different types of back pain.
CONCLUSIONS
Both MFR and JM individually and in combination, improved flexibility in patients with NSLBP, as measured by STR performance. The combined intervention produced the largest and most consistent improvements, suggesting that a multimodal manual therapy approach may offer greater benefits than singletechnique interventions. These findings support the use of combined manual therapies to address flexibility deficits in the lumbar spine and hamstrings among patients with NSLBP.
Notes
[3] Conflicts of interest CONFLICTS OF INTEREST
The authors declare no conflicts of interest.