
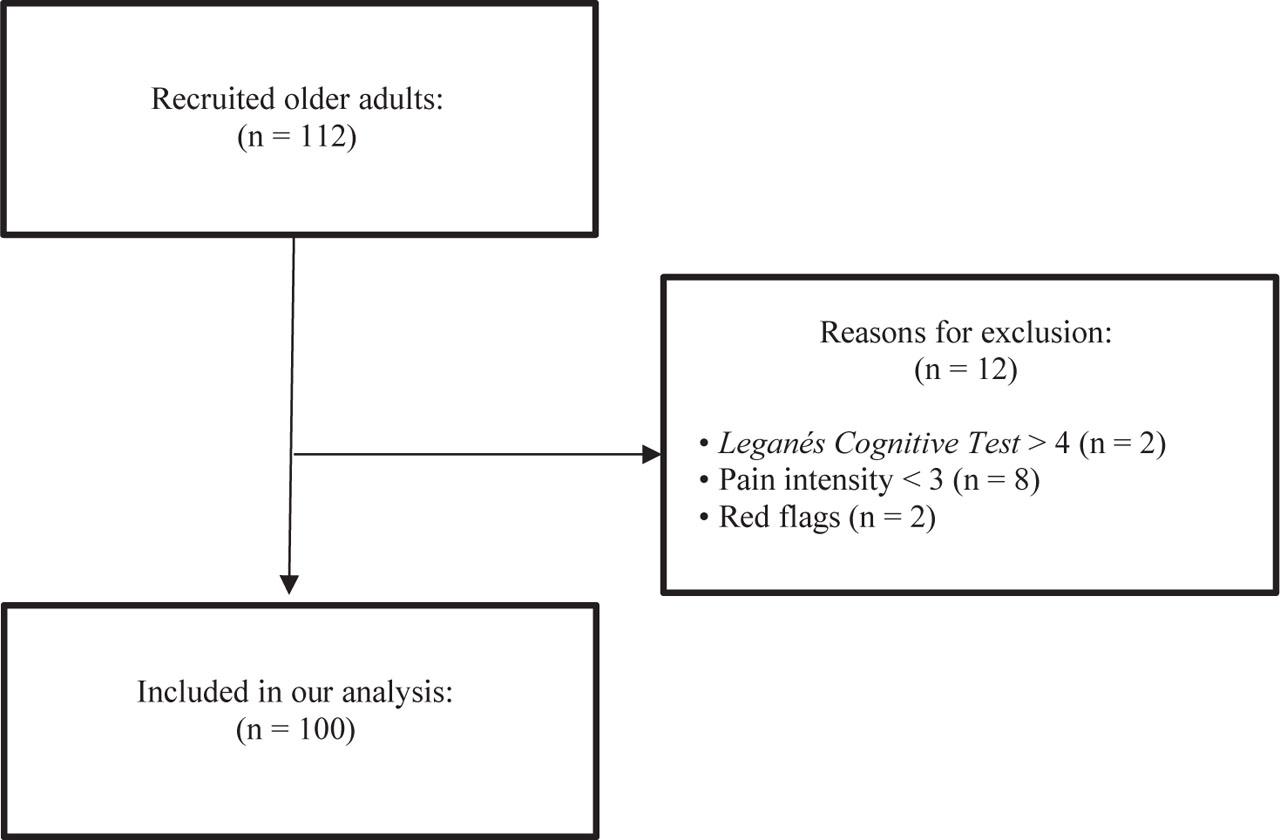
Figure 1.
Demographic characteristics of the sample
| Characteristics | (n = 100) |
|---|---|
| Age (years) | 69.8 ± 6.6 |
| Female sex | 69 (69) |
| BMI | 27.3 ± 5.2 |
| Marital status | |
| Single | 22 (22) |
| Married | 45 (45) |
| Divorced | 18 (45) |
| Widower | 15 (15) |
| Education level | |
| Illiterate | 2 (2) |
| Primary school | 43 (43) |
| Secondary school | 40 (40) |
| University degree | 15 (15) |
| Occupational status | |
| Paid activity | 21 (21) |
| No paid activity | 79 (79) |
| CLBP duration (weeks) | |
| 12–23 | 6 (6) |
| 24–35 | 5 (5) |
| 36–52 | 6 (6) |
| >52 | 83 (83) |
| Practice of physical activity | |
| Yes | 39 (39) |
| No | 61 (61) |
| Medications in use (number) | 3.7 ± 2.5 |
| Use of sleep-inducing medications | 31 (31) |
| Total hours of sleep (per night) | 6.2 ± 1.6 |
| Pain intensity (0–10 points) | 7.6 ± 1.8 |
| Functional disability (0–24 points) | 13.3 ± 5.3 |
| OSA risk | |
| No risk | 12 (12) |
| Low risk | 50 (50) |
| High risk | 36 (36) |
| Excessive daytime sleepiness (0–24 points) | 7.3 ± 5.0 |
| Sleep quality (0–21 points) | 8.54 ± 4.0 |
| Depression symptoms (0–15 points) | 4.9 ± 4.1 |
| Comorbidities (total) | 5.5 ± 2.3 |
Results of univariate linear regressions and multivariable linear regressions between excessive daytime sleepiness (independent variable) and pain intensity and functional disability (dependent variables)
| Pain intensity (NPRS) | Functional disability (Roland–Morris Disability Questionnaire) | ||||||
|---|---|---|---|---|---|---|---|
| Independent variables: excessive daytime sleepiness; dependent variables: pain intensity (NPRS) and functional disability (Roland–Morris Disability Questionnaire); covariates: age, depressive symptoms (GDS-15), BMI, occupational status, comorbidities number. | |||||||
| R2 (adjusted R2), % | Coefficient β (CI 95%) | p value | R2 (adjusted R2), % | Coefficient β (CI 95%) | p value | ||
| Univariate linear regression model | Univariate linear regression model | ||||||
| (constant) | 0.00 (−0.01) | 7.72 (7.01–8.37) | 0.00 | (constant) | 11.3 (10.4) | 10.60 (8.82–12.44) | 0.00 |
| Excessive daytime sleepiness (Epworth sleepiness scale) | −0.02 (−0.22 to 0.18) | 0.84 | Excessive daytime sleepiness (Epworth sleepiness scale) | 0.34 (0.15−0.53) | 0.00a | ||
| Multivariable linear regression model | Multivariable linear regression model | ||||||
| (constant) | 18.2 (12.8) | 1.61 (−3.09 to 6.32) | 0.50 | (constant) | 48.4 (45.0) | 0.40 (−10.65 to 11.45) | 0.94 |
| Age | 0.12 (−0.07 to 0.31) | 0.22 | Age | −0.02 (−0.17 to 0.14) | 0.83 | ||
| Depressive symptoms (GDS-15) | 0.28 (0.07–0.47) | 0.01a | Depressive symptoms (GDS-15) | 0.52 (0.36–0.68) | 0.00a | ||
| BMI | 0.23 (0.03–0.43) | 0.02 | BMI | 0.24 (0.08–0.40) | 0.00a | ||
| Occupational status | 0.15 (−0.04 to 0.34) | 0.12 | Occupational status | 0.06 (−0.09 to 0.21) | 0.44 | ||
| Comorbidities number | 0.16 (−0.05 to 0.37) | 0.14 | Comorbidities number | 0.14 (−0.02 to 0.31) | 0.09 | ||
| Excessive daytime sleepiness (Epworth sleepiness scale) | −0.21 (−0.42 to −0.01) | 0.04 | Excessive daytime sleepiness (Epworth sleepiness scale) | 0.10 (−0.06 to 0.27) | 0.23 | ||
Prevalence of sleep complaints (n = 100)
| Sleep complaints | ‘Do you have any of the following problems during sleep?’, n (%) | ‘How frequent is the problem?’, n (%) | ||||
|---|---|---|---|---|---|---|
| Less than once a month | Once a month | 2–3 times a month | 1–2 times a week | 3 or more times a week | ||
| Any sleep complaint | 96 (96)a | - | - | - | - | - |
| Insufficient sleep | 55 (55)a | 4 (4) | 3 (3) | 3 (3) | 17 (17) | 28 (28) |
| Snoring | 57 (57)a | 5 (5) | 2 (2) | 5 (5) | 13 (13) | 32 (32) |
| Insomnia | 53 (53) | 4 (4) | 8 (8) | 5 (5) | 9 (9) | 27 (27) |
| Excessive daytime sleepiness | 31 (31) | 1 (1) | 3 (3) | 3 (3) | 10 (10) | 14 (14) |
| Nocturnal awakening | 76 (76)a | 6 (6) | 1 (1) | 3 (3) | 11 (11) | 55 (55)a |
| Breath complaints | 23 (23) | 4 (4) | 3 (3) | 4 (4) | 2 (2) | 10 (10) |
| Move a lot during sleep | 49 (49) | 1 (1) | 1 (1) | 0 (0) | 10 (7) | 37 (37) |
| Kick legs | 33 (33) | 3 (3) | 1 (1) | 0 (0) | 5 (5) | 24 (24) |
| Sleep-talking | 19 (19) | 4 (4) | 4 (4) | 3 (3) | 3 (3) | 5 (5) |
| Nightmare | 41 (41) | 9 (9) | 12 (12) | 6 (6) | 11 (11) | 3 (3) |
| Bruxism | 31 (31) | 3 (3) | 8 (8) | 4 (4) | 1 (1) | 15 (15) |
| Sleepwalking | 0 (0) | 0 (0) | 0 (0) | 0 (0) | 0 (0) | 0 (0) |
| Other complaints | 5 (5) | - | - | - | - | - |
Results of univariate linear regressions and multivariable linear regressions between the risk of OSA (independent variable) and pain intensity and functional disability (dependent variables)
| Pain intensity (NPRS) | Functional disability (Roland–Morris Disability Questionnaire) | ||||||
|---|---|---|---|---|---|---|---|
| Independent variables: OSA risk (Berlin Questionnaire); dependent variables: pain intensity (NPRS) and functional disability (Roland–Morris Disability Questionnaire); covariates: age, depressive symptoms (GDS-15), BMI, occupational status, comorbidities number. | |||||||
| R2 (adjusted R2), % | Coefficient β (CI 95%) | p value | R2 (adjusted R2), % | Coefficient β (CI 95%) | p value | ||
| Univariate linear regression model | Univariate linear regression model | ||||||
| (constant) | 9.1 (8.1) | 6.72 (6.00–7.43) | 0.00 | (constant) | 10.7 (9.8) | 10.19 (8.12–12.26) | 0.00 |
| OSA risk (Berlin Questionnaire) | 0.30 (0.16–0.72) | 0.00a | OSA risk (Berlin Questionnaire) | 0.33 (0.20–0.75) | 0.00a | ||
| Multivariable linear regression model | Multivariable linear regression model | ||||||
| (constant) | 16.5 (11.1) | 2.72 (−1.98 to 7.42) | 0.25 | (constant) | 47.2 (43.8) | 0.13 (−10.86 to 11.12) | 0.98 |
| Age | 0.09 (−0.10 to 0.28) | 0.36 | Age | −0.02 (−0.17 to 0.14) | 0.83 | ||
| Depressive symptoms (GDS-15) | 0.19 (−0.01 to 0.40) | 0.06 | Depressive symptoms (GDS-15) | 0.52 (0.35–0.67) | 0.00a | ||
| BMI | 0.13 (−0.08 to 0.33) | 0.22 | BMI | 0.25 (0.09–0.41) | 0.00a | ||
| Occupational status | 0.12 (−0.07 to 0.31) | 0.20 | Occupational status | 0.07 (−0.08 to 0.22) | 0.38 | ||
| Comorbidities number | 0.07 (−0.14 to 0.28) | 0.53 | Comorbidities number | 0.16 (−0.01 to 0.33) | 0.06 | ||
| OAS risk (Berlin Questionnaire) | 0.19 (−0.03 to 0.59) | 0.07 | OSA risk (Berlin Questionnaire) | 0.05 (−0.17 to 0.32) | 0.53 | ||
Results of univariate linear regressions and multivariable linear regressions between sleep quality (independent variable) and pain intensity and functional disability (dependent variables)
| Pain intensity (NPRS) | Functional disability (Roland–Morris Disability Questionnaire) | ||||||
|---|---|---|---|---|---|---|---|
| Independent variables: Sleep Quality (PSQI); dependent variables: pain intensity (NPRS) and functional disability (Roland–Morris Disability Questionnaire); | |||||||
| R2 (Adjusted R2), % | Coefficient β (CI 95%) | p value | R2 (Adjusted R2), % | Coefficient β (CI 95%) | p value | ||
| Univariate linear regression model | Univariate linear regression model | ||||||
| (constant) | 8.0 (7.0) | 6.59 (5.76–7.41) | 0.00 | (constant) | 28.8 (28.1) | 7.14 (4.99–9.28) | 0.00 |
| Sleep quality (PSQI) | 0.28 (0.09–0.47) | 0.00a | Sleep quality (PSQI) | 0.54 (0.37–0.71) | 0.00a | ||
| Multivariable linear regression model | Multivariable linear regression model | ||||||
| (constant) | 15.5 (10.0) | 2.21 (−2.55 to 6.97) | 0.36 | (constant) | 51.0 (47.8) | −1.65 (−12.30 to 9.00) | 0.76 |
| Age | 0.09 (−0.10 to 0.29) | 0.34 | Age | −0.01 (−0.16 to 0.14) | 0.88 | ||
| Depressive symptoms (GDS-15) | 0.15 (−0.08 to 0.38) | 0.20 | Depressive symptoms | 0.41 (0.23–0.58) | 0.00a | ||
| BMI | 0.16 (−0.04 to 0.36) | 0.12 | BMI | 0.24 (0.08 to 0.39) | 0.00a | ||
| Occupational status | 0.14 (−0.05 to 0.34) | 0.15 | Occupational status | 0.10 (−0.04 to 0.25) | 0.16 | ||
| Comorbidities number | 0.09 (−0.12 to 0.30) | 0.41 | Comorbidities number | 0.14 (−0.02 to 0.30) | 0.09 | ||
| Sleep quality (PSQI) | 0.17 (−0.06 to 0.41) | 0.15 | Sleep quality (PSQI) | 0.25 (0.07–0.43) | 0.01a | ||