
Low back pain is a substantial contributor to functional disability in Brazil1, especially among older adults2. As of 2017, the estimates indicated that approximately 22,000 per 100,000 older adults aged 70 or above had chronic low back pain (CLBP)3, and this prevalence can be even higher due to longer life expectancy4. These factors cause economic burden on the Brazilian healthcare system and reduce the overall quality of life for the population5.
Sleep disorders have been found to be risk factors for CLBP6. It is a bidirectional relationship in which pain disrupts sleep and poor sleep quality increases pain, leading to a vicious cycle7,8,9. Among these disorders, obstructive sleep apnoea (OSA) and excessive daytime sleepiness are prevalent among older adults10. OSA is characterised by airway obstruction during sleep, increased respiratory effort, nocturnal hypoxaemia and sleep fragmentation11 and may increase mortality12. In addition, excessive daytime sleepiness is a key symptom of OSA that causes drowsiness and unintentional sleep lapses13. In this way, about 21% of the community-dwelling older adults may experience excessive daytime sleepiness14 associated with enhanced functional disability15.
Previous studies addressed the relationship between OSA and pain, including headaches16, fibromyalgia and temporomandibular pain17,18. However, few studies focused on the association between OSA and CLBP19. Older adults with CLBP and OSA (and possible excessive daytime sleepiness) may experience increased pain intensity and reduced pain tolerance due to nocturnal hypoxaemia, sleep fragmentation and reduced rapid eye movement sleep20. Additionally, the excessive daytime sleepiness may amplify nociceptive sensitivity and exacerbate pain perception21.
Sleep disorders affect sleep quality, which refers to an individual's subjective satisfaction with all aspects of the sleep experience22. In addition, older adults with chronic musculoskeletal pain are nearly three times more likely to experience poor sleep quality23,24. Therefore, sleep quality predicts increased intensity of CLBP in older adults6.
Considering the prevalence of CLBP and OSA in older adults, many Brazilians experience the co-occurrence of these disorders, resulting in years of pain and functional disability. Hence, this study aimed to investigate the association between the risk of OSA, excessive daytime sleepiness, sleep quality, pain intensity and functional disability, and to estimate the prevalence of sleep complaints in older adults with CLBP.
This cross-sectional study was approved by the research ethics committee of the Federal University of Minas Gerais (UFMG) (# 49334621.2.0000.5149). All participants provided informed consent.
The recruitment occurred at a primary care setting. The sample included older adults of both sexes aged ≥60 who experienced low back pain for at least 3 months. Low back pain was defined as pain between the costal margins and lower glutaeal folds, regardless of pain in the lower limb(s). Individuals were eligible if they answered ‘yes’ to the question ‘Do you feel low back pain today? If yes, does this pain last for 3 months or more?’9. This question was used to ensure that participants had active CLBP at the time of data collection, thereby excluding individuals with only a past history of low back pain.
Exclusion criteria encompassed individuals with acute low back pain, low back pain intensity <3 points on the numeric pain rating scale (NPRS) in the past week, recent surgical procedures, indications of red flags (e.g., vertebral fracture, cancer, or infection), refusal to sign the informed consent form or confirmed cognitive deficit (i.e., Leganes Cognitive Test score >4 points). The Portuguese version of the Leganes Cognitive test demonstrated good reliability among Brazilian older adults with low educational levels25.
Individuals who had used an analgesic within 12 hours prior to the interview were instructed to return on another day. The present study used data from the initial assessment collected in a primary study on the responsiveness of functional tests in older adults with CLBP.
The included individuals participated in a 45-minute, in-person interview with a researcher. The interview involved the collection of sociodemographic and lifestyle data (e.g., age, sex, body mass index[BMI], marital and occupational status, educational level, duration of CLBP, regular physical activity [daily, 30 minutes per day, 5 days per week]26, number of comorbidities, medications in use, use of sleep-inducing medications and total hours of sleep per night).
The Self-Administered Comorbidity Questionnaire identified a number of comorbidities27. This questionnaire includes 12 common comorbidities in older adults and permits additional ones. The total number of comorbidities for each individual was considered for analysis.
The risk of OSA was assessed using the Berlin Questionnaire, validated for the Brazilian population13. It comprises 10 items categorised into three groups: (1) snoring and witnessed apnoea, (2) daytime sleepiness and (3) systemic arterial hypertension and obesity. Categories 1 and 2 were considered positive if two or more items were affirmative, whereas Category 3 was considered positive if the individual had systemic arterial hypertension or a BMI ≥30 kg/m2. The number of positive responses across all three categories was summed, with higher scores reflecting a greater risk of OSA.
Excessive daytime sleepiness was assessed using the Epworth Sleepiness Scale, validated for the Brazilian population28. It evaluates the self-reported likelihood of dozing off in eight recent daily situations, with each item scored from 0 to 3. Total scores, ranging from 0 to 24, were summed, with higher scores reflecting greater levels of daytime sleepiness.
Sleep quality was assessed using the Pittsburgh Sleep Quality Index (PSQI), validated for the Brazilian population29. It comprises 19 items regarding seven sleep domains: subjective sleep quality, latency, duration, habitual sleep efficiency, use of sleep medications and daytime dysfunction over the past month. Total scores, ranging from 0 to 21, were summed, with higher scores reflecting poorer sleep quality.
The mean pain intensity over the last week was measured using the NPRS30; scores ranged from 0 (no pain) to 10 (the worst imaginable pain).
Functional disability was assessed using the Roland–Morris Disability Questionnaire, validated for the Brazilian population31. It comprises 24 items regarding the impact of low back pain on work-related and daily living activities. Scores ranged from 0 (no disability) to 24 (severe disability).
The prevalence of sleep complaints was assessed using the Sleep Complaints Questionnaire32. This tool comprises 15 sleep complaints categorised according to their frequency: less than one time per month, one time per month, 2–3 times per month, 1–2 times per week and more than three times per week. Answers were provided considering the moment of the interview.
Depressive symptoms were assessed using the Geriatric Depression Scale (GDS-15), validated for older adults33, comprising 15 items regarding the prevalence of depression symptoms and overall well-being. Scores range from 0 to 15; depression symptoms were identified at scores >5 points.
Continuous data were expressed as mean and standard deviation and categorical variables as absolute and relative frequencies. Univariate and multivariable linear regression models (six of each) were performed to investigate the main aim of this study. The analysis included 10–15 individuals per independent variable in the multivariable linear regression models34,35 to achieve 80% statistical power, considering an alpha of 0.05. The independent variables were OSA risk (Berlin Questionnaire), excessive daytime sleepiness (Epworth Sleepiness Scale) and sleep quality (PSQI) scores. The dependent variables were pain intensity and functional disability measurements (NPRS and Roland–Morris Disability Questionnaire scores, respectively). A sample size of 60–90 individuals was considered adequate for this study, considering the five additional covariates to adjust for in the multivariable models. The covariates were selected based on literature on the biopsychosocial factors that may affect CLBP and sleep (i.e., potential confounders of possible associations between both variables, such as age, BMI, number of comorbidities, depressive symptoms, sex and occupational status)36,37,38,39,40. The association between covariates and independent variables was performed to prevent collinearity problems (continuous variables were analysed using Spearman's rank correlation. When one of the variables was dichotomous (e.g., sex), differences were assessed using the Student's t-test). After running the models, possible collinearities among the covariates were identified using the tolerance test; values >0.10 indicated non-collinearity. All statistical analyses were conducted using the IBM SPSS Statistics software (version 21.0).
A total of 112 older adults were recruited from March 2022 to June 2023, and 100 were included in the final sample (Figure 1).
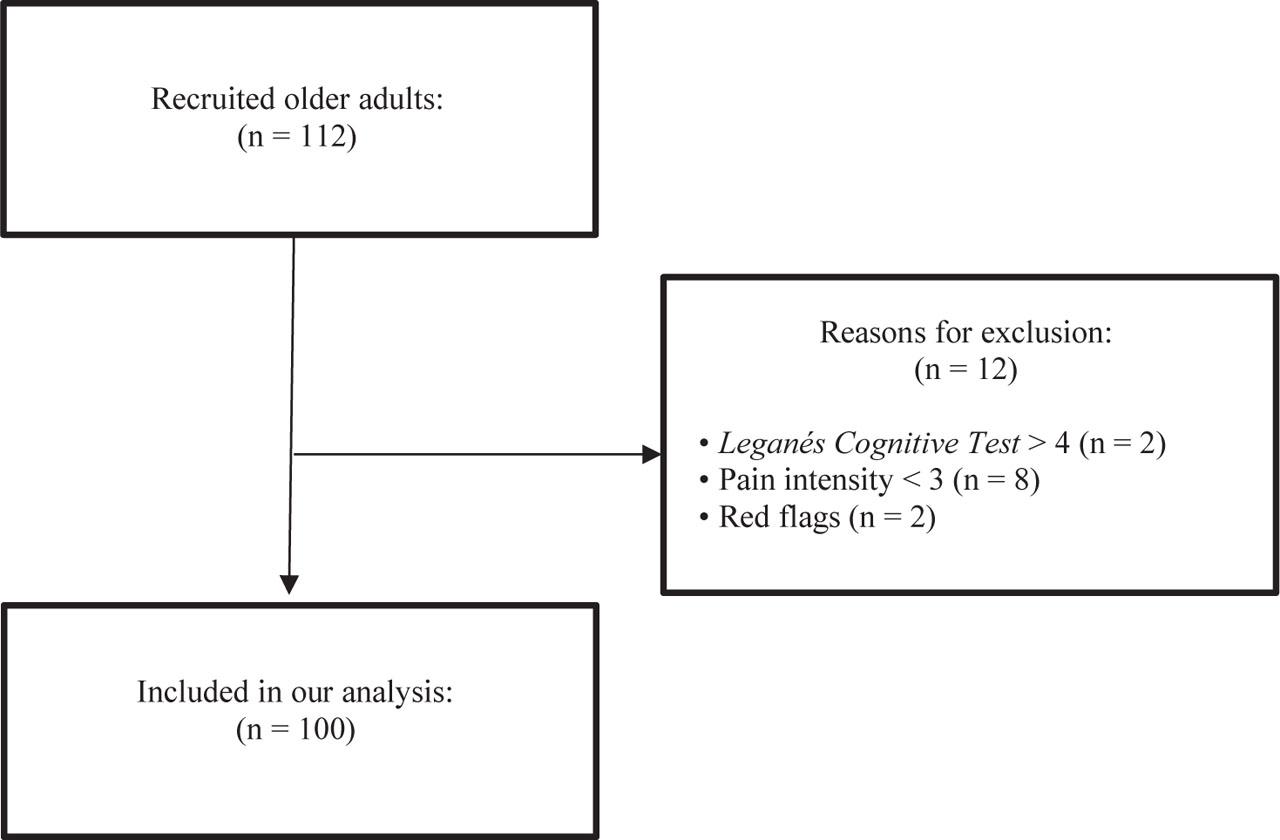
Flowchart of the inclusion process
The sample mean age was 69.8 ± 6.6 years, and most were female (69%). Only 36% had a high risk for OSA, a low likelihood of excessive daytime sleepiness (7.3 mean ± 5.0 SD) and poor sleep quality (8.54 mean ± 4.0 points SD [PSQI]), as shown in Table 1.
Demographic characteristics of the sample
| Characteristics | (n = 100) |
|---|---|
| Age (years) | 69.8 ± 6.6 |
| Female sex | 69 (69) |
| BMI | 27.3 ± 5.2 |
| Marital status | |
| Single | 22 (22) |
| Married | 45 (45) |
| Divorced | 18 (45) |
| Widower | 15 (15) |
| Education level | |
| Illiterate | 2 (2) |
| Primary school | 43 (43) |
| Secondary school | 40 (40) |
| University degree | 15 (15) |
| Occupational status | |
| Paid activity | 21 (21) |
| No paid activity | 79 (79) |
| CLBP duration (weeks) | |
| 12–23 | 6 (6) |
| 24–35 | 5 (5) |
| 36–52 | 6 (6) |
| >52 | 83 (83) |
| Practice of physical activity | |
| Yes | 39 (39) |
| No | 61 (61) |
| Medications in use (number) | 3.7 ± 2.5 |
| Use of sleep-inducing medications | 31 (31) |
| Total hours of sleep (per night) | 6.2 ± 1.6 |
| Pain intensity (0–10 points) | 7.6 ± 1.8 |
| Functional disability (0–24 points) | 13.3 ± 5.3 |
| OSA risk | |
| No risk | 12 (12) |
| Low risk | 50 (50) |
| High risk | 36 (36) |
| Excessive daytime sleepiness (0–24 points) | 7.3 ± 5.0 |
| Sleep quality (0–21 points) | 8.54 ± 4.0 |
| Depression symptoms (0–15 points) | 4.9 ± 4.1 |
| Comorbidities (total) | 5.5 ± 2.3 |
BMI - body mass index, CLBP - chronic low back pain, OSA - obstructive sleep apnoea.
Data expressed by mean ± standard deviation or frequency (percentage).
For the multivariable regression analysis, age, BMI, number of comorbidities, depressive symptoms and occupational status were included as covariates. Initially, sex was included in the models as a covariate, but due to multicollinearity (e.g., association with other covariates, including depressive symptoms, number of comorbidities) PSQI score and Berlin Questionnaire score [Student's t-test p < 0.05]), sex was not included in the final model. Therefore, sex was excluded to avoid possible collinearities. The results of the univariate and multivariable linear regression analyses are demonstrated in Tables 2–4.
Results of univariate linear regressions and multivariable linear regressions between the risk of OSA (independent variable) and pain intensity and functional disability (dependent variables)
| Pain intensity (NPRS) | Functional disability (Roland–Morris Disability Questionnaire) | ||||||
|---|---|---|---|---|---|---|---|
| Independent variables: OSA risk (Berlin Questionnaire); dependent variables: pain intensity (NPRS) and functional disability (Roland–Morris Disability Questionnaire); covariates: age, depressive symptoms (GDS-15), BMI, occupational status, comorbidities number. | |||||||
| R2 (adjusted R2), % | Coefficient β (CI 95%) | p value | R2 (adjusted R2), % | Coefficient β (CI 95%) | p value | ||
| Univariate linear regression model | Univariate linear regression model | ||||||
| (constant) | 9.1 (8.1) | 6.72 (6.00–7.43) | 0.00 | (constant) | 10.7 (9.8) | 10.19 (8.12–12.26) | 0.00 |
| OSA risk (Berlin Questionnaire) | 0.30 (0.16–0.72) | 0.00a | OSA risk (Berlin Questionnaire) | 0.33 (0.20–0.75) | 0.00a | ||
| Multivariable linear regression model | Multivariable linear regression model | ||||||
| (constant) | 16.5 (11.1) | 2.72 (−1.98 to 7.42) | 0.25 | (constant) | 47.2 (43.8) | 0.13 (−10.86 to 11.12) | 0.98 |
| Age | 0.09 (−0.10 to 0.28) | 0.36 | Age | −0.02 (−0.17 to 0.14) | 0.83 | ||
| Depressive symptoms (GDS-15) | 0.19 (−0.01 to 0.40) | 0.06 | Depressive symptoms (GDS-15) | 0.52 (0.35–0.67) | 0.00a | ||
| BMI | 0.13 (−0.08 to 0.33) | 0.22 | BMI | 0.25 (0.09–0.41) | 0.00a | ||
| Occupational status | 0.12 (−0.07 to 0.31) | 0.20 | Occupational status | 0.07 (−0.08 to 0.22) | 0.38 | ||
| Comorbidities number | 0.07 (−0.14 to 0.28) | 0.53 | Comorbidities number | 0.16 (−0.01 to 0.33) | 0.06 | ||
| OAS risk (Berlin Questionnaire) | 0.19 (−0.03 to 0.59) | 0.07 | OSA risk (Berlin Questionnaire) | 0.05 (−0.17 to 0.32) | 0.53 | ||
BMI - body mass index, GDS-15 - geriatric depression scale, NPRS - numerical pain rating scale, OSA - obstructive sleep apnoea.
Effect size (β): 0.10–0.29 = small; 0.30–0.49 = moderate; ≥ 0.50 = strong.
- Statistically significant.
Results of univariate linear regressions and multivariable linear regressions between excessive daytime sleepiness (independent variable) and pain intensity and functional disability (dependent variables)
| Pain intensity (NPRS) | Functional disability (Roland–Morris Disability Questionnaire) | ||||||
|---|---|---|---|---|---|---|---|
| Independent variables: excessive daytime sleepiness; dependent variables: pain intensity (NPRS) and functional disability (Roland–Morris Disability Questionnaire); covariates: age, depressive symptoms (GDS-15), BMI, occupational status, comorbidities number. | |||||||
| R2 (adjusted R2), % | Coefficient β (CI 95%) | p value | R2 (adjusted R2), % | Coefficient β (CI 95%) | p value | ||
| Univariate linear regression model | Univariate linear regression model | ||||||
| (constant) | 0.00 (−0.01) | 7.72 (7.01–8.37) | 0.00 | (constant) | 11.3 (10.4) | 10.60 (8.82–12.44) | 0.00 |
| Excessive daytime sleepiness (Epworth sleepiness scale) | −0.02 (−0.22 to 0.18) | 0.84 | Excessive daytime sleepiness (Epworth sleepiness scale) | 0.34 (0.15−0.53) | 0.00a | ||
| Multivariable linear regression model | Multivariable linear regression model | ||||||
| (constant) | 18.2 (12.8) | 1.61 (−3.09 to 6.32) | 0.50 | (constant) | 48.4 (45.0) | 0.40 (−10.65 to 11.45) | 0.94 |
| Age | 0.12 (−0.07 to 0.31) | 0.22 | Age | −0.02 (−0.17 to 0.14) | 0.83 | ||
| Depressive symptoms (GDS-15) | 0.28 (0.07–0.47) | 0.01a | Depressive symptoms (GDS-15) | 0.52 (0.36–0.68) | 0.00a | ||
| BMI | 0.23 (0.03–0.43) | 0.02 | BMI | 0.24 (0.08–0.40) | 0.00a | ||
| Occupational status | 0.15 (−0.04 to 0.34) | 0.12 | Occupational status | 0.06 (−0.09 to 0.21) | 0.44 | ||
| Comorbidities number | 0.16 (−0.05 to 0.37) | 0.14 | Comorbidities number | 0.14 (−0.02 to 0.31) | 0.09 | ||
| Excessive daytime sleepiness (Epworth sleepiness scale) | −0.21 (−0.42 to −0.01) | 0.04 | Excessive daytime sleepiness (Epworth sleepiness scale) | 0.10 (−0.06 to 0.27) | 0.23 | ||
BMI - body mass index, GDS-15 - geriatric depression scale, NPRS - numerical pain rating scale.
Effect size (β): 0.10–0.29 = small; 0.30–0.49 = moderate; ≥0.50 = strong.
- Statistically significant.
Results of univariate linear regressions and multivariable linear regressions between sleep quality (independent variable) and pain intensity and functional disability (dependent variables)
| Pain intensity (NPRS) | Functional disability (Roland–Morris Disability Questionnaire) | ||||||
|---|---|---|---|---|---|---|---|
| Independent variables: Sleep Quality (PSQI); dependent variables: pain intensity (NPRS) and functional disability (Roland–Morris Disability Questionnaire); | |||||||
| R2 (Adjusted R2), % | Coefficient β (CI 95%) | p value | R2 (Adjusted R2), % | Coefficient β (CI 95%) | p value | ||
| Univariate linear regression model | Univariate linear regression model | ||||||
| (constant) | 8.0 (7.0) | 6.59 (5.76–7.41) | 0.00 | (constant) | 28.8 (28.1) | 7.14 (4.99–9.28) | 0.00 |
| Sleep quality (PSQI) | 0.28 (0.09–0.47) | 0.00a | Sleep quality (PSQI) | 0.54 (0.37–0.71) | 0.00a | ||
| Multivariable linear regression model | Multivariable linear regression model | ||||||
| (constant) | 15.5 (10.0) | 2.21 (−2.55 to 6.97) | 0.36 | (constant) | 51.0 (47.8) | −1.65 (−12.30 to 9.00) | 0.76 |
| Age | 0.09 (−0.10 to 0.29) | 0.34 | Age | −0.01 (−0.16 to 0.14) | 0.88 | ||
| Depressive symptoms (GDS-15) | 0.15 (−0.08 to 0.38) | 0.20 | Depressive symptoms | 0.41 (0.23–0.58) | 0.00a | ||
| BMI | 0.16 (−0.04 to 0.36) | 0.12 | BMI | 0.24 (0.08 to 0.39) | 0.00a | ||
| Occupational status | 0.14 (−0.05 to 0.34) | 0.15 | Occupational status | 0.10 (−0.04 to 0.25) | 0.16 | ||
| Comorbidities number | 0.09 (−0.12 to 0.30) | 0.41 | Comorbidities number | 0.14 (−0.02 to 0.30) | 0.09 | ||
| Sleep quality (PSQI) | 0.17 (−0.06 to 0.41) | 0.15 | Sleep quality (PSQI) | 0.25 (0.07–0.43) | 0.01a | ||
BMI - body mass index, GDS-15 - geriatric depression scale, NPRS - numerical pain rating scale, PSQI - Pittsburgh sleep quality index.
Effect size (β): 0.10–0.29 = small; 0.30–0.49 = moderate; ≥0.50 = strong.
- Statistically significant.
The univariate linear regression showed that the risk of OSA increased the pain intensity by 0.3 points (95% confidence interval [95% CI]: 0.16–0.72). However, this association did not remain in the multivariable linear regression (β = 0.19 [95%CI: −0.03 to 0.59]). Regarding functional disability, the univariate linear regression showed that the increase in the risk of OSA increased the Roland–Morris Disability Questionnaire score by 0.33 points (95%CI: 0.20–0.75); however, this association was not significant in the multivariable regression (β = 0.05 [95%CI: −0.17 to 0.32]). These findings suggest that the apparent effect of OSA risk on pain intensity and disability may be more strongly confounded and influenced by depressive symptoms and BMI, rather than by OSA risk self.
The univariate linear regression did not find an association between excessive daytime sleepiness and intensity (β = −0.02 [95%CI: −0.22 to 0.18]). Conversely, these variables were negatively associated in the multivariable linear regression; when ESD increased by 1 point, pain intensity reduced by 0.21 (β = −0.21 [95%CI: −0.42 to −0.01]). Although statistically significant, the effect size is small, and the clinical meaning is uncertain. Furthermore, functional disability was positively associated with excessive daytime sleepiness in the univariate linear regression; each 1-point increase in excessive daytime sleepiness increased the Roland–Morris Disability Questionnaire score by 0.34 (95%CI: 0.15–0.53). This finding suggests a moderate positive association between higher risk and greater functional disability. However, these variables were not significantly associated in the multivariable linear regression (β = 0.10 [95% CI: −0.06 to 0.27]), suggesting that the apparent effect of excessive daytime sleepiness on disability may be confounded by variables such as depressive symptoms and BMI.
The univariate linear regression found an association between sleep quality and pain intensity; each 1-point increase in the PSQI resulted in a 0.28-point increase in pain intensity (β = 0.28 ([95%CI: 0.09–0.47]); however, these variables were not significantly associated in the multivariable linear regression (β = 0.17 [95%CI: −0.06 to 0.41]). Moreover, the univariate linear regression found an association between sleep quality and functional disability; each 1-point increase in the PQSI resulted in a 0.54 increase in the Roland–Morris Disability Questionnaire score (β = 0.54 [95%CI: 0.37–0.71]). This represents a strong effect, indicating that poor sleep quality substantially worsens functional outcomes. In the multivariable linear regression, this association remained but with decreased values; a 1-point increase in PSQI increased the Roland–Morris Disability Questionnaire score by 0.25 (β = 0.25 [95%CI: 0.07–0.43]), suggesting that poor sleep quality continues to influence the increase in disability, even after adjustment for potential confounders.
The prevalence of sleep complaints is described in Table 5. Almost all individuals (96%) reported at least one sleep complaint. The most prevalent were nocturnal awakening (76%), snoring (57%) and insufficient sleep (waking up tired; 55%). Additionally, the nocturnal awakening was reported by 76%, and 55% of them experienced it more than three times per week.
Prevalence of sleep complaints (n = 100)
| Sleep complaints | ‘Do you have any of the following problems during sleep?’, n (%) | ‘How frequent is the problem?’, n (%) | ||||
|---|---|---|---|---|---|---|
| Less than once a month | Once a month | 2–3 times a month | 1–2 times a week | 3 or more times a week | ||
| Any sleep complaint | 96 (96)a | - | - | - | - | - |
| Insufficient sleep | 55 (55)a | 4 (4) | 3 (3) | 3 (3) | 17 (17) | 28 (28) |
| Snoring | 57 (57)a | 5 (5) | 2 (2) | 5 (5) | 13 (13) | 32 (32) |
| Insomnia | 53 (53) | 4 (4) | 8 (8) | 5 (5) | 9 (9) | 27 (27) |
| Excessive daytime sleepiness | 31 (31) | 1 (1) | 3 (3) | 3 (3) | 10 (10) | 14 (14) |
| Nocturnal awakening | 76 (76)a | 6 (6) | 1 (1) | 3 (3) | 11 (11) | 55 (55)a |
| Breath complaints | 23 (23) | 4 (4) | 3 (3) | 4 (4) | 2 (2) | 10 (10) |
| Move a lot during sleep | 49 (49) | 1 (1) | 1 (1) | 0 (0) | 10 (7) | 37 (37) |
| Kick legs | 33 (33) | 3 (3) | 1 (1) | 0 (0) | 5 (5) | 24 (24) |
| Sleep-talking | 19 (19) | 4 (4) | 4 (4) | 3 (3) | 3 (3) | 5 (5) |
| Nightmare | 41 (41) | 9 (9) | 12 (12) | 6 (6) | 11 (11) | 3 (3) |
| Bruxism | 31 (31) | 3 (3) | 8 (8) | 4 (4) | 1 (1) | 15 (15) |
| Sleepwalking | 0 (0) | 0 (0) | 0 (0) | 0 (0) | 0 (0) | 0 (0) |
| Other complaints | 5 (5) | - | - | - | - | - |
- Most prevalent.
The present study highlighted that the most robust association was between sleep quality and functional disability, even after adjusting for potential confounders. Despite some gaps in the literature, some studies verified the relationship between sleep quality and functional disability in older adults with CLBP. França et al.41 found a high prevalence of sleep disorders in adults with CLBP and an association between poor sleep quality and increased functional disability, corroborating our results. Similarly, Oliveira et al.42 described the association between poor sleep quality and worse prognostics of functional disability in older adults. Although the mechanism linking sleep quality and functional disability remains unclear, the literature highlights physical activity as a protective factor for the latter43. Considering that the majority of individuals in our sample did not practice physical activity, this may be one of the factors that influenced this result.
The functional disability can also be influenced by the quantity of sleep. Machado et al.44 showed that older adults with shorter total sleep-time exhibited increased functional disability. Similarly, Parsey et al.45 observed that healthy older adults who needed sleep-time from 8–9 hours per night but only slept 5 hours presented increased functional disability. Current guidelines46 recommend that older adults sleep an average of 7–8 hours per night so that they can derive health benefits; However, the elderly in our sample are sleeping less than recommended. Furthermore, sleep quality can be influenced by the number of comorbidities. Foley et al.23 demonstrated that older adults with four or more associated comorbidities reported poorer sleep quality, a similar number to that found in our sample.
Sleep quality was also significantly associated with pain intensity; however, the association was not maintained in the multivariable linear regression. Other studies have reported robust findings on this association, but they have focused on the adult population. Alsaadi et al.7, for example, observed that sleep quality significantly influenced the pain intensity on the following day in middle-aged adults, regardless of factors (e.g., depression and anxiety). Furthermore, sleep fragmentation also appears to influence musculoskeletal hypersensitivity and spontaneous pain in women47. Night waking was the most frequent sleep complaint reported by our sample, and this may also be one of the factors that influenced the result found. In contrast, Morelhão et al.48 found no association between waking up and feeling pain in the morning and sleep quality in Brazilian older adults. However, feeling pain at night was associated with sleep quality. The adjusted covariates did not influence the association between sleep quality and pain intensity; therefore, other factors could justify this association, such as sedentary behaviour49, smoking and alcohol consumption40. However, these factors were not evaluated by us.
The present study showed that the risk of OSA was associated with pain intensity and functional disability but only in univariate analysis. Previous studies did not investigate this association in older adults with CLBP. In a study of patients with chronic pain in general, no significant association was found between OSA and pain intensity, but a prevalence of 41.7% of individuals at high risk for OSA was identified using the Berlin Questionnaire50 (similar to the prevalence found by our study). Our results may be underestimated because older adults have a poor perception of OSA symptoms51, hindering self-reporting.
Using polysomnography to diagnose OSA in women, Aytekin et al.52 found a prevalence of 55.4% of generalised chronic pain associated with disorders, but in addition to not finding specific associations with pain intensity, no association with functional disability was also observed, although women with high BMI had greater functional disability compared to men of the same category.
Although the mechanism between OSA and pain is unclear, studies suggest that continuous positive airway pressure, the gold standard treatment for OSA, can modulate pain intensity. Onen et al.53 observed that continuous positive airway pressure with higher parameters increased pain tolerance induced in older adults. Additionally, this treatment seems to reduce the need for opioid analgesics and helps to predict drug sensitivity in individuals admitted to intensive20. However, these results cannot be generalised to individuals with OSA and CLBP due to a lack of scientific evidence.
In the present study, excessive daytime sleepiness and pain intensity were negatively associated. However, higher Epworth Sleepiness Scale and NPRS scores indicate more excessive daytime sleepiness and pain, respectively, and a higher sleepiness could not result in less pain intensity. However, the negative association (excessive daytime sleepiness and pain intensity) was also observed in another study. For instance, excessive daytime sleepiness and pain intensity (musculoskeletal) were negatively correlated in a multi-age group of rural workers54. Smith et al.18 described an association between mechanical hypoalgesia and sleep-disordered breathing (e.g., mild OSA with excessive daytime sleepiness) as a symptom in individuals with temporomandibular pain. However, the inverse relationship between these variables is not yet understood. Furthermore, not every individual with musculoskeletal pain and OSA would present sleepiness identified by the Epworth Sleepiness Scale55. However, the influence of other factors on this finding can be hypothesised. For instance, one possibility is the effect of medications, such as sleep inducers, which may simultaneously increase sleepiness and attenuate pain perception56. Another explanation is that individuals experiencing higher levels of sleepiness might overestimate pain intensity due to reduced alertness, attention or recall57.
We found an association between excessive daytime sleepiness and functional disability but only in the univariate analysis. The studies by Park et al.58 and Foley et al.59 corroborate ours, observing that older adults with difficulty staying awake have increased functional incapacity to carry out activities of daily living. The pathological mechanism between excessive daytime sleepiness and functional disability remains unclear, but evidence showed that associations with sedentary behaviour and low daytime physical activity levels may lead to functional decline60. However, the association between excessive daytime sleepiness and functional disability did not persist in the multivariable linear regression in the present study, and functional disability was influenced by sample BMI and depressive symptoms, corroborating previous studies38,61.
In the present study, 96% of the older adults presented at least one sleep complaint, with nocturnal awakening being the most frequent. Roberts and Drummond (2015)50 also described a high prevalence of sleep complaints in multi-age individuals with chronic pain (84.3%), with insomnia being the most frequent complaint. Similarly, McCracken and Iverson (2001)62 found a prevalence of 88.9% of at least one sleep complaint in middle-aged adults with chronic pain, with the most frequent complaint being less sleep at night. Although in a different population, a recent systematic review identified high rates of sleep disorders among institutionalised older adults, with the most prevalent being OSA (67%), poor sleep quality (65%) and insomnia (43%)63. These findings suggest that individuals with chronic pain disorders may generally experience multiple sleep complaints, potentially associated with age or other comorbidities. Additionally, these complaints may be part of a primary sleep disorder; therefore, early diagnosis is crucial for proper treatment.
However, the high prevalence of sleep complaints found in this study may be partly explained by the instrument used and the cross-sectional design. The Sleep Complaints Questionnaire32 included a wide range of symptoms, which increases sensitivity to detect complaints but may also overestimate prevalence when compared to stricter diagnostic or objective measures64. In addition, the cross-sectional design captures self-reported sleep problems at a single time point, without considering their persistence or clinical severity. Even so, this approach reflects the subjective experience of older adults, which is relevant given the potential impact of sleep on CLBP. Considering the bidirectional relationship between sleep and pain, the correct treatment for sleep disorder would potentially decrease the pain intensity and functional disability related to CLBP, both in community-dwelling and in institutionalised older adults.
One of the strengths of this study is the pioneering effort to assess the risk of OSA and excessive daytime sleepiness, pain intensity and functional disability in older adults with CLBP. However, some limitations were identified. First, the variable ‘sex’ was not adjusted in the multivariable linear regression to prevent collinearities, although other important potential confounders were adjusted for in our multivariable models. Although debatable, pain perception is susceptible to the effects of sexual hormones. In this case, women seem to present higher nociceptive sensitivity than men. Additionally, we acknowledge that polysomnography is the gold standard for assessing OSA; however, we used a tool that is more feasible to use in the context of our population of interest (i.e., older adults seeking treatment for CLBP). Finally, our study had a cross-sectional design, which does not allow us to make causal assumptions.
This study highlights a robust association between poor sleep quality and functional disability in older adults with CLBP. Importantly, our findings also suggest that chronic pain itself negatively affects sleep quality. The high prevalence of sleep complaints underscores the need for routine screening and targeted interventions for sleep problems in this population. Addressing sleep complaints may contribute to reducing pain and disability and to decreasing the economic burden on healthcare systems.