
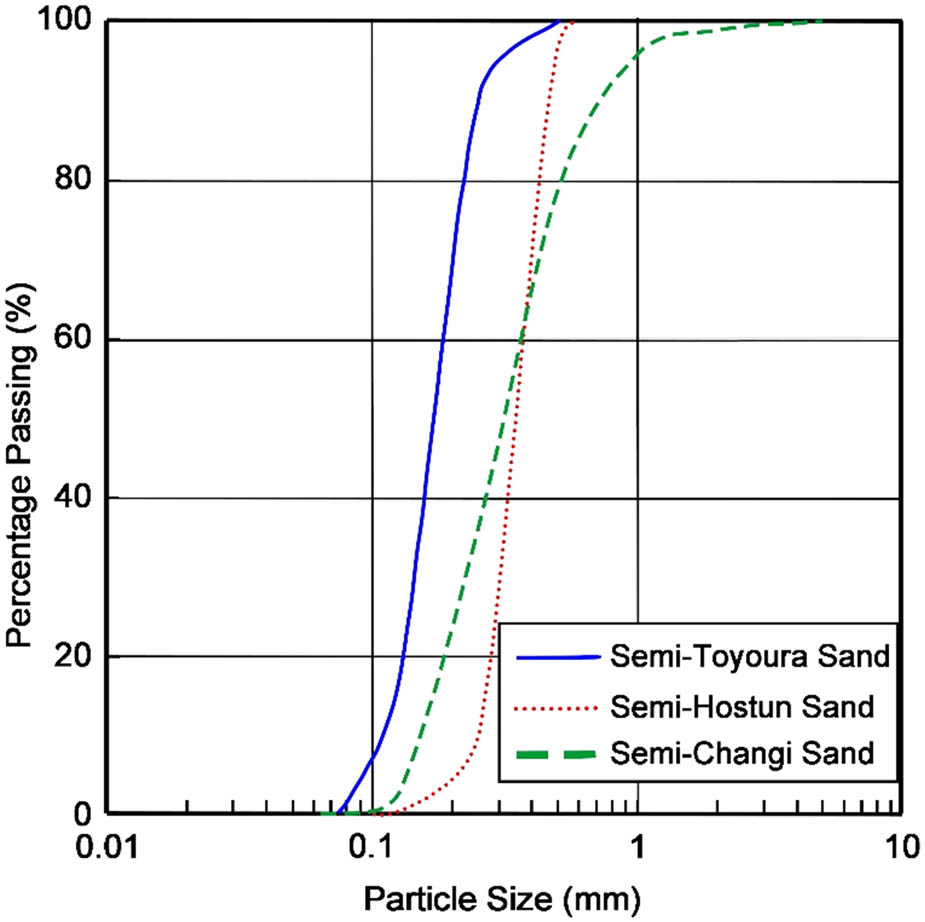
Figure 1
Grading curves of the tested sands.
Source: Author’s contribution.
Table 1
Geotechnical properties of the tested sand
| Properties | Units | Semi-Toyoura | Semi-Hostun | Semi-Changi |
|---|---|---|---|---|
| D 10 | (mm) | 0.101 | 0.246 | 0.145 |
| D 30 | (mm) | 0.141 | 0.293 | 0.22 |
| D 50 | (mm) | 0.171 | 0.343 | 0.313 |
| D 60 | (mm) | 0.188 | 0.372 | 0.368 |
| Specific gravity, G s | (–) | 2.65 | 2.65 | 2.65 |
| Maximum dry density, | (g/cm3) | 1.695 | 1.695 | 1.736 |
| Optimum moisture content, w opt | (%) | 13.4 | 13 | 13 |
| Minimum void ratio, e min | (–) | 0.509 | 0.518 | 0.464 |
| Maximum void ratio, e max | (–) | 0.889 | 0.787 | 0.763 |
| Coefficient of curvature, C c | (–) | 1.047 | 0.938 | 0.907 |
| Coefficient of uniformity, C u | (–) | 1.861 | 1.512 | 2.538 |
Source: Author’s contribution.
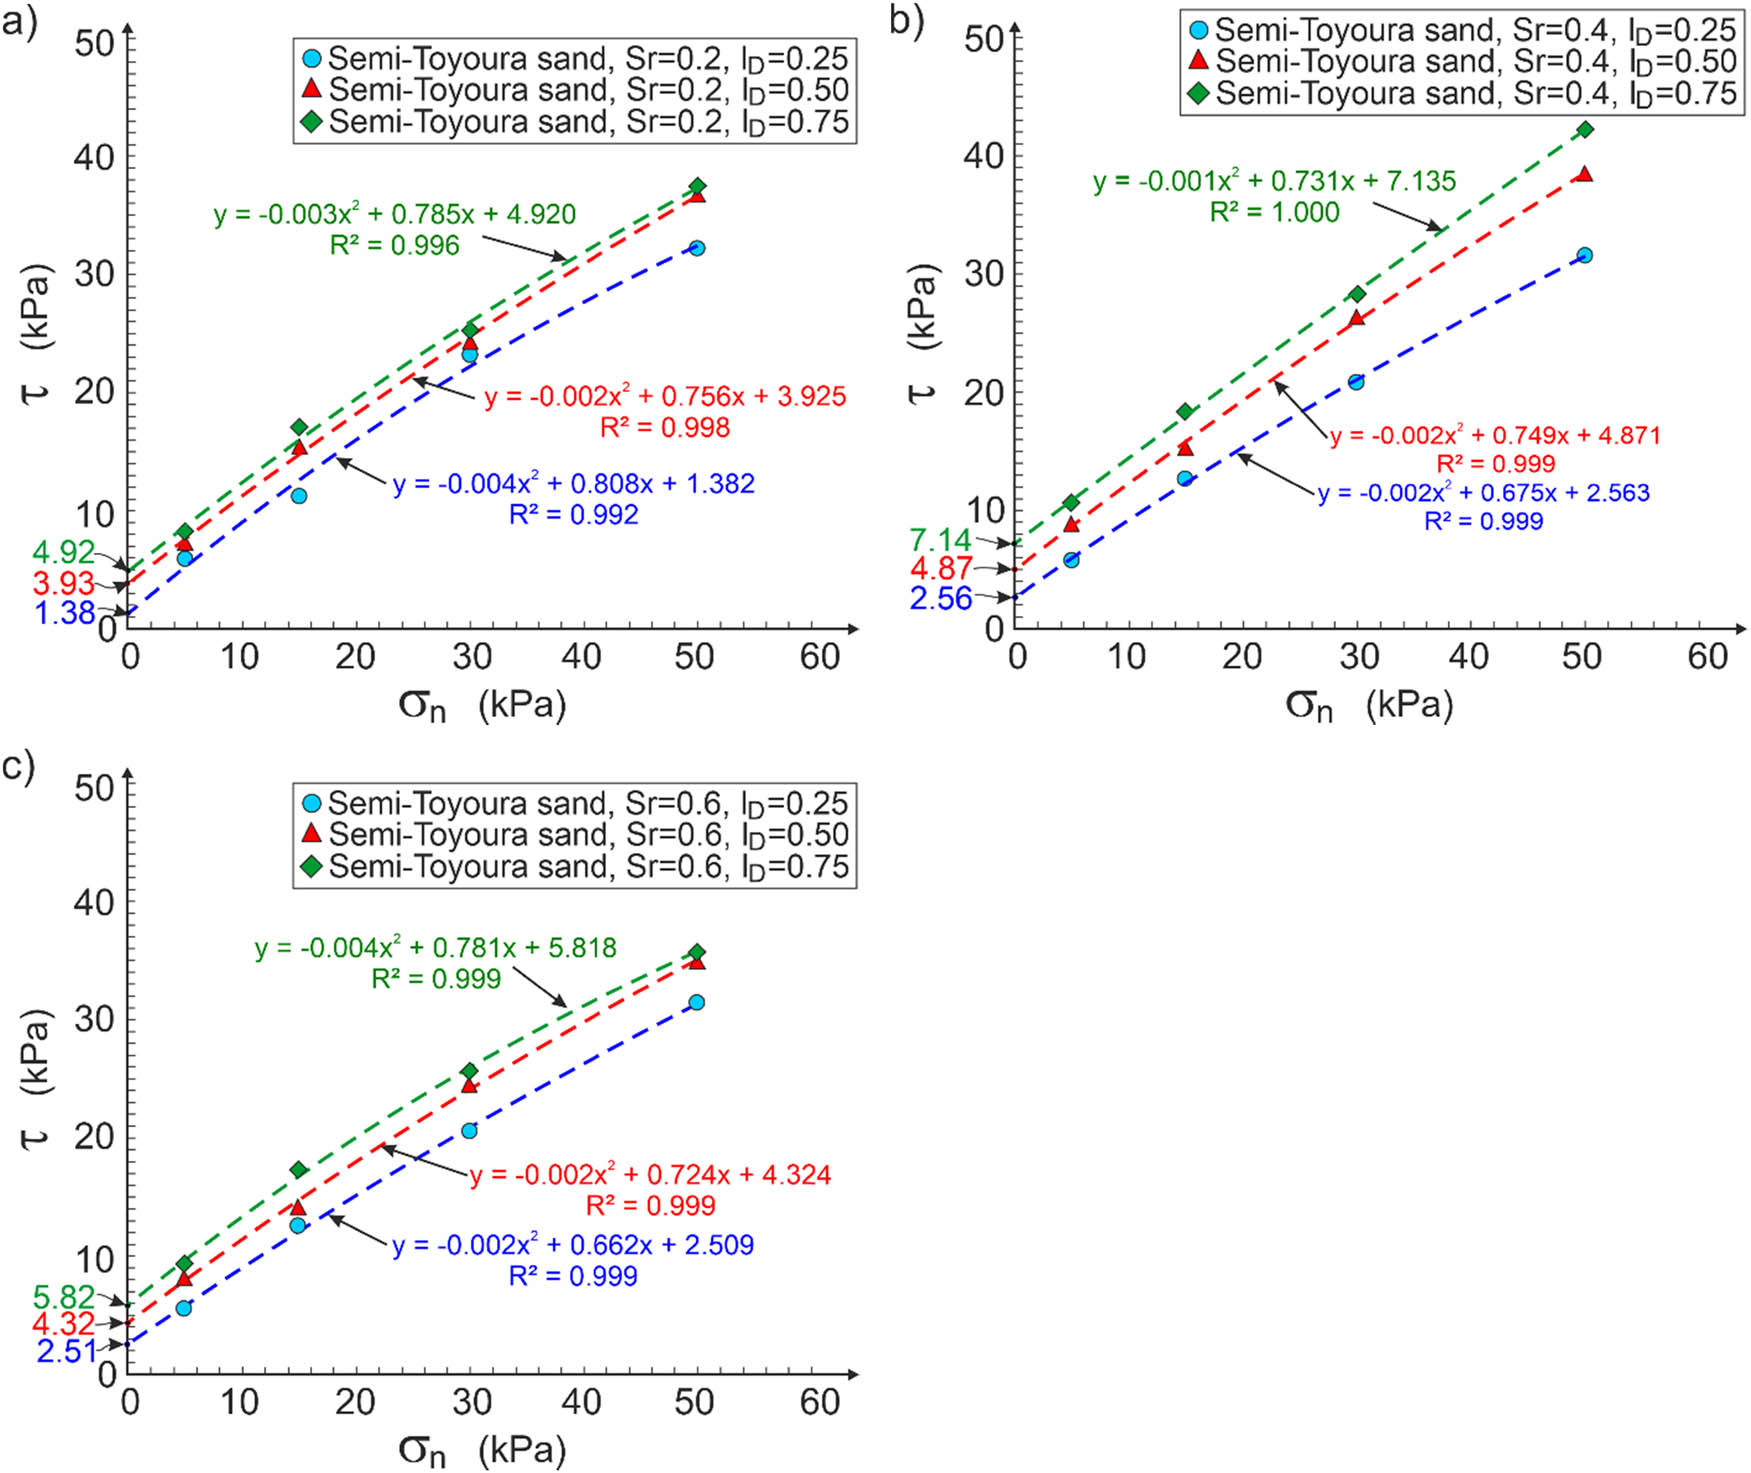
Figure 2
Apparent cohesion of semi-Toyoura sand for different saturation degrees: (a) S r = 0.2; (b) S r = 0.4; and (c) S r = 0.6.
Source: Author’s contribution.
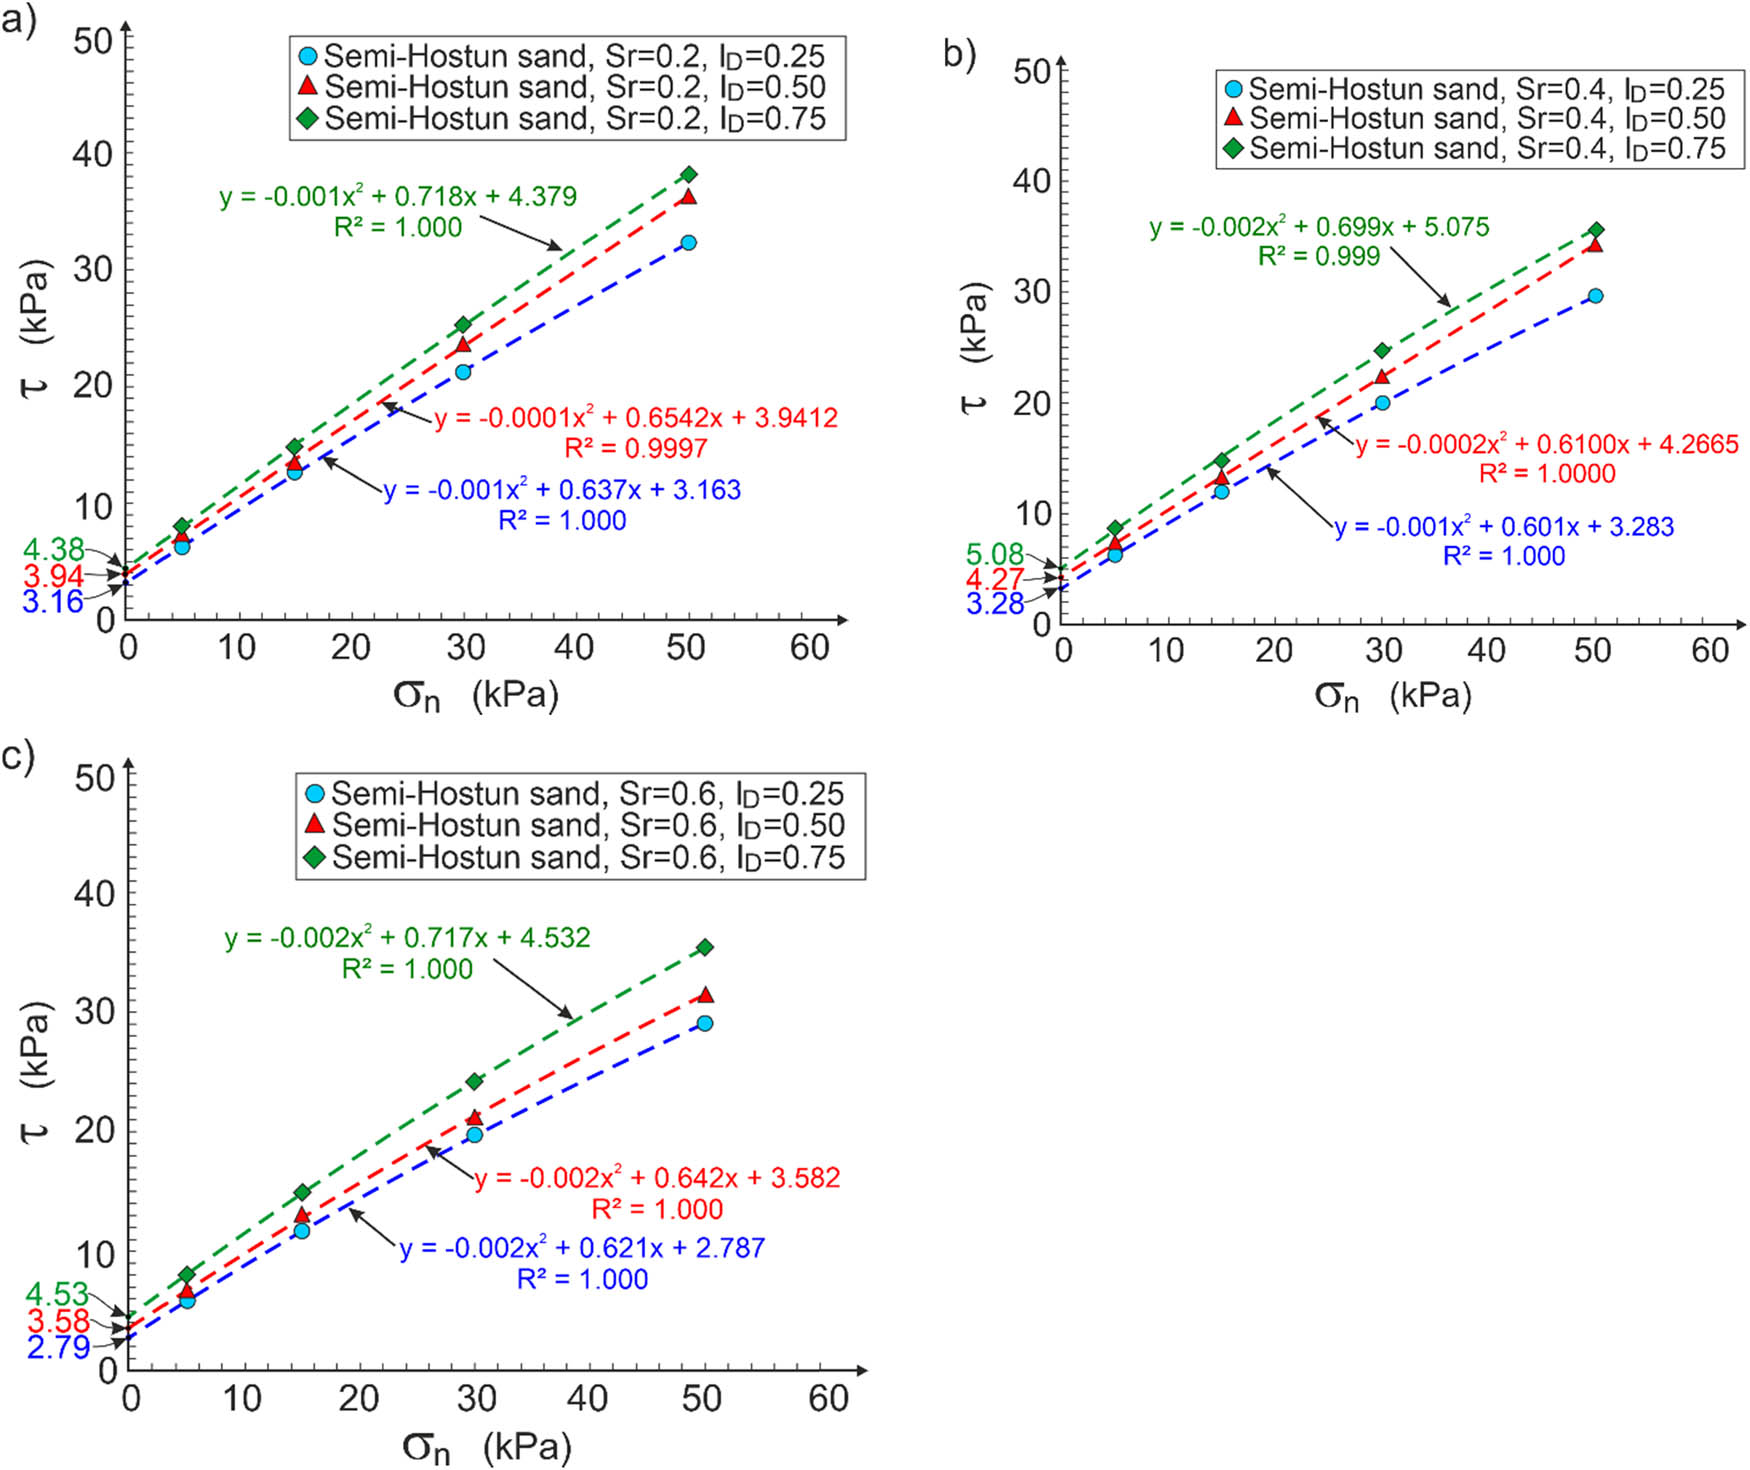
Figure 3
Apparent cohesion of semi-Hostun sand for different saturation degrees: (a) S r = 0.2; (b) S r = 0.4; and (c) S r = 0.6.
Source: Author’s contribution.
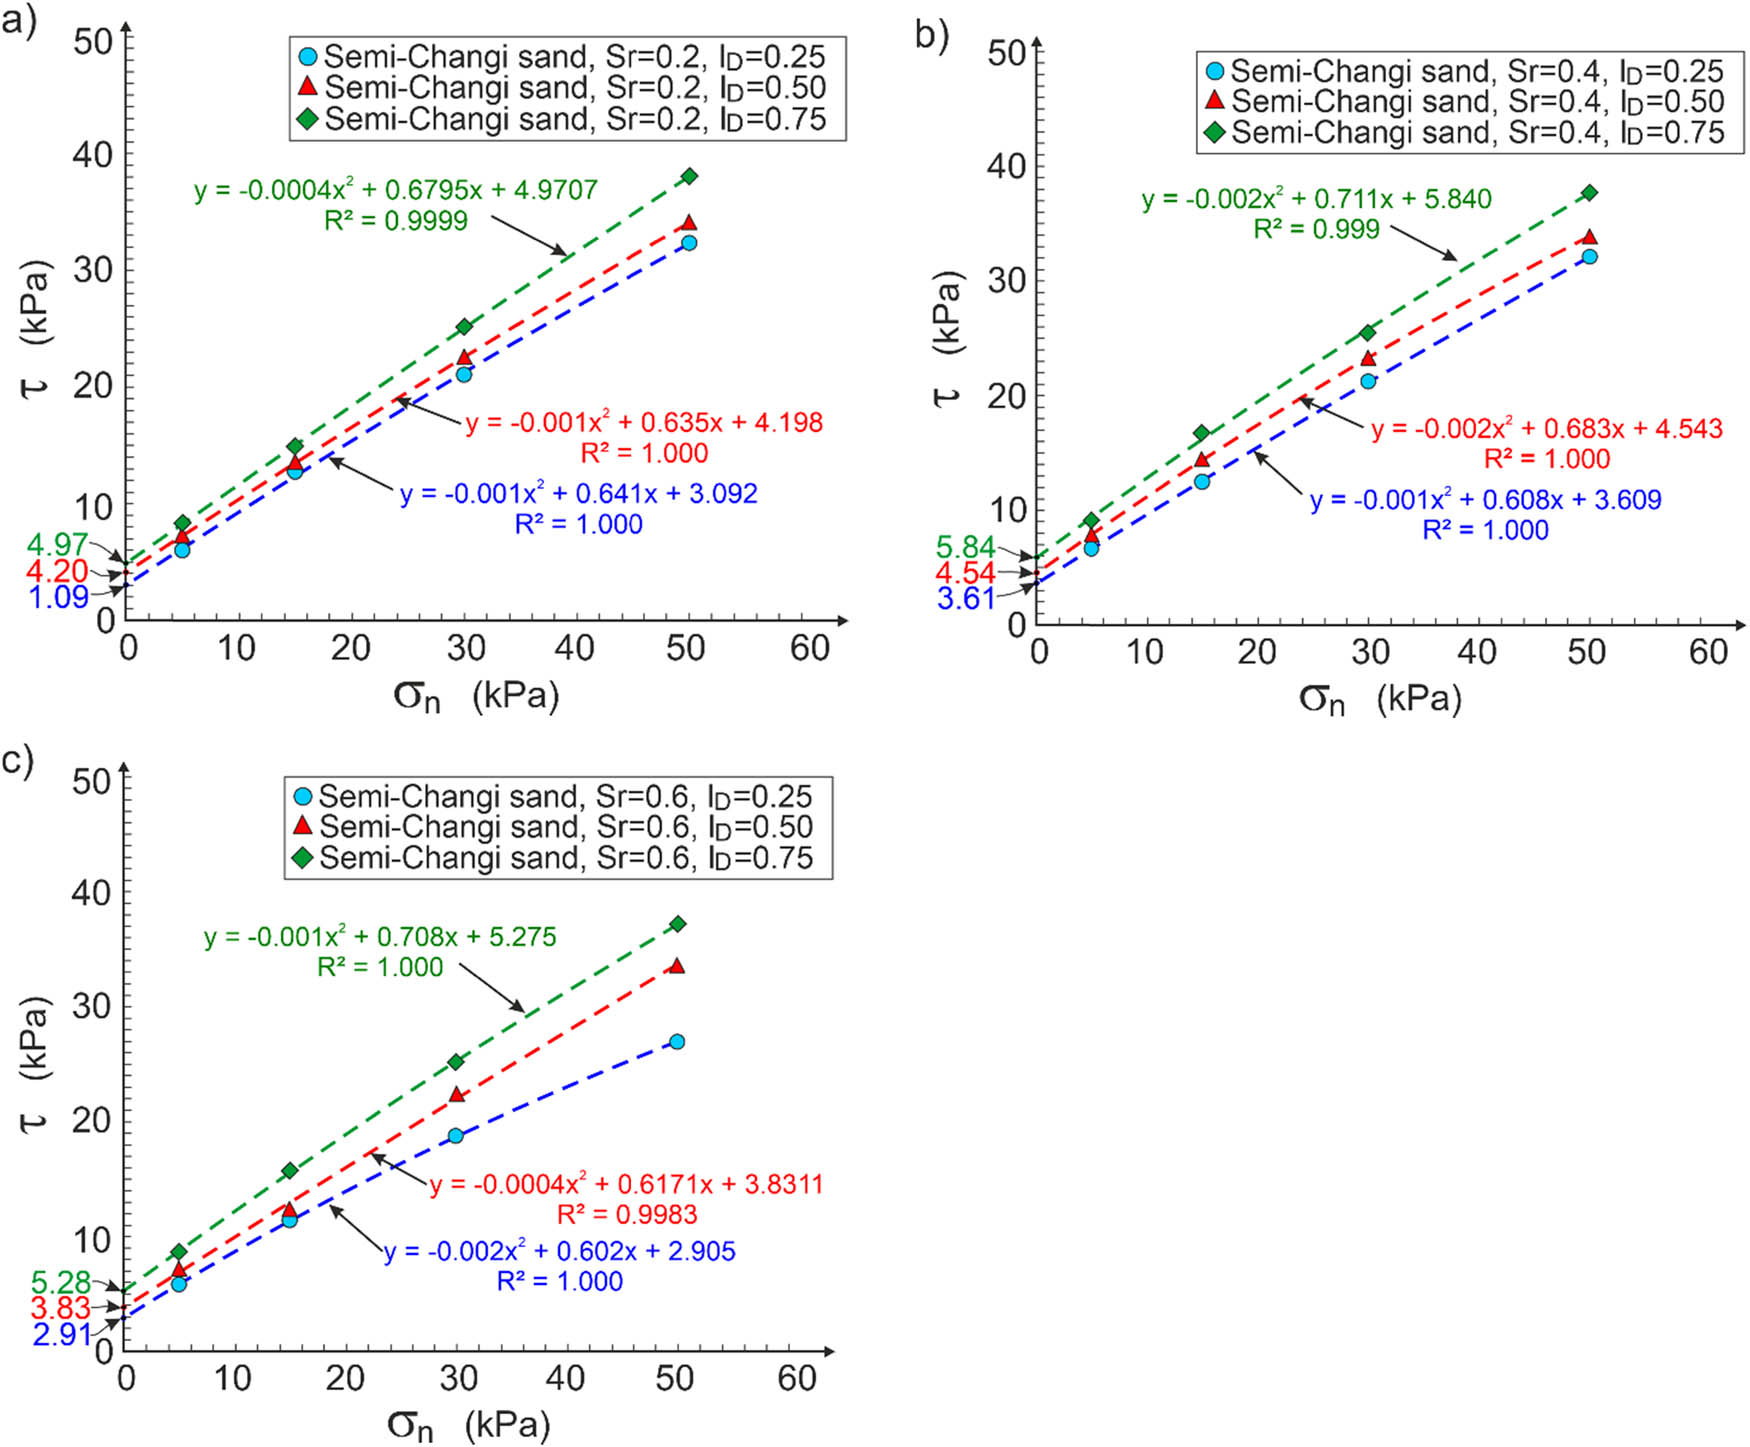
Figure 4
Apparent cohesion of semi-Changi sand for different saturation degrees: (a) S r = 0.2; (b) S r = 0.4; and (c) S r = 0.6.
Source: Author’s contribution.
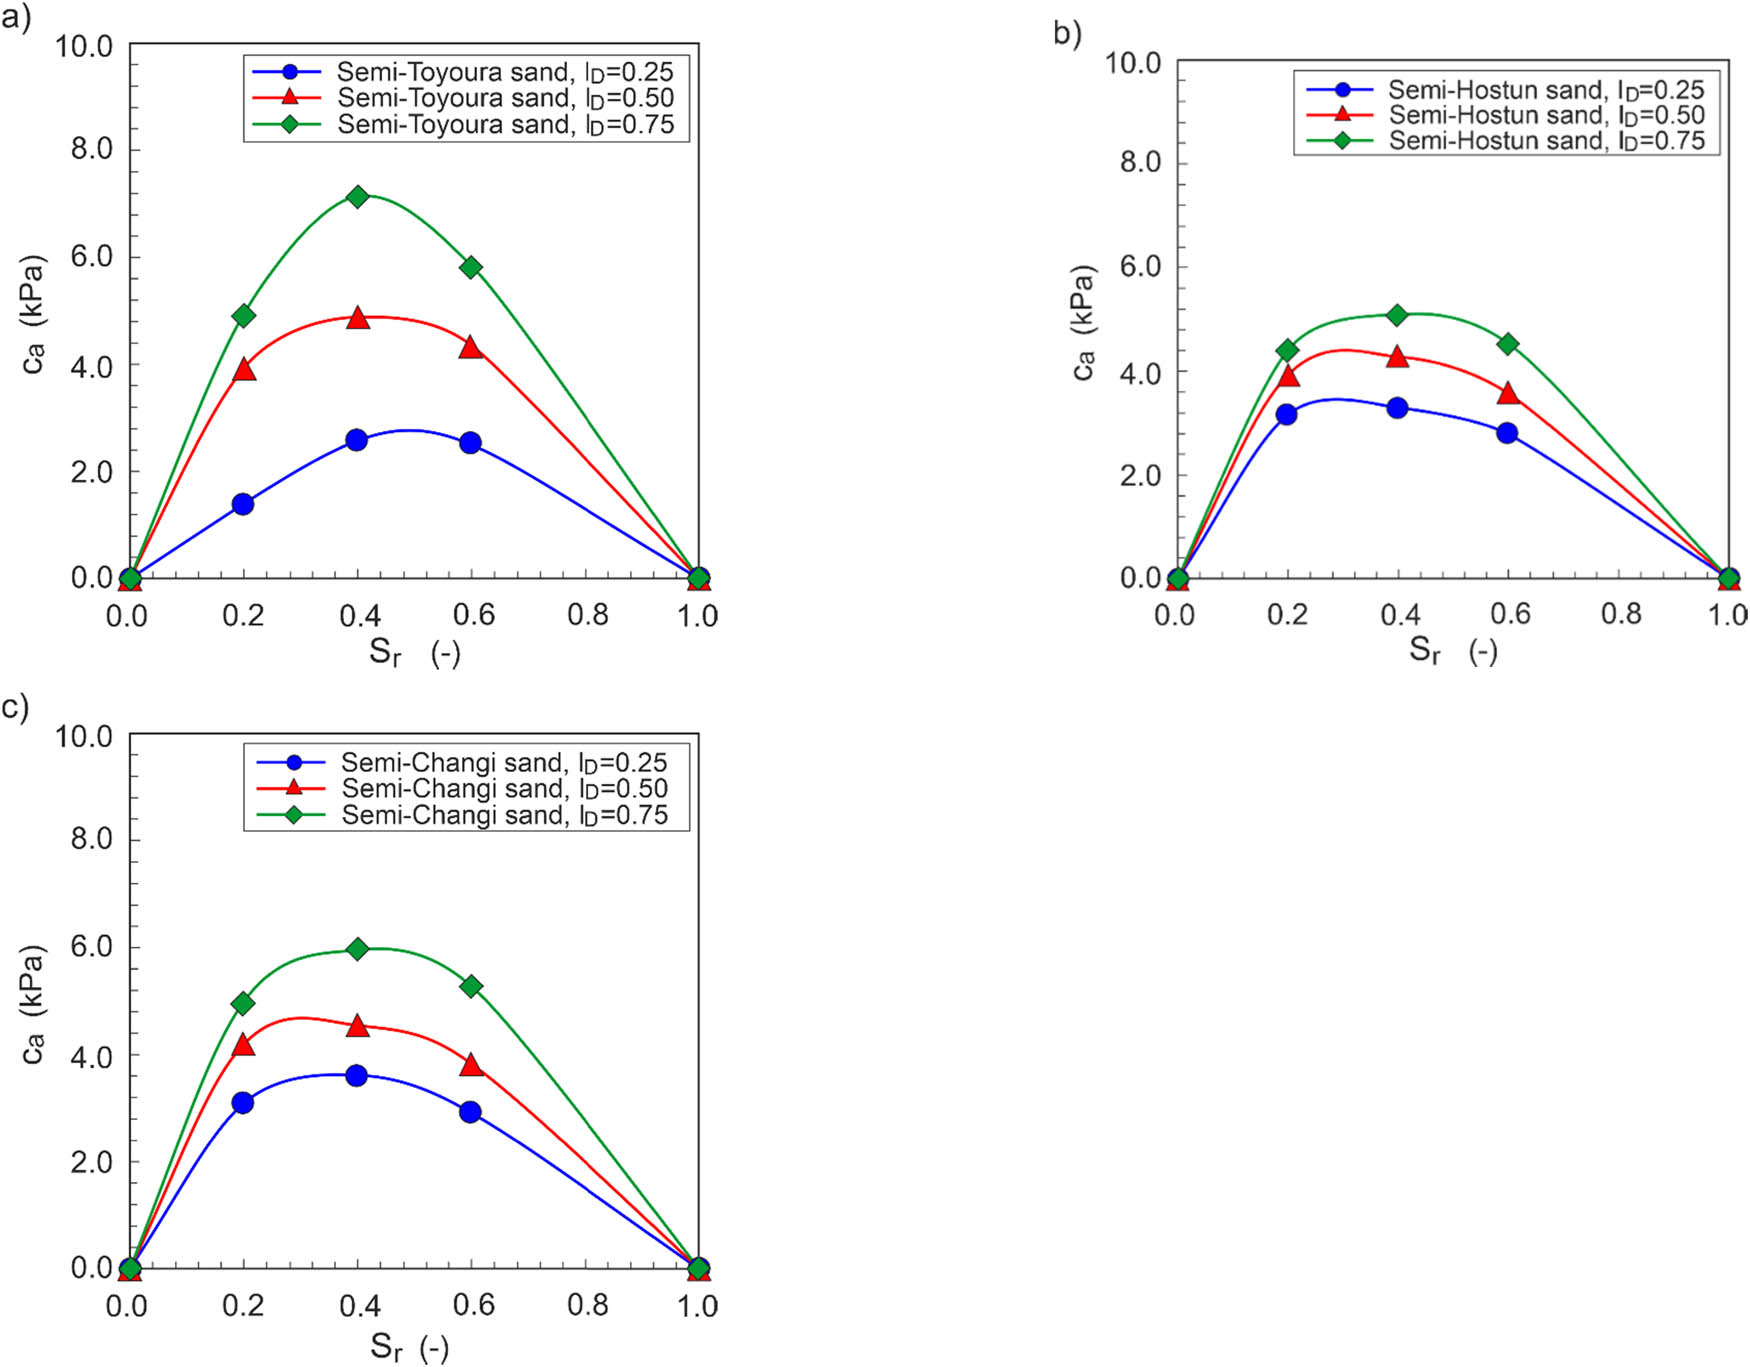
Figure 5
Dependence of apparent cohesion on the saturation degree for different sands: (a) semi-Toyoura; (b) semi-Hostun; and (c) semi-Changi.
Source: Author’s contribution.
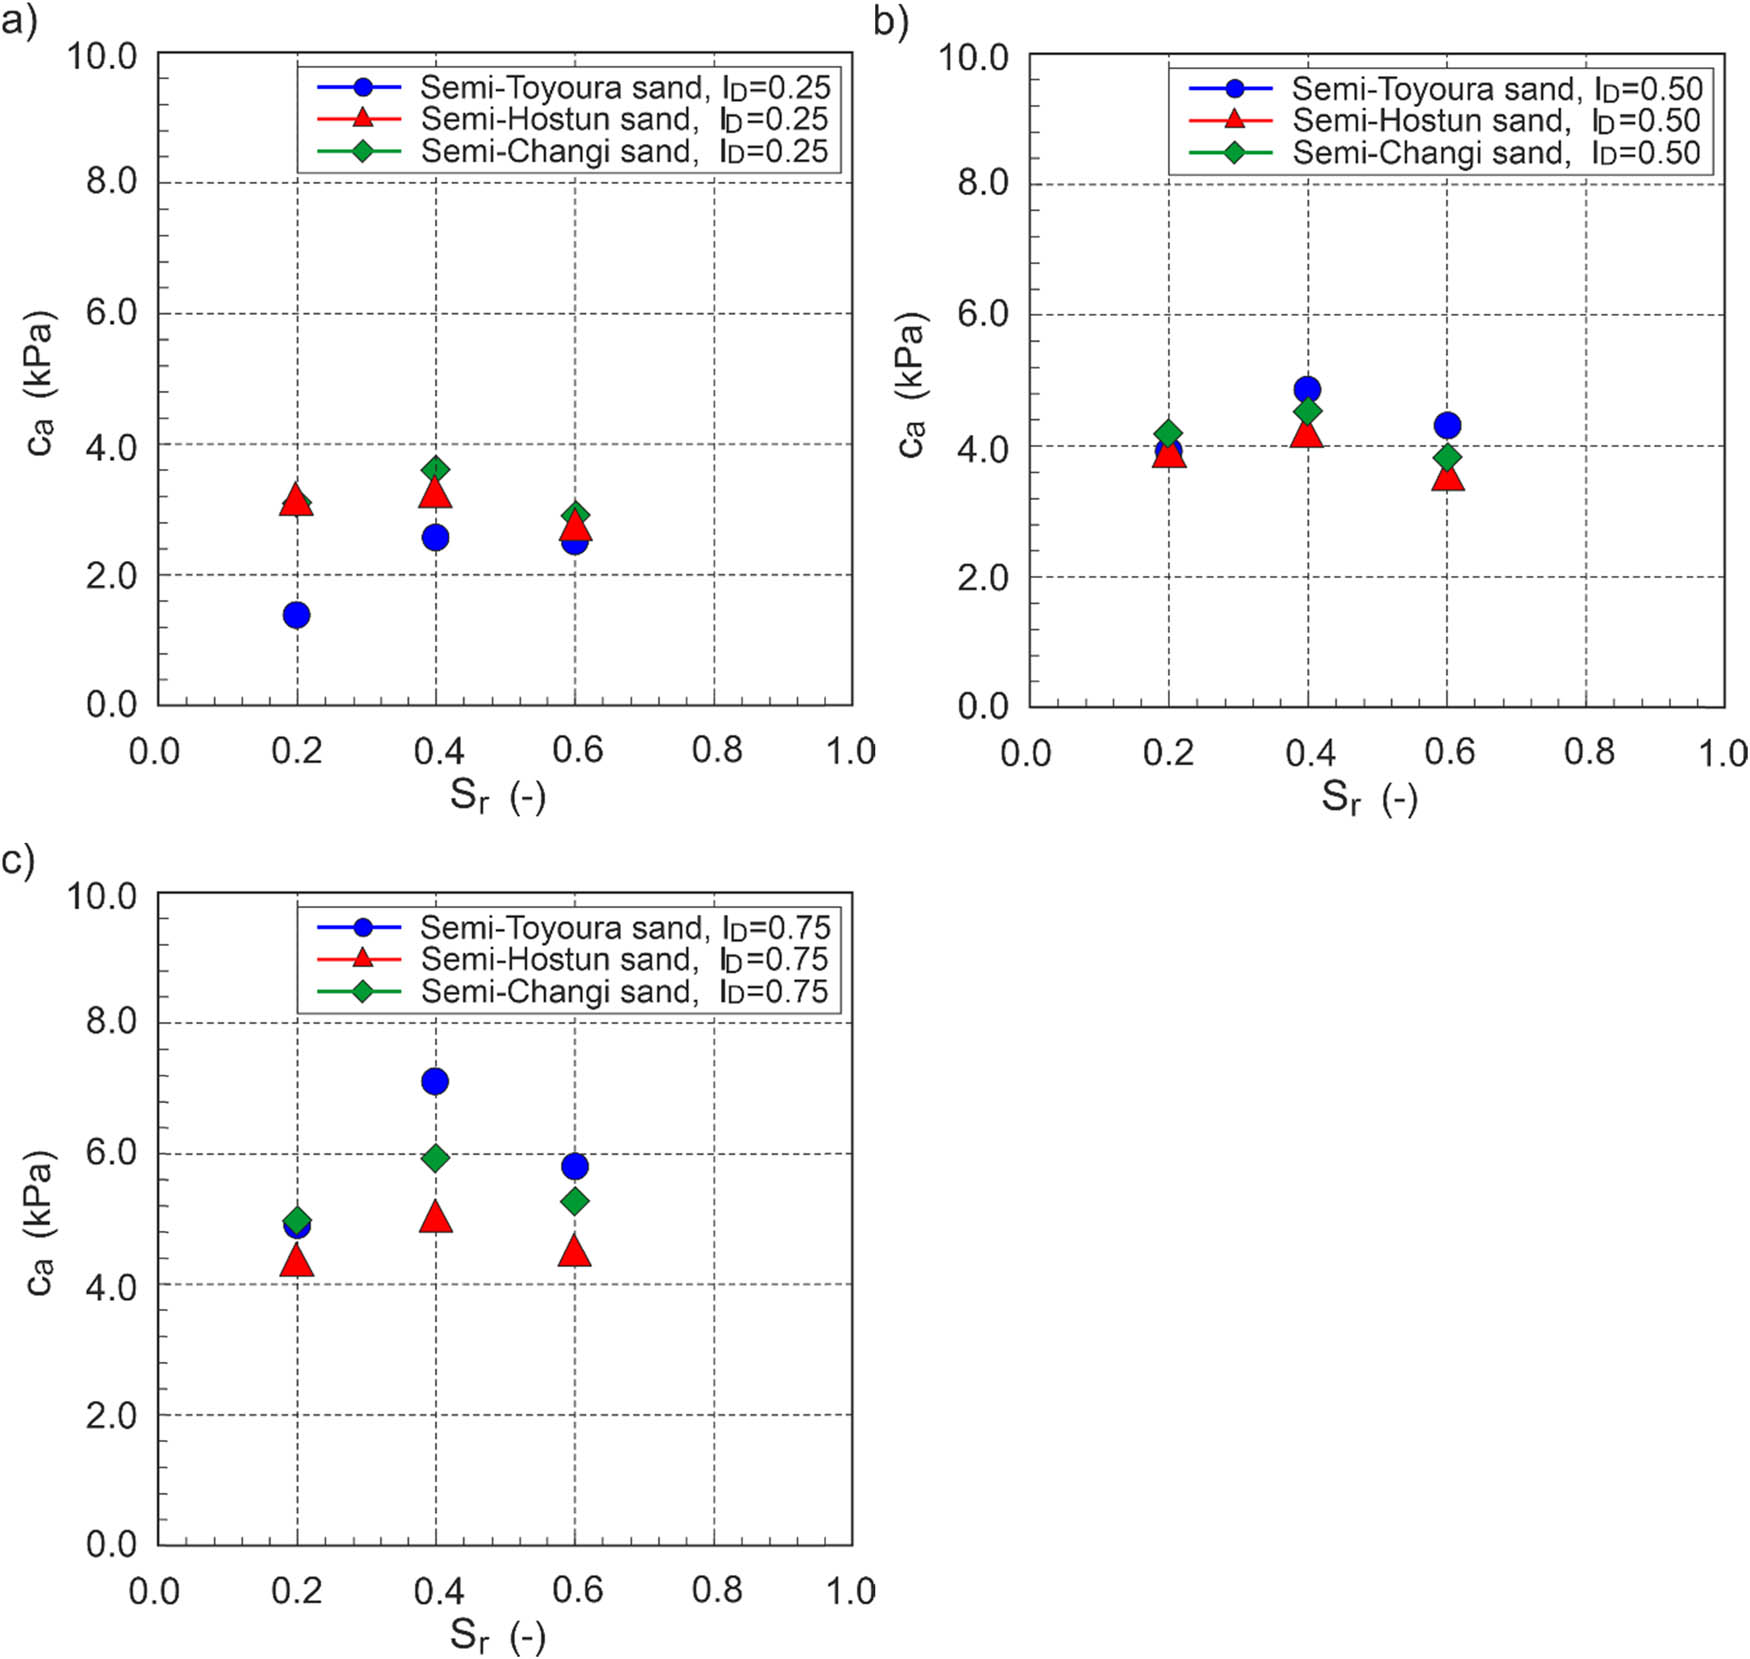
Figure 6
Dependence of the apparent cohesion of tested sands for different density indices: (a) I D = 0.25; (b) I D = 0.50; and (c) I D = 0.75.
Source: Author’s contribution.
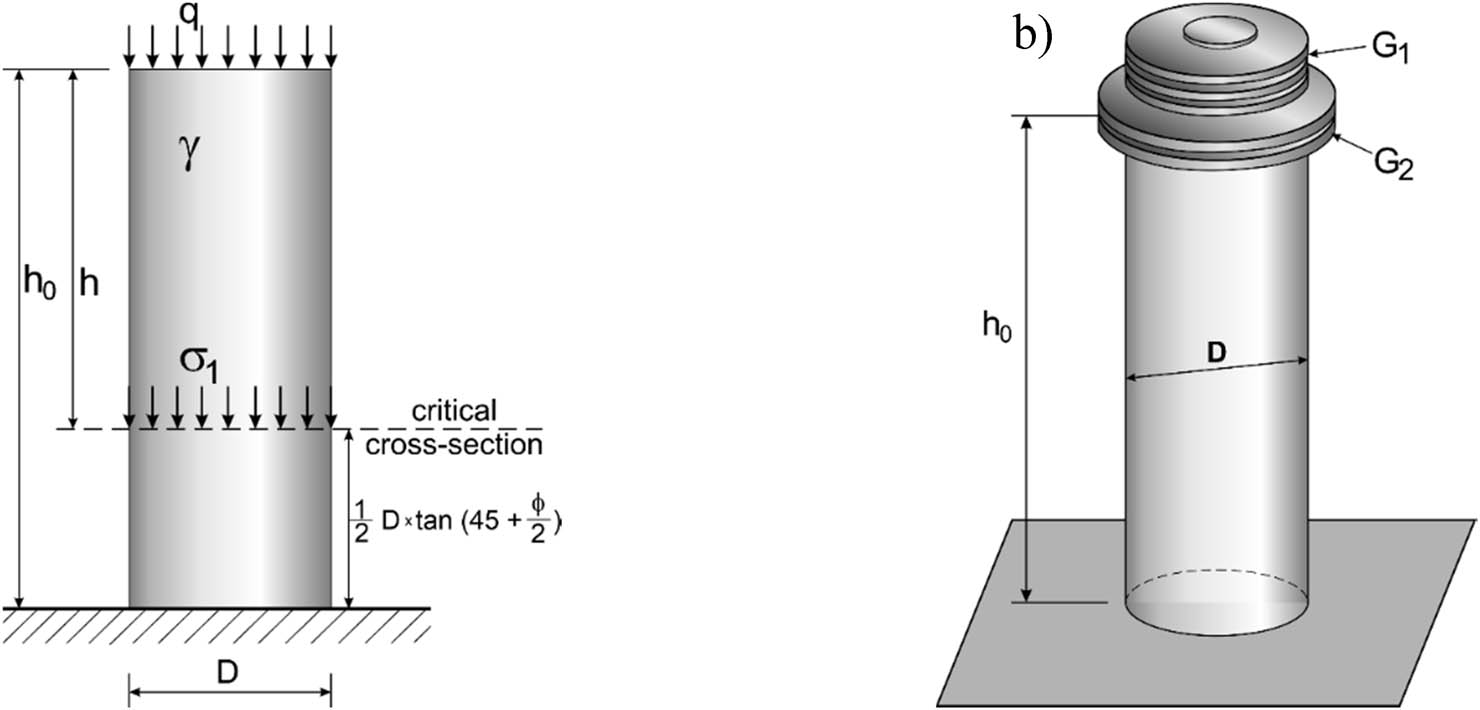
Figure 7
Sand column showing: (a) stress in the critical cross-section and (b) loading with steel plates.
Source: Author’s contribution.
Table 2
Unit weight and angle of friction of sands
| Sand | S r | Density index | ||||||||
|---|---|---|---|---|---|---|---|---|---|---|
| 0.25 | 0.50 | 0.75 | ||||||||
| γ (kN/m3) | ϕ (°) | e (-) | γ (kN/m3) | ϕ (°) | e (-) | γ (kN/m3) | ϕ (°) | e (-) | ||
| Semi-Toyoura | 0.2 | 15.36 | 29.2 | 0.794 | 16.11 | 30.4 | 0.699 | 16.95 | 31.6 | 0.604 |
| 0.4 | 16.23 | 16.92 | 17.68 | |||||||
| 0.6 | 17.10 | 17.72 | 18.42 | |||||||
| Semi-Hostun | 0.2 | 15.94 | 31.4 | 0.720 | 16.51 | 33.0 | 0.653 | 17.12 | 34.5 | 0.585 |
| 0.4 | 16.76 | 17.28 | 17.85 | |||||||
| 0.6 | 17.58 | 18.06 | 18.57 | |||||||
| Semi-Changi | 0.2 | 16.20 | 31.4 | 0.688 | 16.86 | 33.0 | 0.614 | 17.58 | 34.5 | 0.539 |
| 0.4 | 17.00 | 17.60 | 18.27 | |||||||
| 0.6 | 17.80 | 18.35 | 18.96 | |||||||
Source: Author’s contribution.
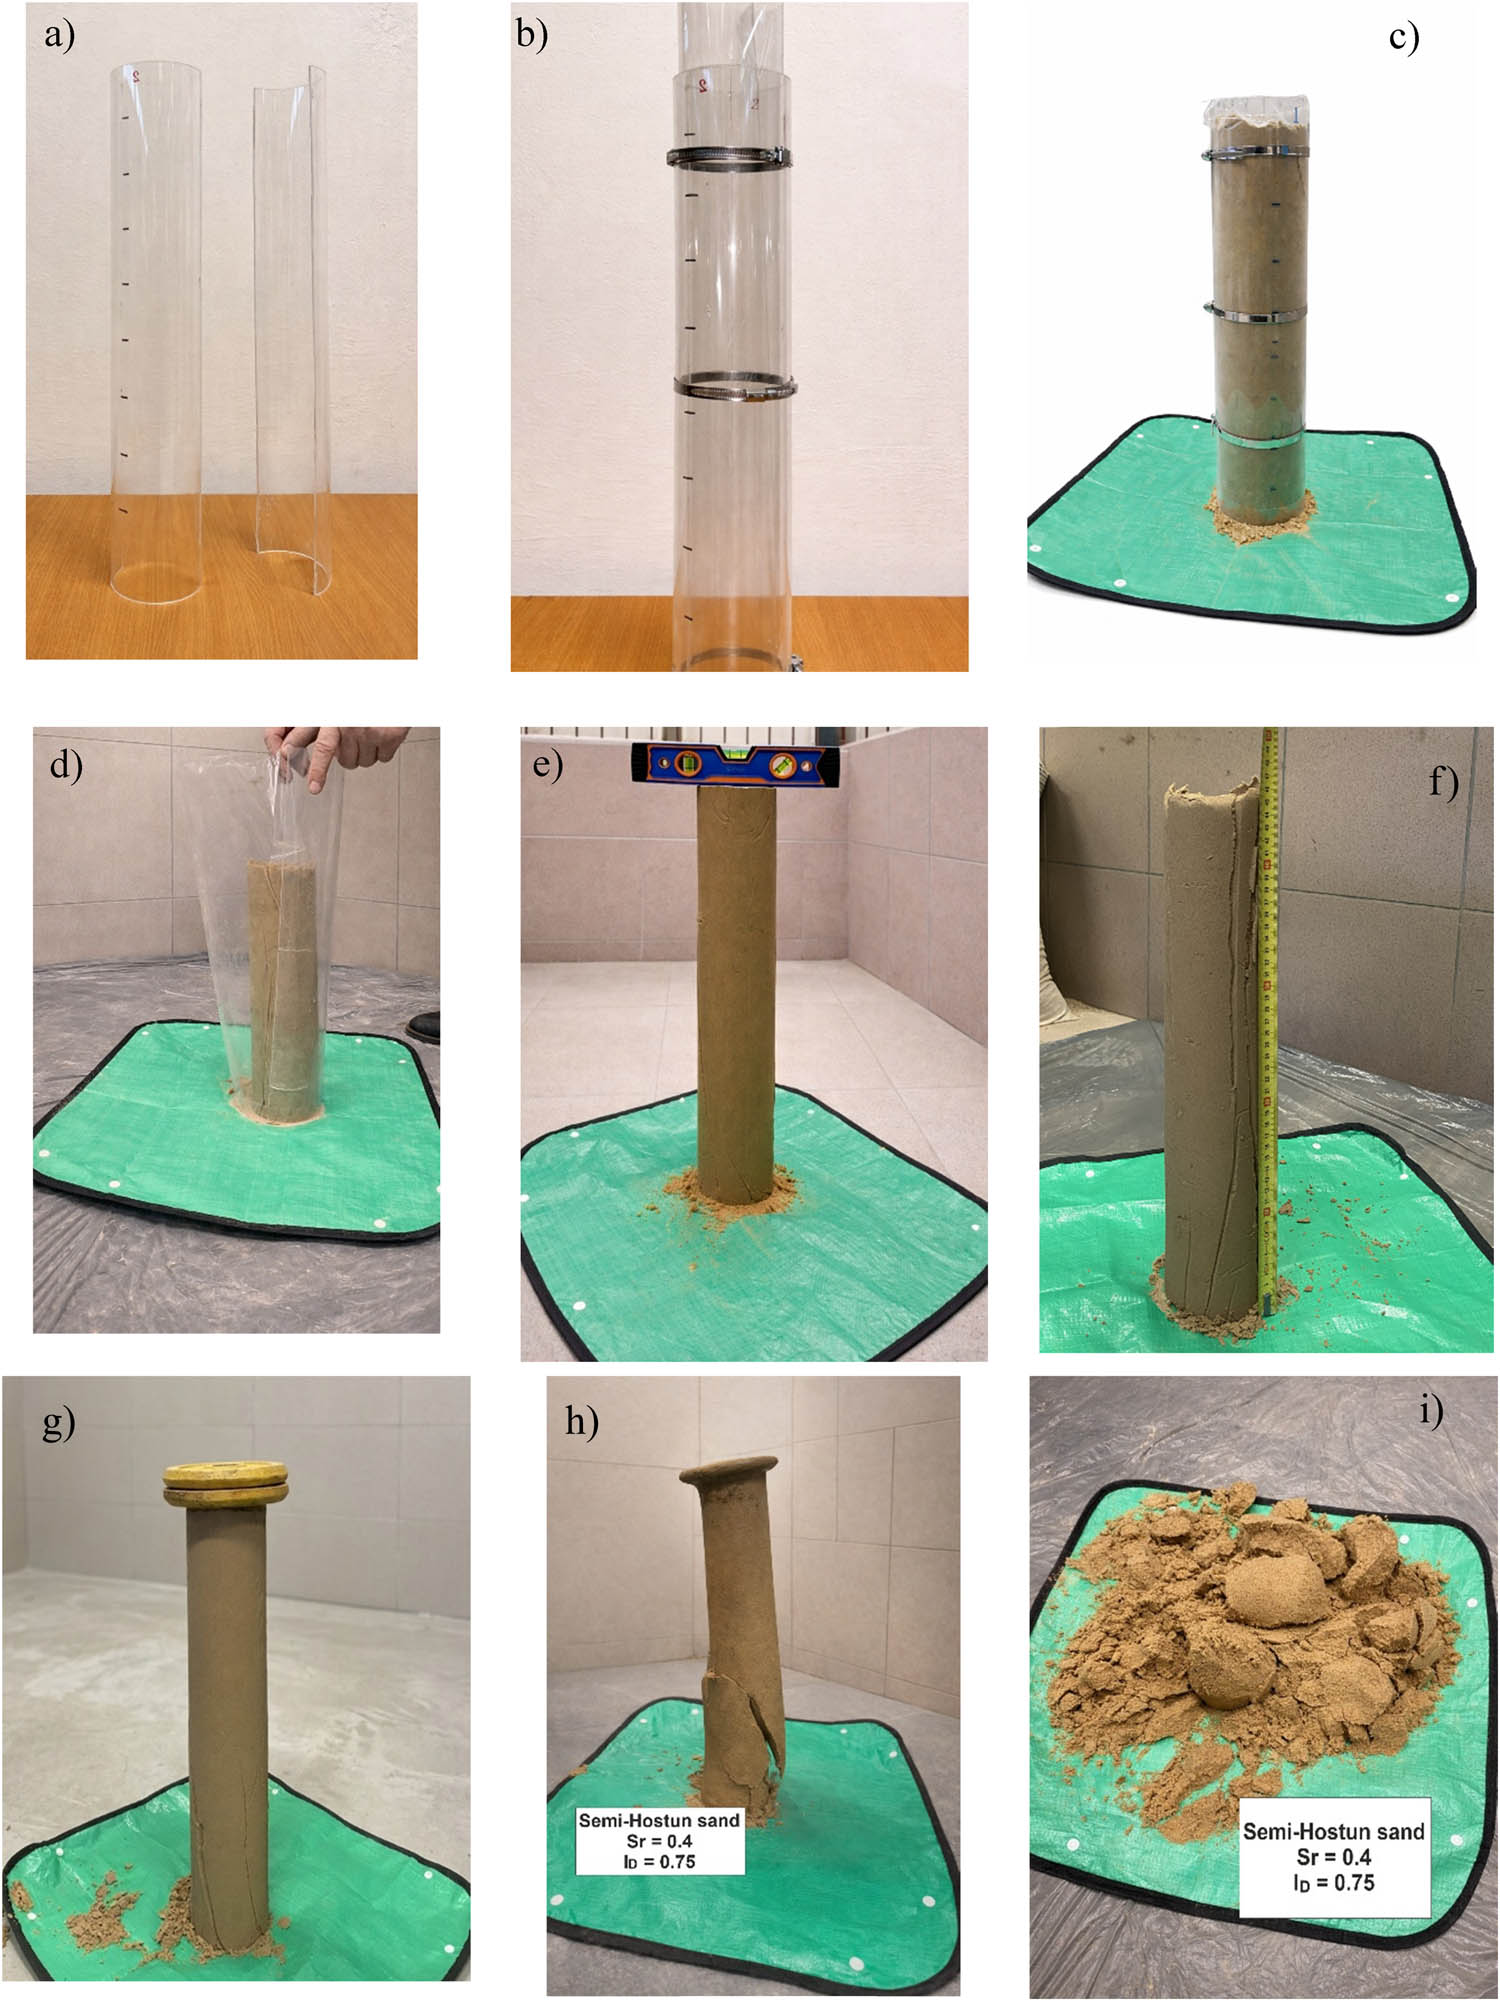
Figure 8
Stages of sand column stability testing: (a) halves of plastic pipe; (b) plastic pipe lined with plastic foil; (c) plastic pipe filled with soil; (d) dismantled plastic pipe and plastic foil; (e) levelling the top of the sand column; (f) measurement of the height of the sand column; (g) loading the sand column with steel plates; (h) initial stage of loss of sand column stability; and (i) final state of loss of stability.
Source: Author’s contribution.
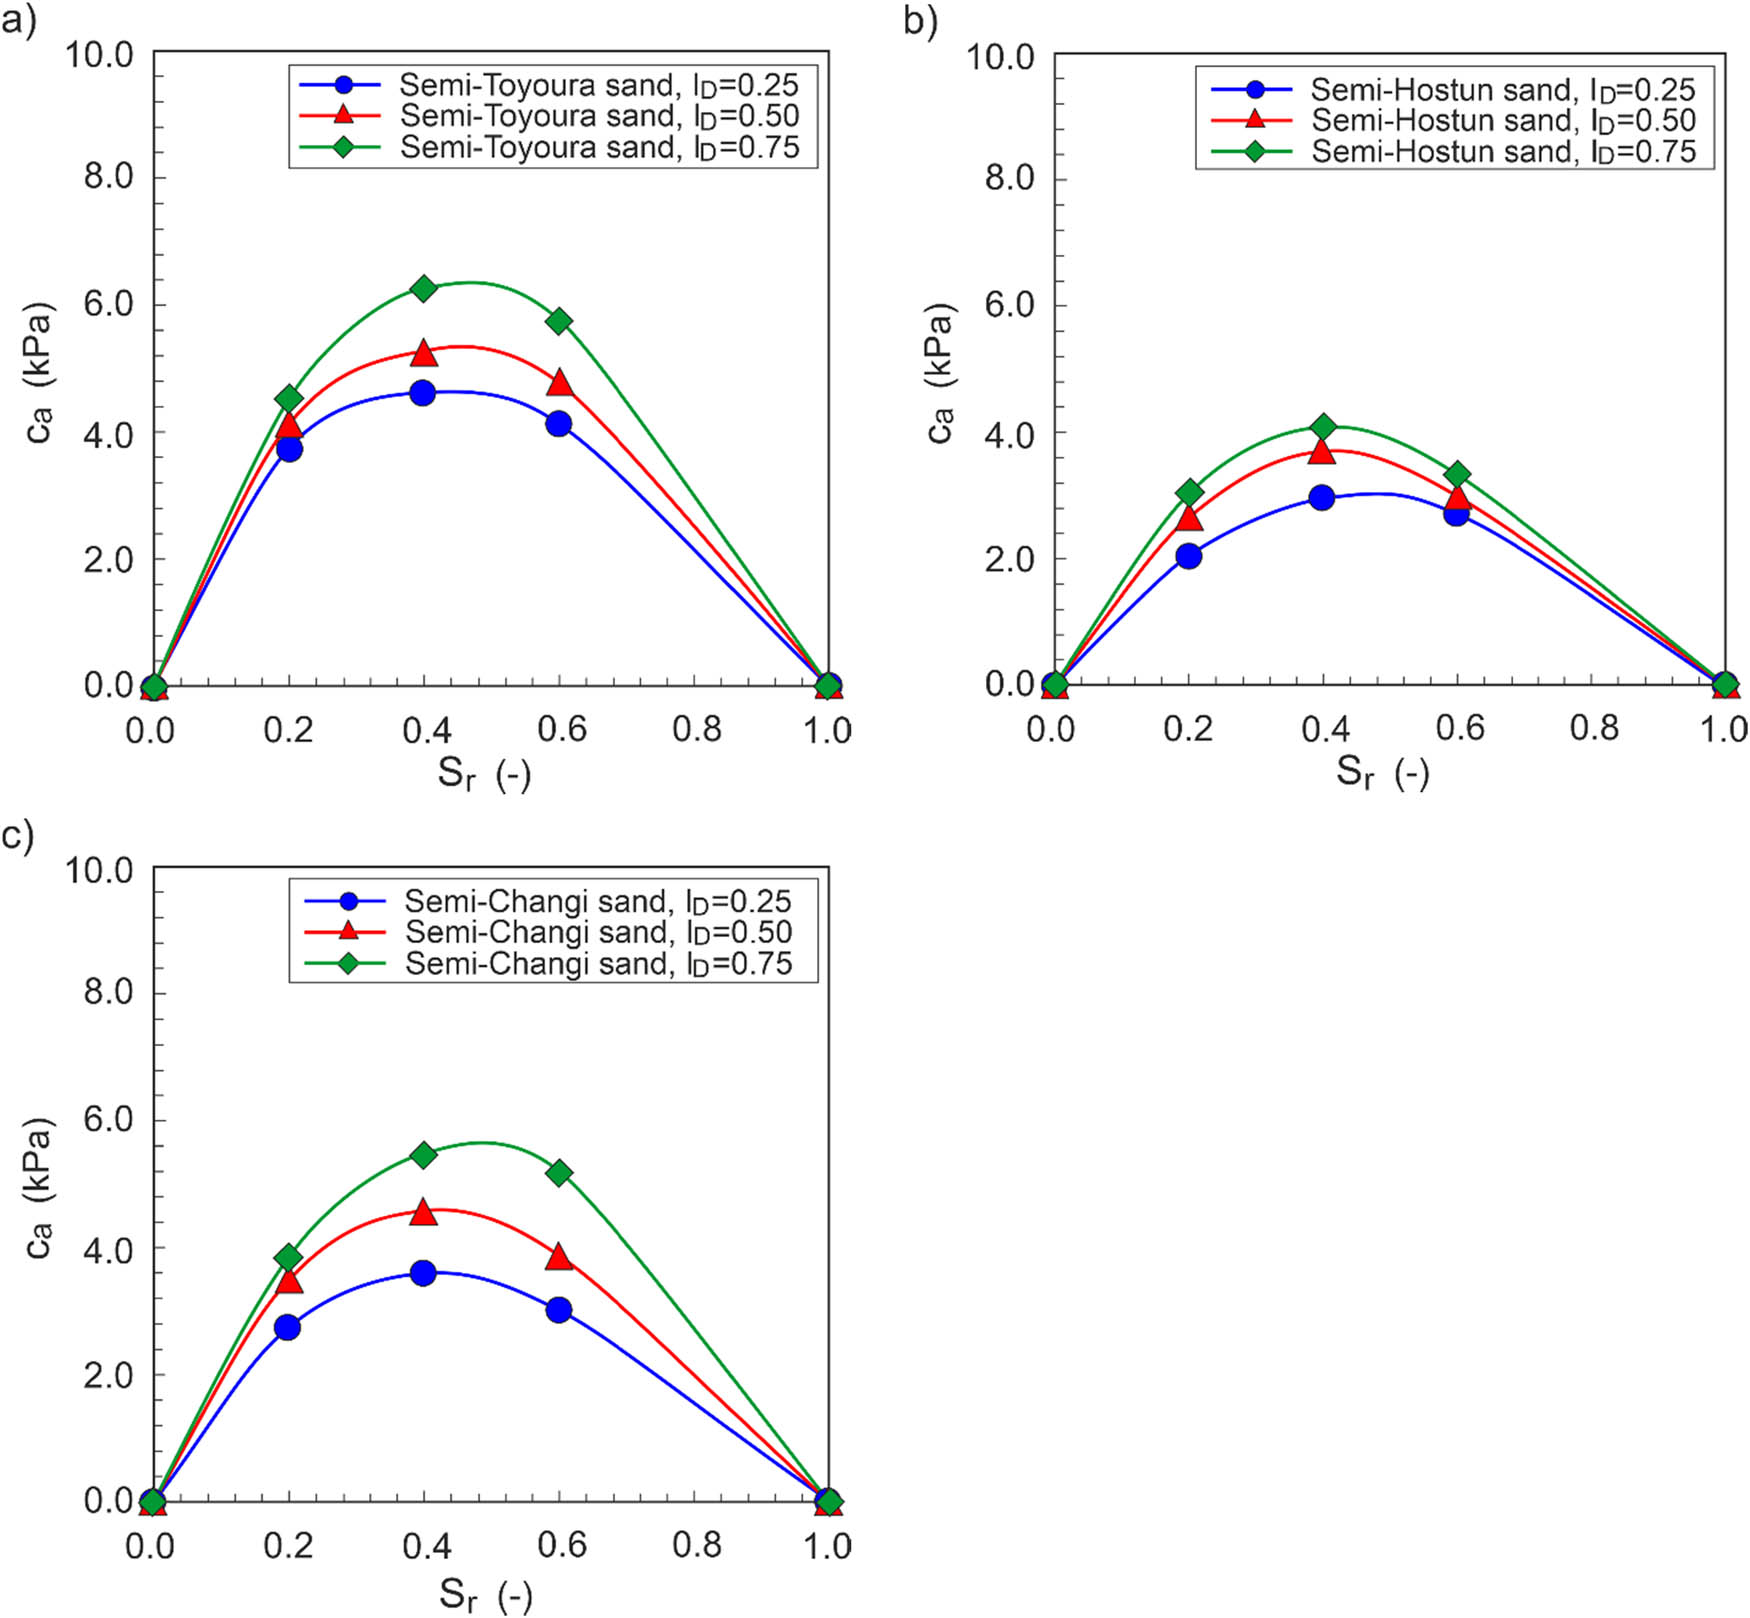
Figure 9
Dependence of apparent cohesion on saturation and density for sands: (a) semi-Toyoura; (b) semi-Hostun; and (c) semi-Changi.
Source: Author’s contribution.
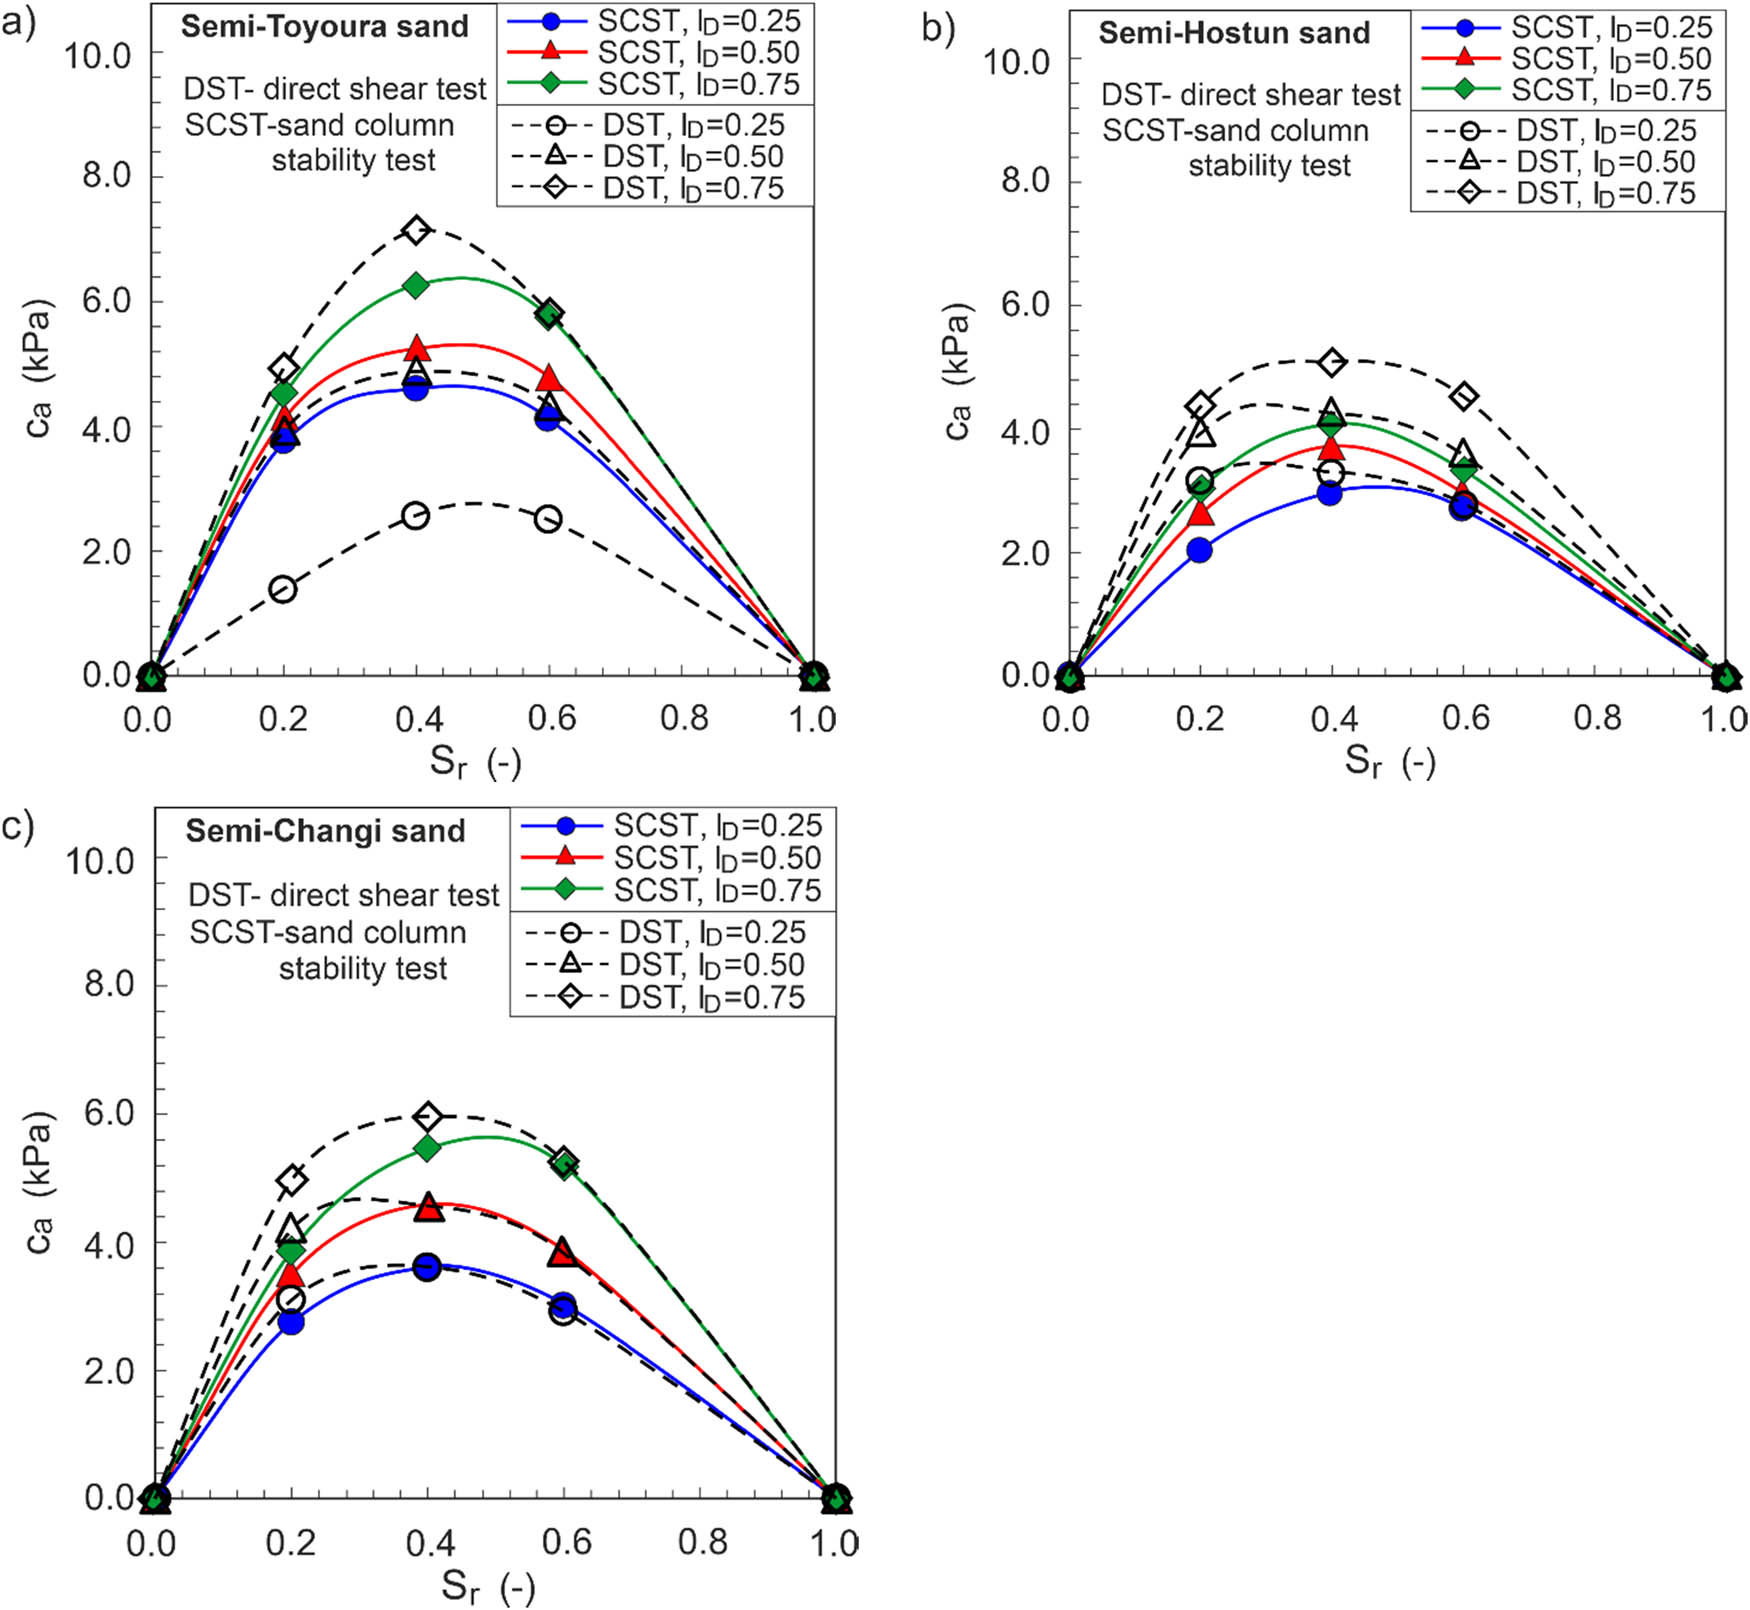
Figure 10
Comparison of apparent cohesion values obtained in sand column stability test and direct shear test for sands: (a) semi-Toyoura; (b) semi-Hostun; and (c) semi-Changi.
Source: Author’s contribution.
Table 3
MK parameters and residual saturation for the tested sands
| Sand | I D (−) | e (−) | h co ≈ AEV (kPa) | ψ r (cm) | m (−) | S r, res (−) |
|---|---|---|---|---|---|---|
| Semi-Toyoura | 0.25 | 0.794 | 6.97 | 143 | 0.537 | 0.089 |
| 0.50 | 0.699 | 7.92 | 167 | 0.096 | ||
| 0.75 | 0.604 | 9.16 | 199 | 0.105 | ||
| Semi-Hostun | 0.25 | 0.720 | 3.43 | 61 | 0.661 | 0.094 |
| 0.50 | 0.653 | 3.78 | 69 | 0.086 | ||
| 0.75 | 0.585 | 4.22 | 79 | 0.090 | ||
| Semi-Changi | 0.25 | 0.688 | 5.00 | 96 | 0.394 | 0.081 |
| 0.50 | 0.614 | 5.61 | 110 | 0.086 | ||
| 0.75 | 0.539 | 6.39 | 129 | 0.093 |
Source: Author’s contribution.
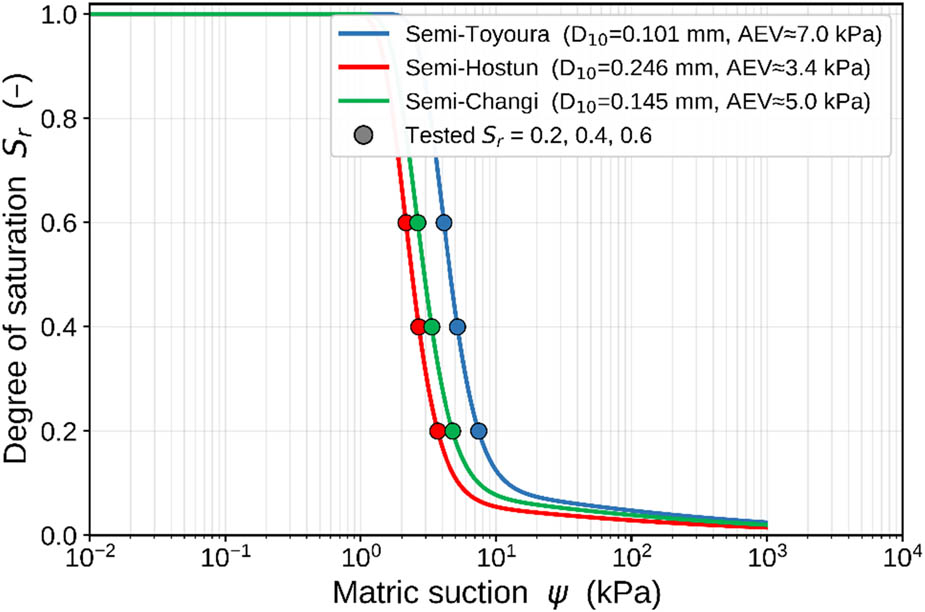
Figure 11
MK SWRCs with the tested saturations marked, air-entry ordering follows 1/D 10.
Source: Author’s contribution.
Table 4
Estimated suction, Bishop (χ = S e ) prediction, measured apparent cohesion (direct shear) and implied χ
| Sand | I D (−) | S r (−) | ψ (kPa) | S e (−) | c a pred (kPa) | c a meas. DST (kPa) | χ implied (−) |
|---|---|---|---|---|---|---|---|
| Semi-Toyoura | 0.25 | 0.2 | 7.45 | 0.12 | 0.51 | 1.38 | 0.33 |
| 0.4 | 5.20 | 0.34 | 0.99 | 2.56 | 0.88 | ||
| 0.6 | 4.12 | 0.56 | 1.29 | 2.51 | 1.09 | ||
| 0.50 | 0.2 | 8.67 | 0.12 | 0.59 | 3.92 | 0.77 | |
| 0.4 | 5.96 | 0.34 | 1.18 | 4.87 | 1.39 | ||
| 0.6 | 4.70 | 0.56 | 1.54 | 4.32 | 1.57 | ||
| 0.75 | 0.2 | 10.38 | 0.11 | 0.68 | 4.92 | 0.77 | |
| 0.4 | 6.98 | 0.33 | 1.42 | 7.13 | 1.66 | ||
| 0.6 | 5.48 | 0.55 | 1.86 | 5.82 | 1.73 | ||
| Semi-Hostun | 0.25 | 0.2 | 3.70 | 0.13 | 0.29 | 3.16 | 1.40 |
| 0.4 | 2.68 | 0.35 | 0.57 | 3.28 | 2.01 | ||
| 0.6 | 2.15 | 0.56 | 0.74 | 2.79 | 2.12 | ||
| 0.50 | 0.2 | 4.12 | 0.12 | 0.33 | 3.94 | 1.47 | |
| 0.4 | 2.97 | 0.34 | 0.66 | 4.27 | 2.21 | ||
| 0.6 | 2.38 | 0.56 | 0.87 | 3.58 | 2.32 | ||
| 0.75 | 0.2 | 4.66 | 0.12 | 0.39 | 4.38 | 1.37 | |
| 0.4 | 3.33 | 0.34 | 0.78 | 5.08 | 2.22 | ||
| 0.6 | 2.67 | 0.56 | 1.03 | 4.53 | 2.47 | ||
| Semi-Changi | 0.25 | 0.2 | 4.77 | 0.13 | 0.38 | 3.09 | 1.06 |
| 0.4 | 3.33 | 0.35 | 0.71 | 3.61 | 1.77 | ||
| 0.6 | 2.63 | 0.56 | 0.91 | 2.90 | 1.81 | ||
| 0.50 | 0.2 | 5.45 | 0.12 | 0.44 | 4.20 | 1.19 | |
| 0.4 | 3.76 | 0.34 | 0.84 | 4.54 | 1.86 | ||
| 0.6 | 2.96 | 0.56 | 1.08 | 3.83 | 1.99 | ||
| 0.75 | 0.2 | 6.36 | 0.12 | 0.52 | 4.97 | 1.14 | |
| 0.4 | 4.33 | 0.34 | 1.01 | 5.96 | 2.00 | ||
| 0.6 | 3.39 | 0.56 | 1.30 | 5.28 | 2.26 |
Source: Author’s contribution.
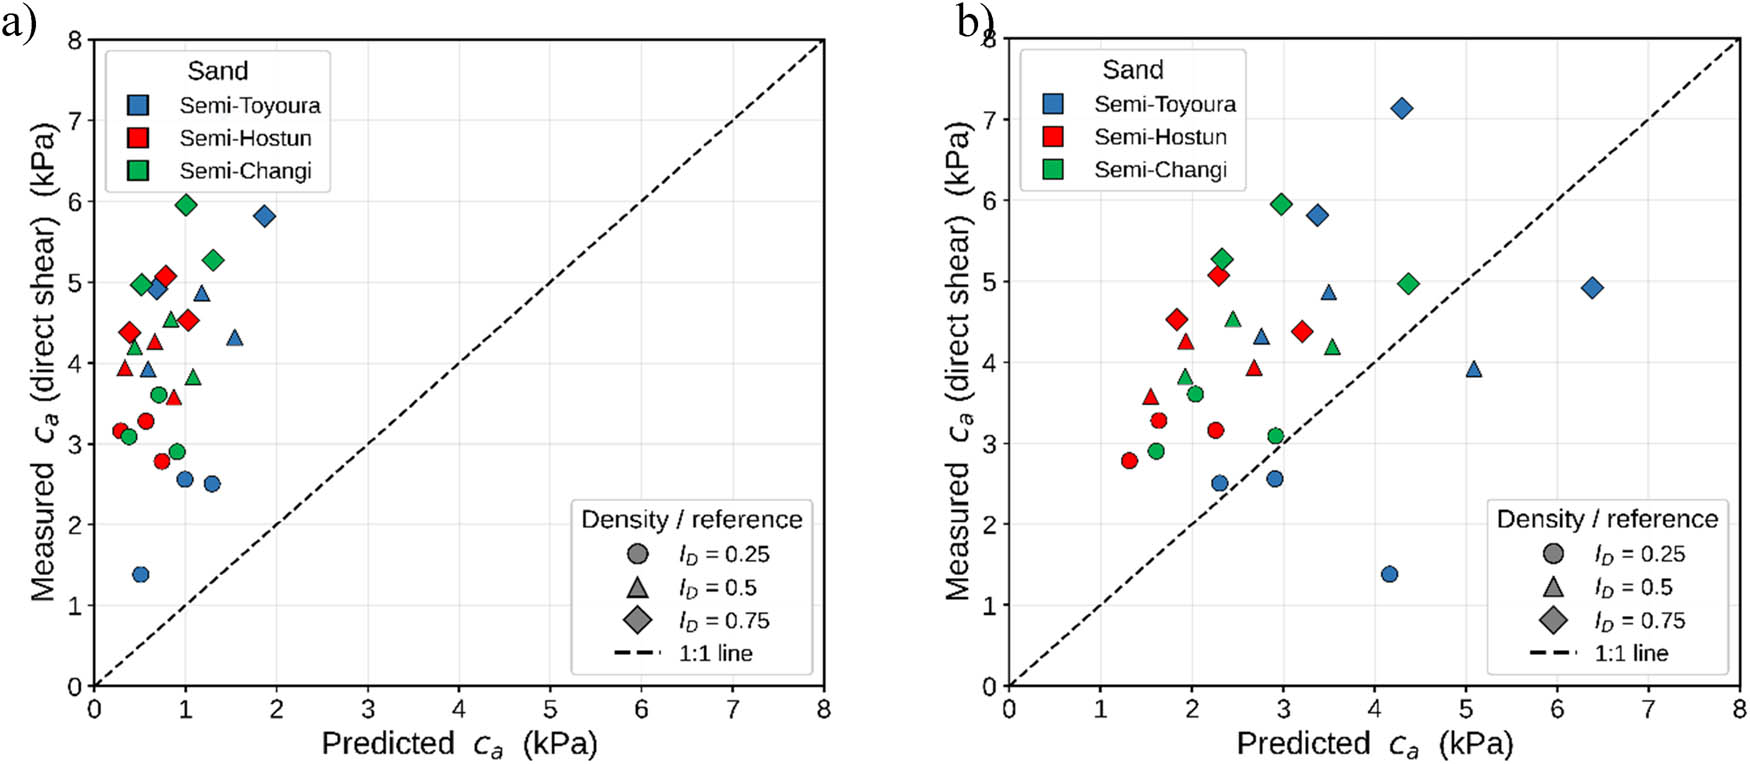
Figure 12
Measured vs predicted apparent cohesion (27 points): (a) χ = S e (Vanapalli) and (b) χ = 1.
Source: Author’s contribution.
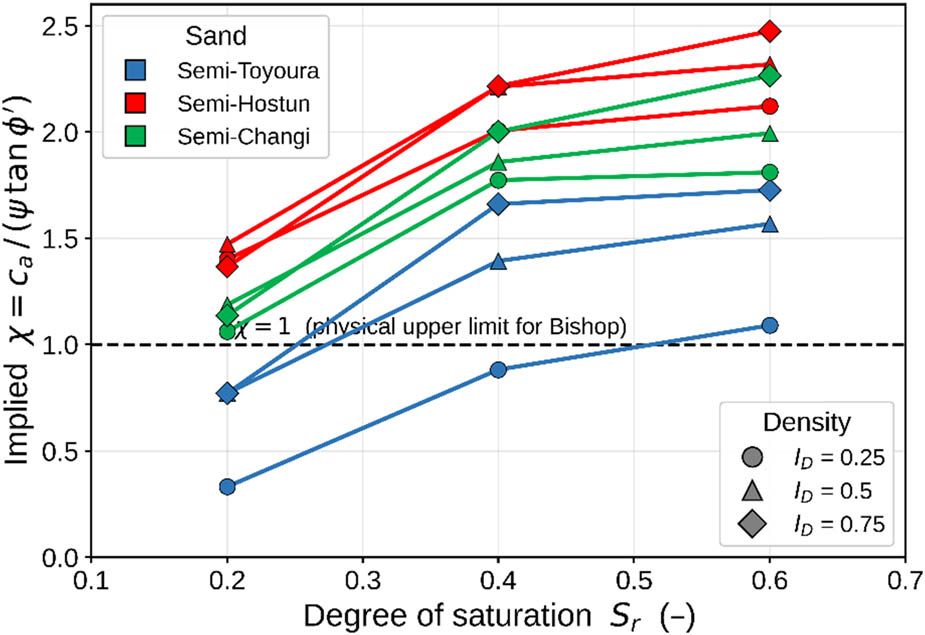
Figure 13
Effective-stress parameter χ implied by the measured cohesion.
Source: Author’s contribution.