
1. Introduction
In unsaturated sands, surface tension generates negative pressures in soil pores, which lead to a phenomenon known as apparent cohesion [1]. Apparent cohesion in coarse-grained soils is primarily dependent on grain size, degree of compaction, and degree of saturation. In dry and fully saturated sands, there is no apparent cohesion. Meanwhile, unsaturated sands exhibit apparent cohesion at low moisture content, which will make the excavated surface have stable slopes [2]. Hence, apparent cohesion is important in the analysis of slope stability, embankments, earth structures, and foundations in unsaturated soils [3,4].
Recent research has shown that moisture content and density index influence the shear strength of soil [5–7]. Soil strength generally changes with the moisture content [8,9] and increases with the density index due to an increase in particle interlocking, dilatancy, and peak friction angle [5,10,11]. In unsaturated sands, water forms menisci at particle contacts, surface tensions in these menisci generate capillary forces, which pull together, act like temporary interparticle bonds, and increase shear resistance even at low normal stress level [2,12,13]. These forces are observed at the macroscopic scale as matric suction, which contributes apparent cohesion to the shear strength without changing the friction angle [14]. The matric suction represents the average effect of capillary forces through the soil mass, and it varies with water content [15].
Several empirical formulas have been proposed to link suction and shear strength [16]. Bishop [17] described the effective stress of unsaturated soils with a parameter χ indicating the degree of saturation, and it was correlated to the air entry value of the soil [18]. Khalili and Khabbaz [18] worked on Bishop’s concept and concluded that an increase in suction up to the air entry value of the soil leads to a linear increase in shear strength of the soil. This concept is seldom used because of its complexities in practical applications. Hence, Fredlund et al. [19] introduced the concept of an independent stress variable, with “φ b” representing an increase in shear strength relative to matric suction. Initially, the linear increase in soil shear strength at the rate of ψ b was correlated with a corresponding increase in suction experimentally. However, Gan [12] observed after a series of direct shear tests that, beyond a specific range of suction, ψ b decreases. Fredlund et al. [20] later introduced a fitting parameter, κ, where matric suction and its normalised volumetric water content are used, making the relationship between matric suction and shear strength nonlinear, while Vanapalli et al. [21] and Lu and Likos [22,23] related χ to the degree of saturation through the soil–water characteristic curve.
As saturation increases from the dry state, isolated menisci first form in the pendular regime; the number of water bridges and the cohesive force grow until, in the funicular regime, the bridges begin to coalesce and the cohesion reaches a maximum; with further wetting, the menisci merge, suction falls, and the cohesion decreases toward zero at full saturation [24–27]. A series of unconfined compression tests showed that soil strength increased with matric suction for specimens compacted at optimum moisture content [15]. Ahmad [28] also observed that for unsaturated silica sands in a triaxial apparatus, the shear strength of the sands is higher at residual moisture content than at the optimal moisture content. Maghvan et al. [13] evaluated the impacts of relative density and degree of saturation on the shear strength of sands in direct shear. It was observed that the frictional angle increased with relative density, leading to an increase in soil strength, but the highest strength of the soil was at a lower degree of saturation, at which maximum suction stress occurred. There remains a need for datasets that quantify the apparent cohesion of clean sands systematically across both the degree of saturation and the density index, obtained by more than one method, and interpreted within an effective-stress framework rather than reported only as an empirical intercept.
Although numerous studies have explored the relationship between density index and friction angle [e.g., 29,30], most of the research on apparent cohesion of unsaturated soil has focused on fine-grained soils, where suction is easier to sustain and measure, relatively little has been done to examine the effects of saturation and density index in coarse-grained soils. In this study, the apparent cohesion of three clean sands was experimentally determined using direct shear and column stability tests. The dependence of the apparent cohesion on saturation degree and density level was studied for each sand, as well as to establish a simple sand-column stability test as an independent, low-cost method for evaluating apparent cohesion, and to validate it against the direct-shear results. The last objective was to interpret the measurements within unsaturated soil mechanics by estimating the soil–water retention curve (SWRC) and matric suction of each sand with the modified Kovács (MK) model [27] and test whether the Bishop effective stress, with the effective degree of saturation as the weighting parameter, reproduces the measured apparent cohesion, thereby assessing both the value and the limitations of that closure for clean sands.
2. Sands
Quartz sands with properties similar to Toyoura, Hostun, and Changi sands, which have been widely adopted in geotechnical engineering research, were used for this study. These sands are called semi-Toyoura, semi-Hostun, and semi-Changi sands. The resemblance is one of gradation and of clean-quartz composition, not of geologic origin. The grain size distribution curves for the soils are shown in Figure 1, and some of their basic physical properties determined in accordance with PN-EN ISO 14688-2 [31] are provided in Table 1.
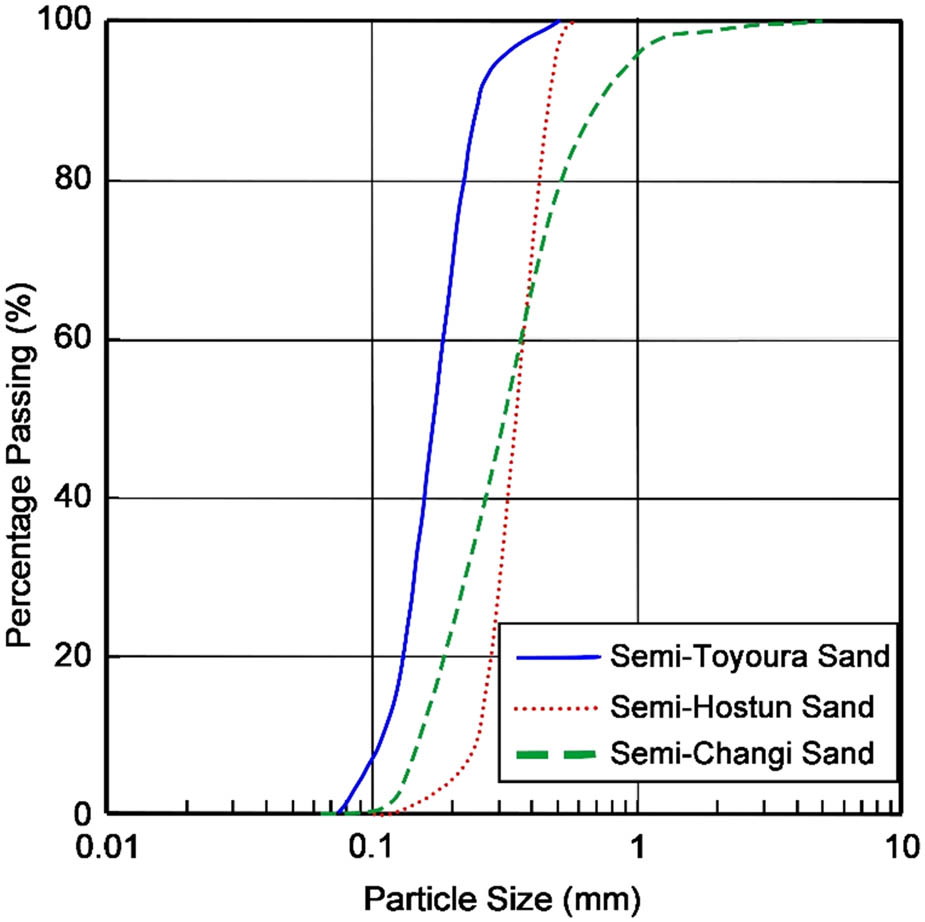
Figure 1
Grading curves of the tested sands.
Source: Author’s contribution.
Table 1
Geotechnical properties of the tested sand
| Properties | Units | Semi-Toyoura | Semi-Hostun | Semi-Changi |
|---|---|---|---|---|
| D 10 | (mm) | 0.101 | 0.246 | 0.145 |
| D 30 | (mm) | 0.141 | 0.293 | 0.22 |
| D 50 | (mm) | 0.171 | 0.343 | 0.313 |
| D 60 | (mm) | 0.188 | 0.372 | 0.368 |
| Specific gravity, G s | (–) | 2.65 | 2.65 | 2.65 |
| Maximum dry density, | (g/cm3) | 1.695 | 1.695 | 1.736 |
| Optimum moisture content, w opt | (%) | 13.4 | 13 | 13 |
| Minimum void ratio, e min | (–) | 0.509 | 0.518 | 0.464 |
| Maximum void ratio, e max | (–) | 0.889 | 0.787 | 0.763 |
| Coefficient of curvature, C c | (–) | 1.047 | 0.938 | 0.907 |
| Coefficient of uniformity, C u | (–) | 1.861 | 1.512 | 2.538 |
Source: Author’s contribution.
The minimum and maximum void ratios were obtained following ASTM D4253 [32], and the maximum dry density and optimum moisture content were obtained from the standard Proctor test according to PN-EN 13286-2 [33]. All three sands are poorly graded, with semi-Toyoura the finest and semi-Hostun the coarsest.
3. Experiments
3.1. Direct shear tests
Sand samples measuring 80 mm × 80 mm and 49.6 mm high were tested in a direct shear apparatus. Dry sands mixed with distilled water to the desired saturation level were compacted in three layers in a shear box to achieve the desired density index. The prepared sample was then mounted in a direct shear apparatus, and vertical load was applied to achieve the targeted normal stress level, taking into account the weight of the upper porous plate and the loading cap. All of the direct shear tests were conducted based on ASTM D3080M-23 [34] at a constant and low displacement speed of 0.1 mm/min under low normal stress. Tests were carried out on three types of sands: semi-Toyoura, semi-Hostun, and semi-Changi at different compaction degrees (I D = 0.25, 0.50, and 0.75), saturation (S r = 0.2, 0.4, and 0.6), and normal stresses (σ n = 5, 15, 30, and 50 kPa).
The relationships between shear stress (τ) and normal stress (σ n ) at failure for the three sands (Figures 2–4) are almost essentially linear over the 5–50 kPa range, with the small negative quadratic coefficient of equation (1) producing only slight curvature at the highest density and normal stress [2,35] and can be well approximated by parabolas (Figures 2–4).
where parameter is the intercept and defines the apparent cohesion (c a), parameter defines the slope of the tangent line, and parameter defines the curvature of the parabola at a given normal stress, which is small and negative for all tests.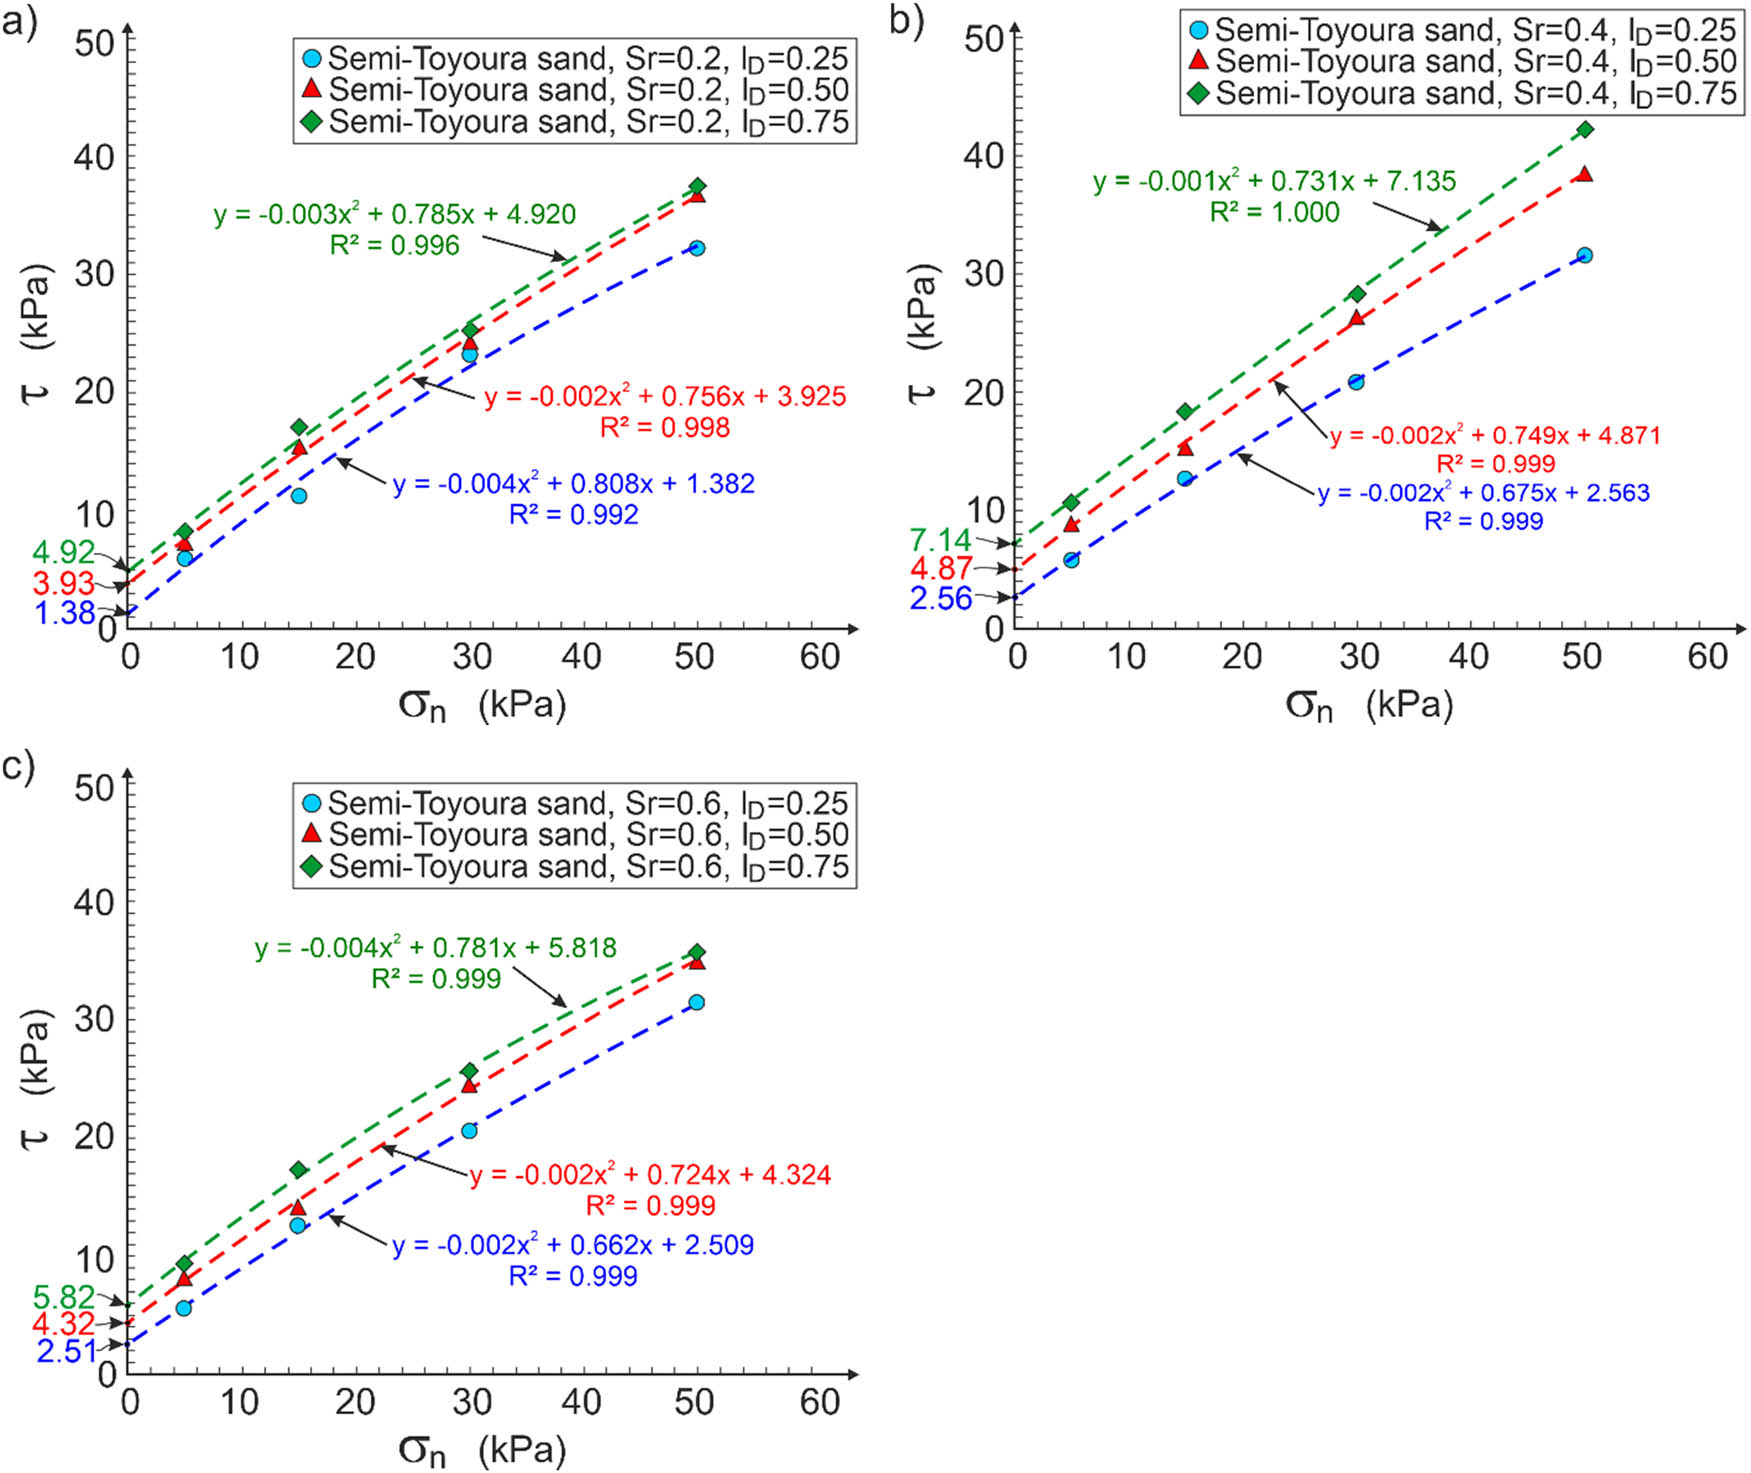
Figure 2
Apparent cohesion of semi-Toyoura sand for different saturation degrees: (a) S r = 0.2; (b) S r = 0.4; and (c) S r = 0.6.
Source: Author’s contribution.
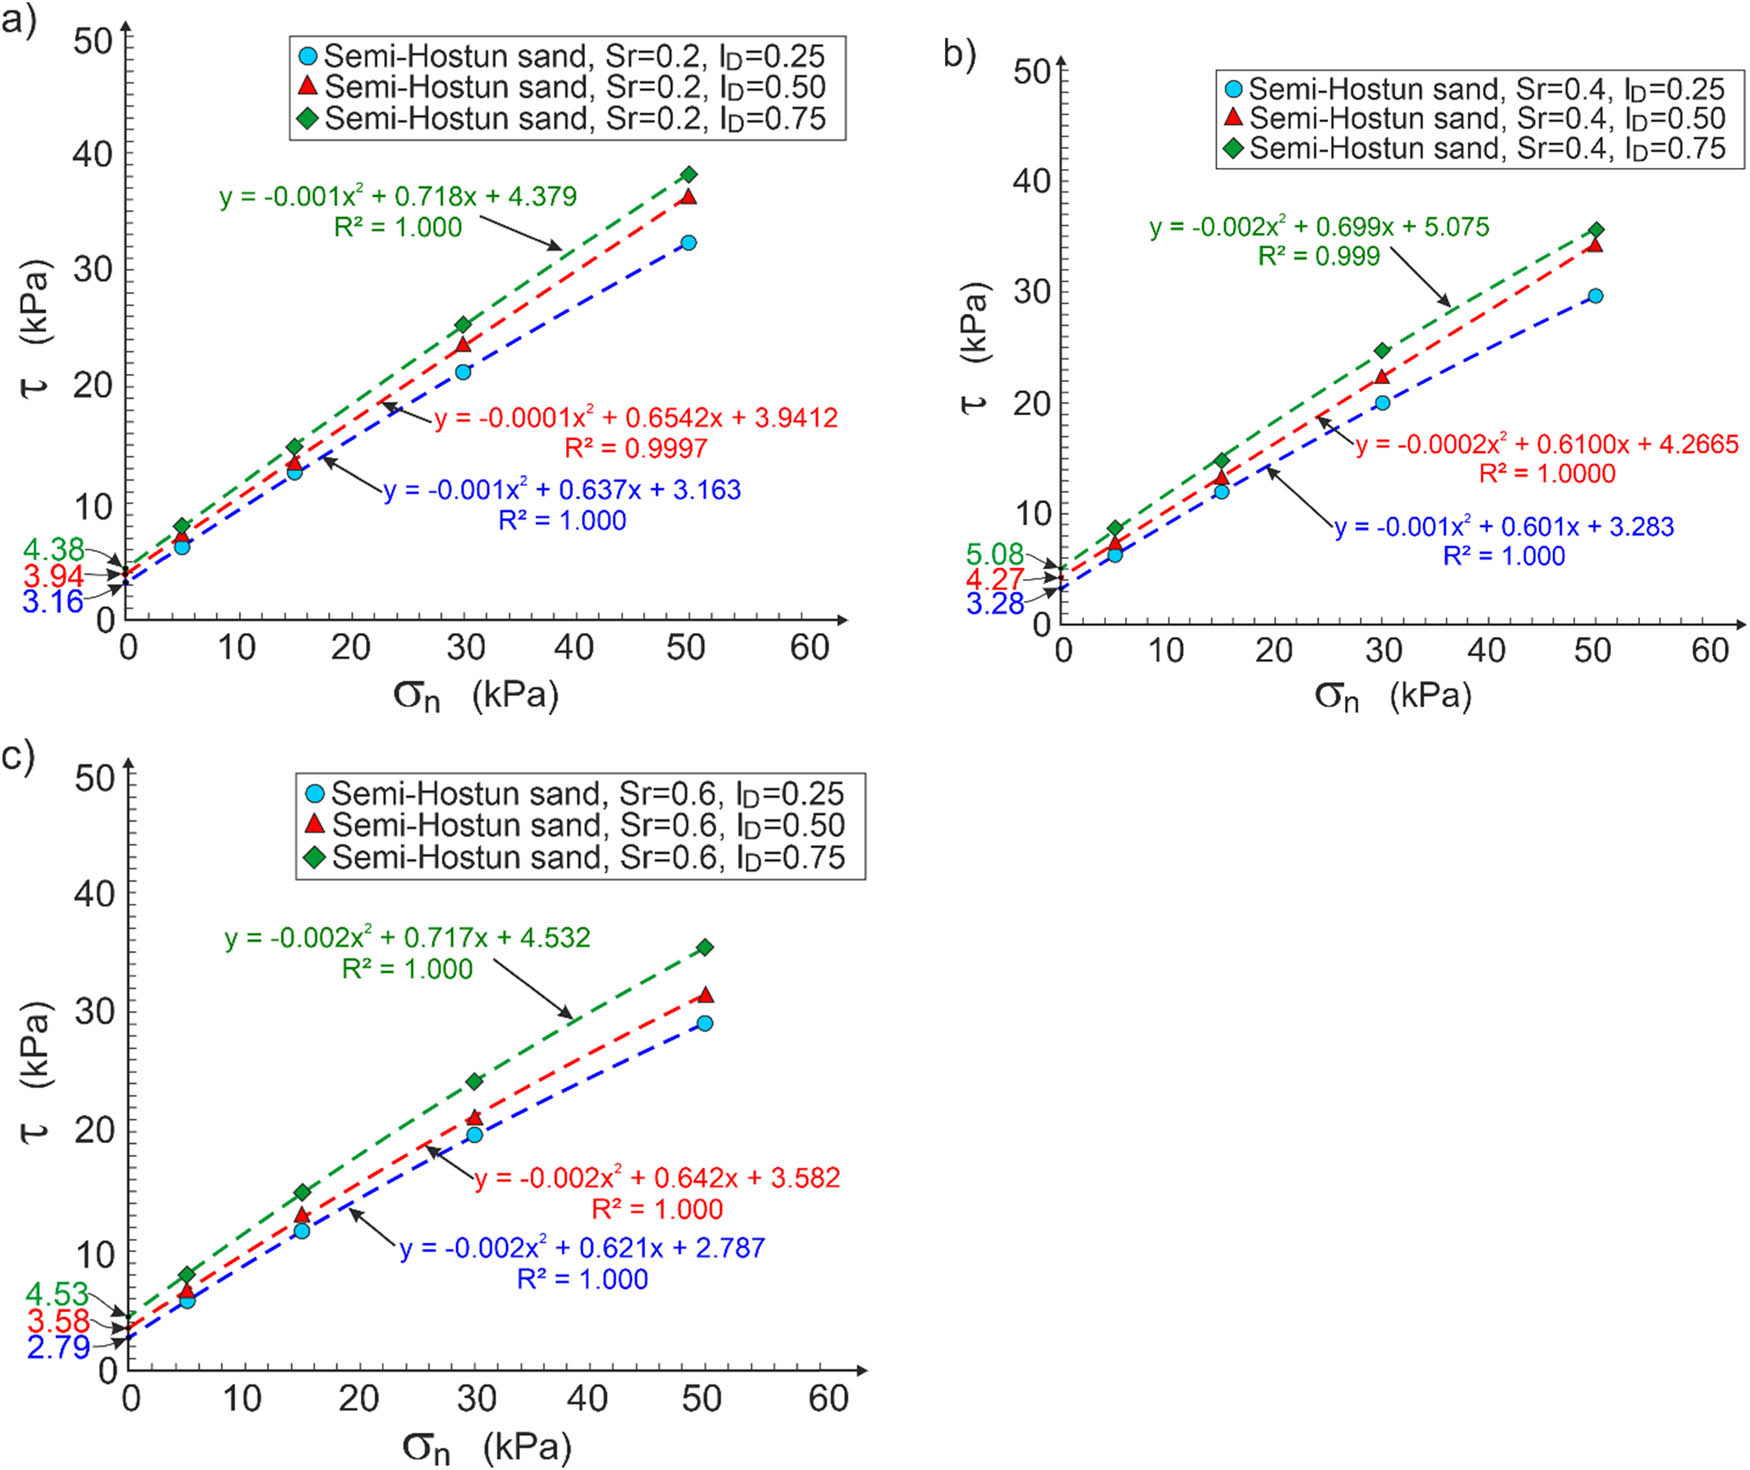
Figure 3
Apparent cohesion of semi-Hostun sand for different saturation degrees: (a) S r = 0.2; (b) S r = 0.4; and (c) S r = 0.6.
Source: Author’s contribution.
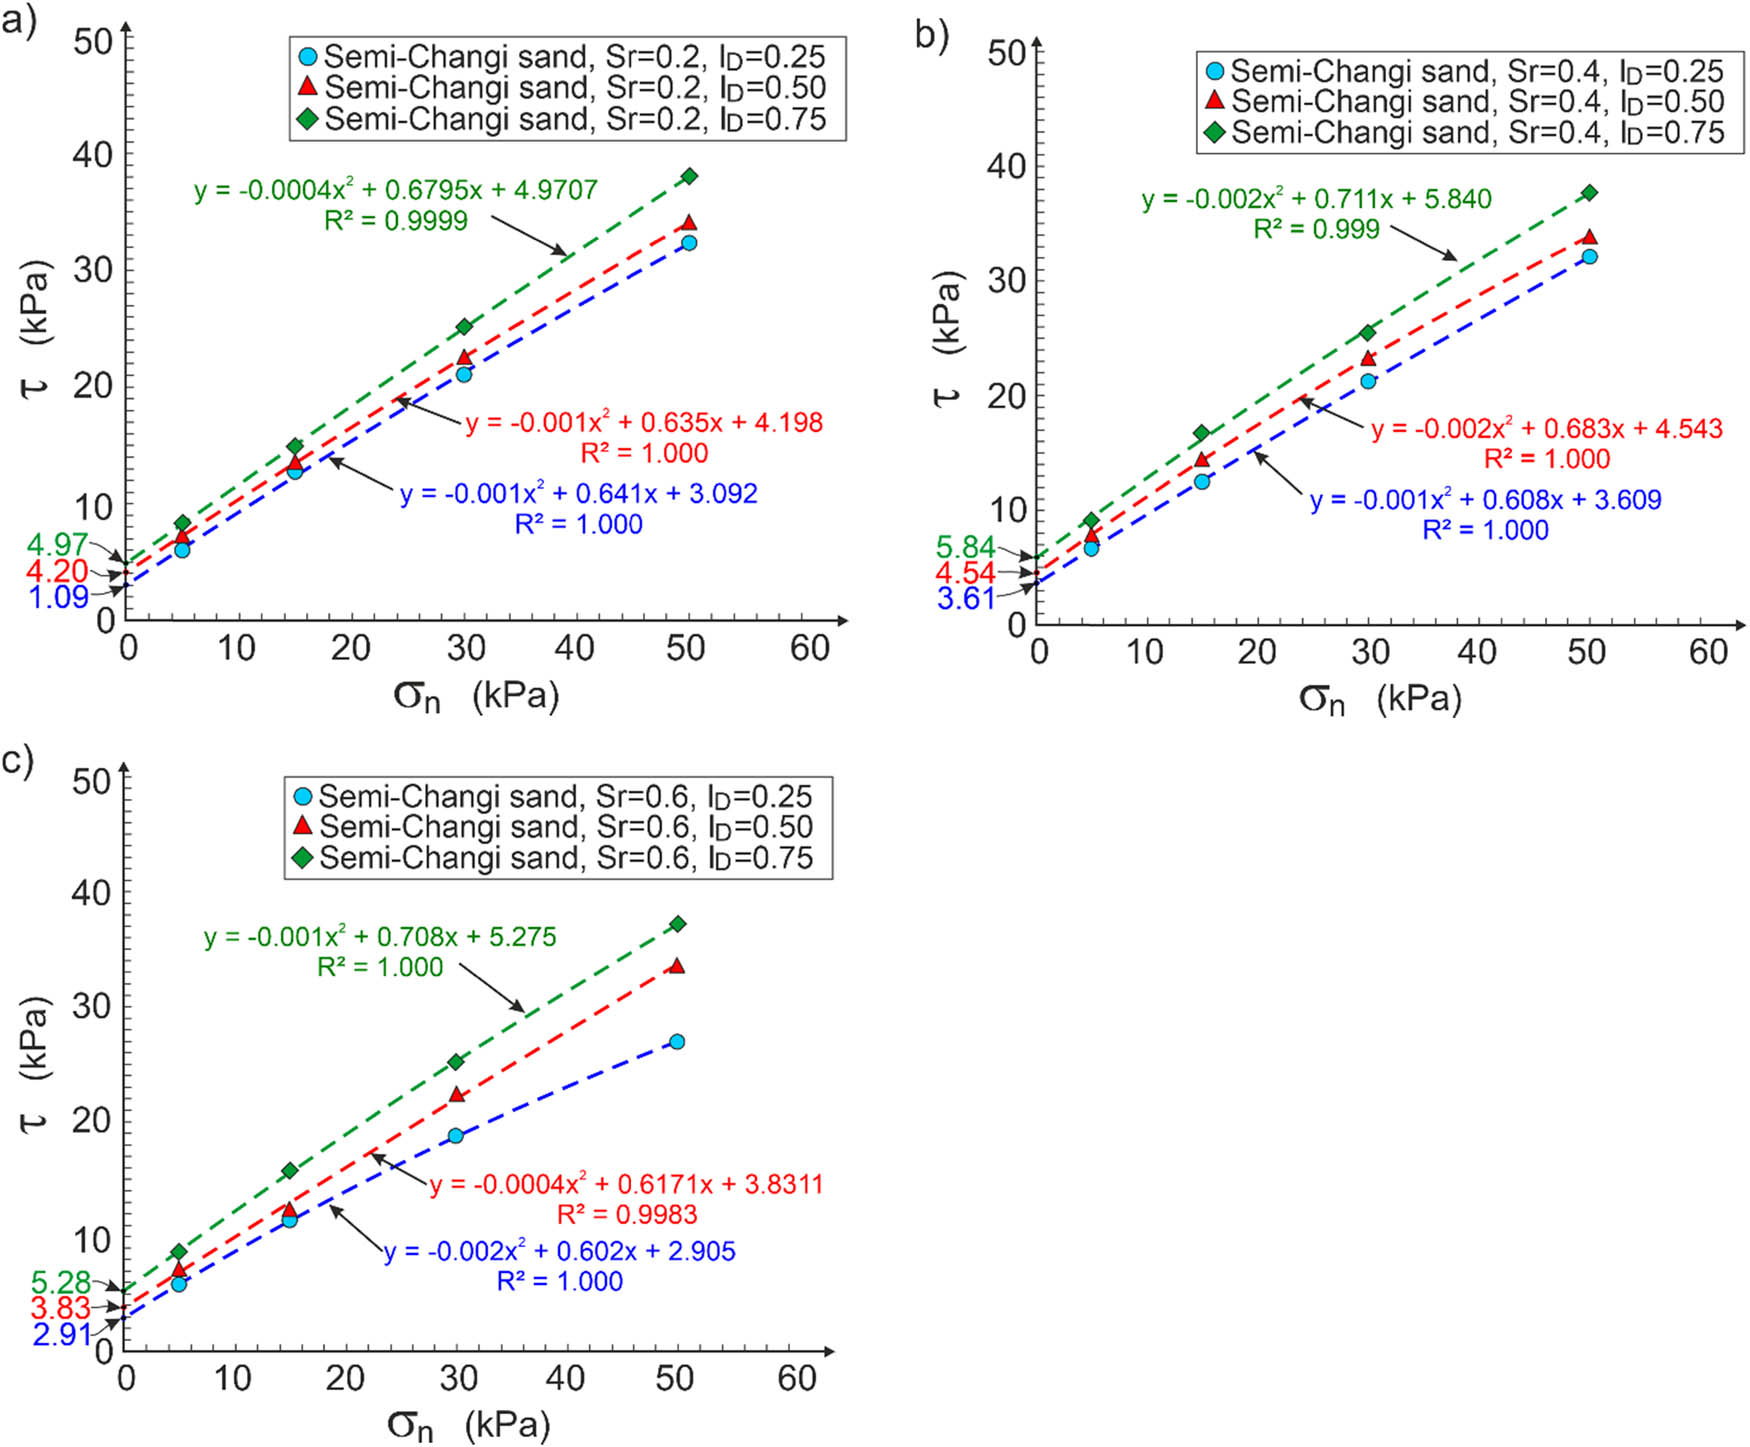
Figure 4
Apparent cohesion of semi-Changi sand for different saturation degrees: (a) S r = 0.2; (b) S r = 0.4; and (c) S r = 0.6.
Source: Author’s contribution.
Figure 5 shows the influence of the degree of saturation (S r) on the apparent cohesion (c a) of the tested sand, denoting a convex parabola.
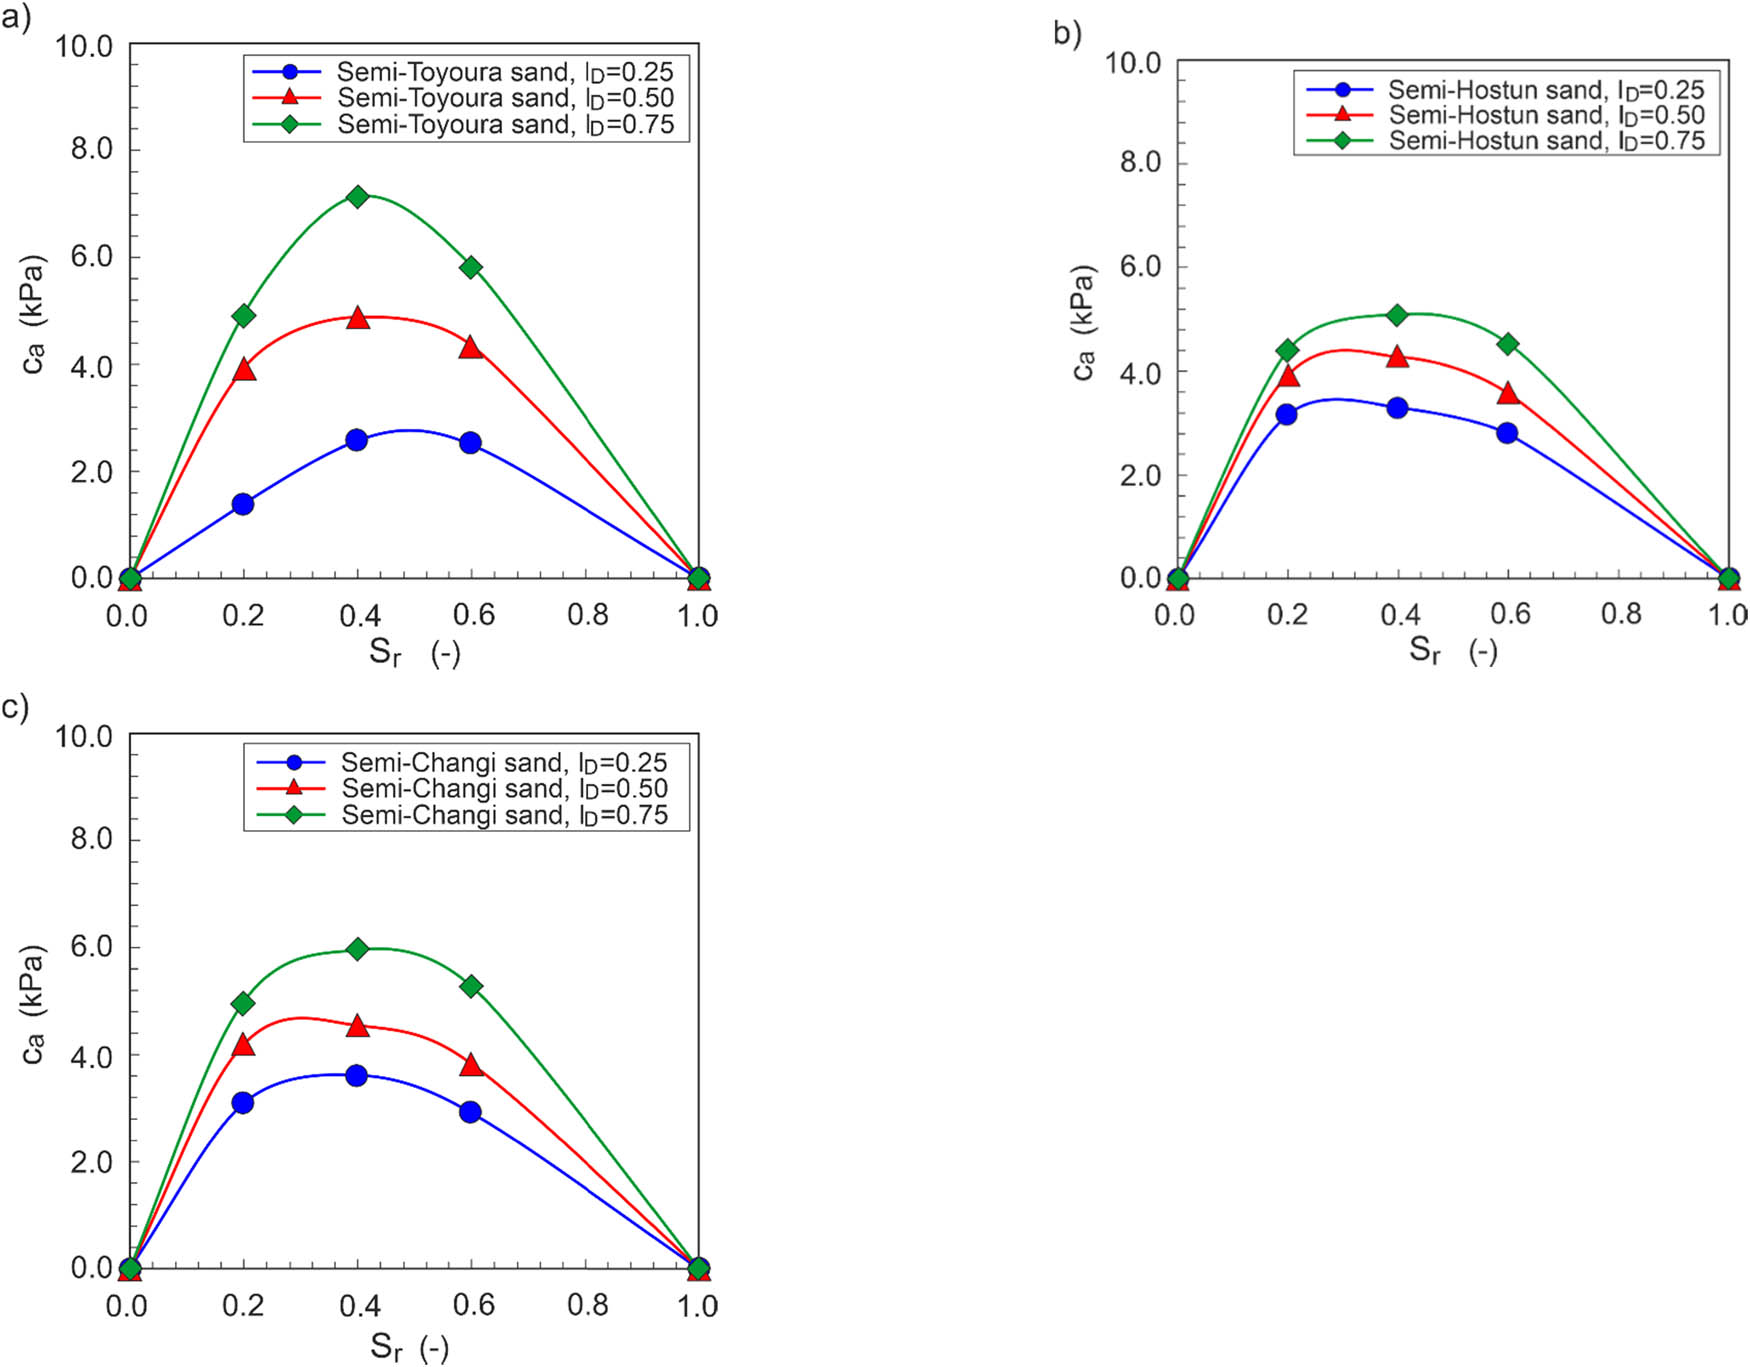
Figure 5
Dependence of apparent cohesion on the saturation degree for different sands: (a) semi-Toyoura; (b) semi-Hostun; and (c) semi-Changi.
Source: Author’s contribution.
As mentioned earlier, the apparent cohesion disappears for dry sand (S r = 0) and fully saturated sand (S r = 1), for which the capillary forces disappear. Regardless of density index (I D), the maximum apparent cohesion (c a ) was observed for all tested sands at a saturation degree of 0.4 (S r = 0.4).
A comparison of the apparent cohesion for different sands as a function of saturation (S r) and density index (I D) is shown in Figure 6.
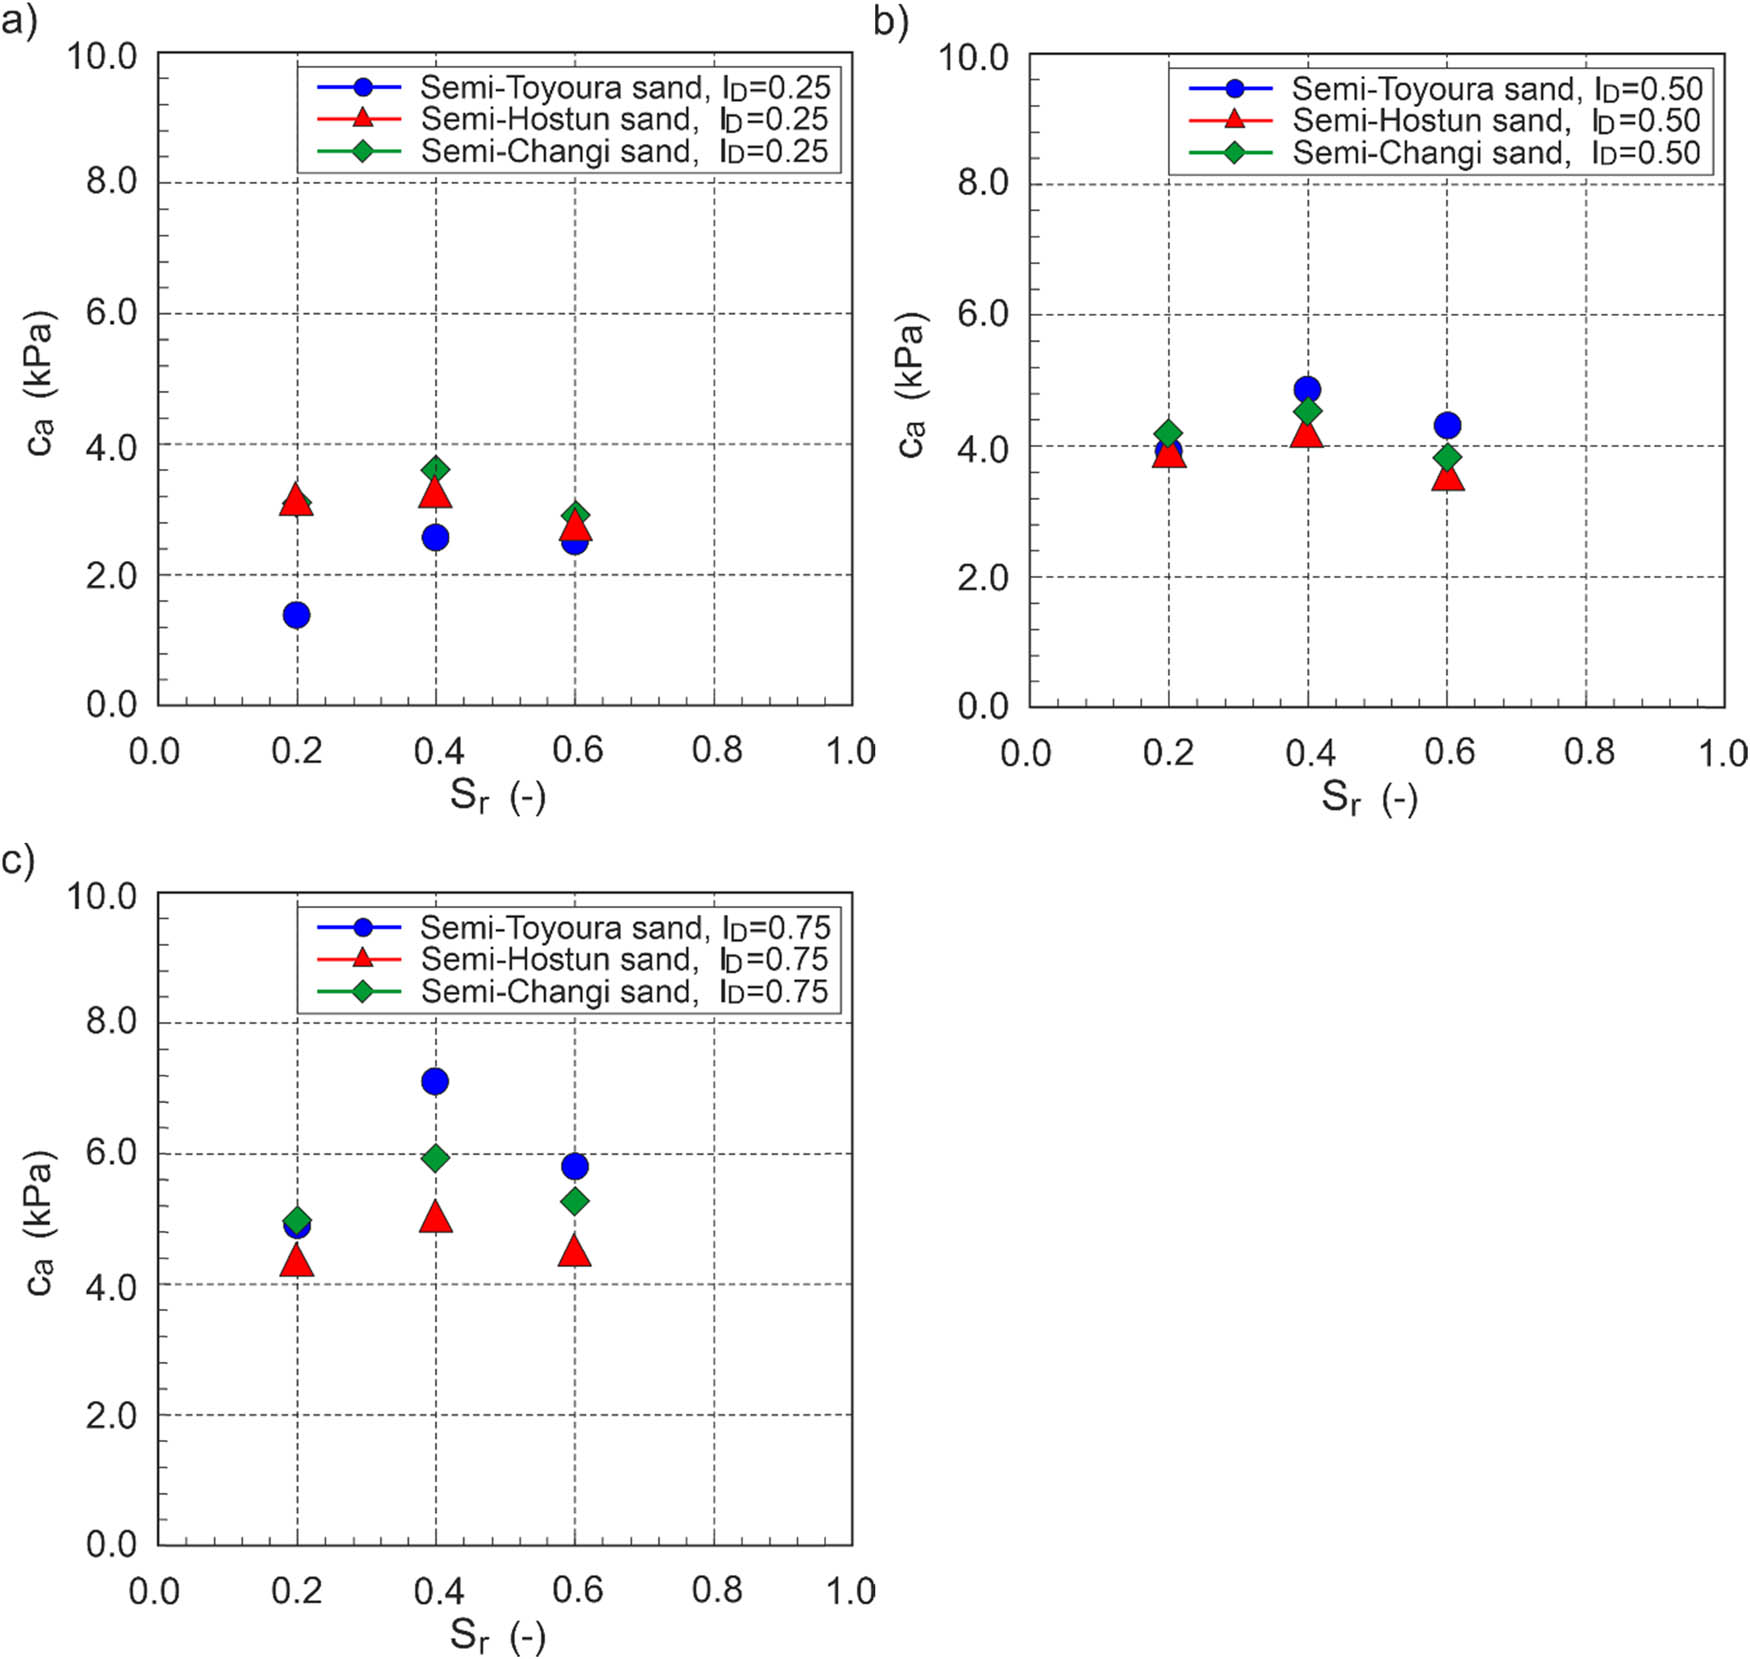
Figure 6
Dependence of the apparent cohesion of tested sands for different density indices: (a) I D = 0.25; (b) I D = 0.50; and (c) I D = 0.75.
Source: Author’s contribution.
For loose sands (I D = 0.25), the highest maximum apparent cohesion was obtained for the semi-Changi sand and the lowest for the semi-Toyoura sand (Figure 6a). For medium dense (I D = 0.50) and dense (I D = 0.75) sands, the highest apparent cohesion was observed for the semi-Toyoura sand and the lowest for the semi-Hostun sand (Figure 6b and c). This means that in addition to saturation degree (S r) and density index (I D), the effective grain size (D 10) can influence the apparent cohesion of sands based on the obtained results.
3.2. Stability of a cylindrical column
3.2.1. Theory
At failure of the cylindrical column (Figure 7a), stresses in the critical cross-section fulfil the conditions [36].
orwhere, h 0 – the experimental height of the cylindrical column.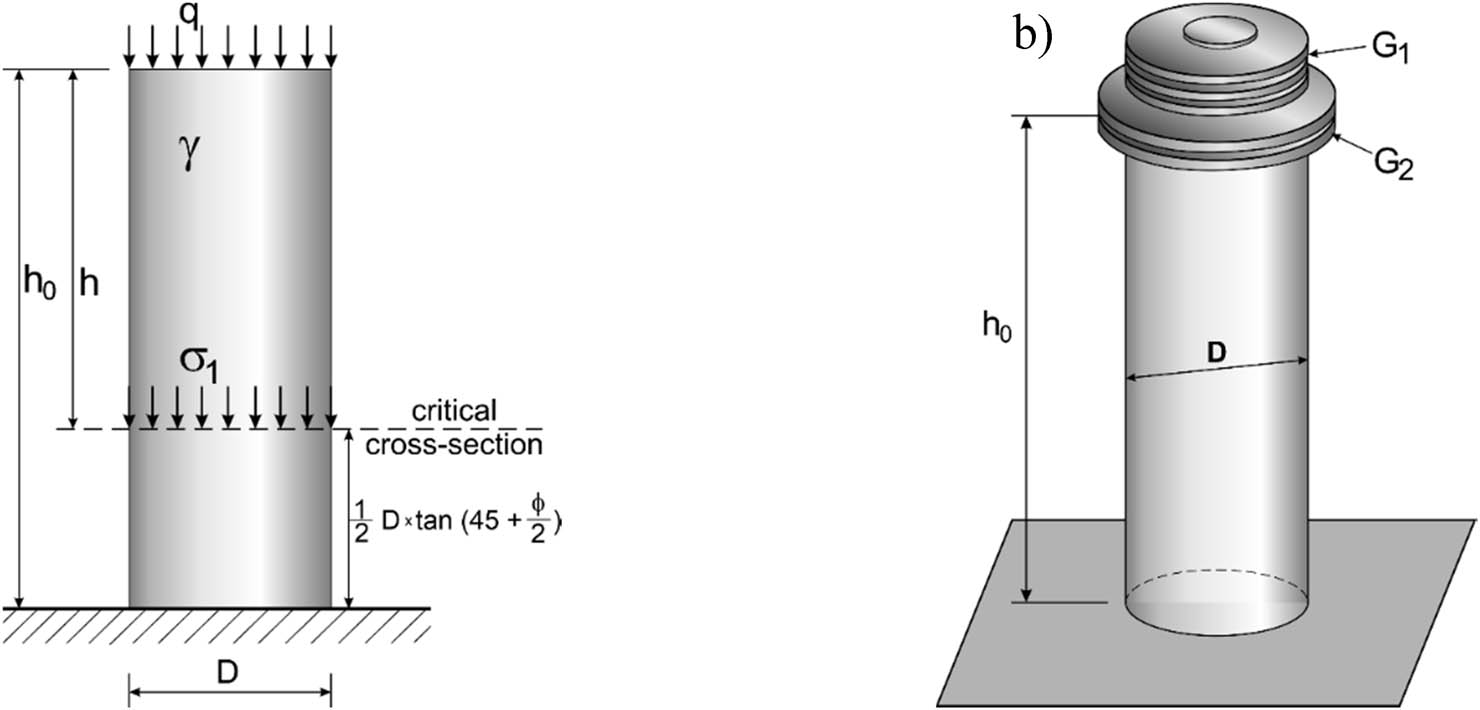
Figure 7
Sand column showing: (a) stress in the critical cross-section and (b) loading with steel plates.
Source: Author’s contribution.
The friction angle (ϕ) and unit weight of the tested sands, determined independently in accordance with PN-81/B-03020 [37], are given in Table 2. The additional load (q) on the cylindrical column, causing its collapse, was achieved by placing n1 smaller steel plates and n2 larger steel plates on the top of the column (Figure 7b).
where G 1 = 0.822 kG and G 2 = 1.663 kGTable 2
Unit weight and angle of friction of sands
| Sand | S r | Density index | ||||||||
|---|---|---|---|---|---|---|---|---|---|---|
| 0.25 | 0.50 | 0.75 | ||||||||
| γ (kN/m3) | ϕ (°) | e (-) | γ (kN/m3) | ϕ (°) | e (-) | γ (kN/m3) | ϕ (°) | e (-) | ||
| Semi-Toyoura | 0.2 | 15.36 | 29.2 | 0.794 | 16.11 | 30.4 | 0.699 | 16.95 | 31.6 | 0.604 |
| 0.4 | 16.23 | 16.92 | 17.68 | |||||||
| 0.6 | 17.10 | 17.72 | 18.42 | |||||||
| Semi-Hostun | 0.2 | 15.94 | 31.4 | 0.720 | 16.51 | 33.0 | 0.653 | 17.12 | 34.5 | 0.585 |
| 0.4 | 16.76 | 17.28 | 17.85 | |||||||
| 0.6 | 17.58 | 18.06 | 18.57 | |||||||
| Semi-Changi | 0.2 | 16.20 | 31.4 | 0.688 | 16.86 | 33.0 | 0.614 | 17.58 | 34.5 | 0.539 |
| 0.4 | 17.00 | 17.60 | 18.27 | |||||||
| 0.6 | 17.80 | 18.35 | 18.96 | |||||||
Source: Author’s contribution.
3.2.2. Experiment execution
A transparent plastic pipe with a length of 500 mm and external diameter of 100 mm was cut in half lengthwise (Figure 8a). A new pipe with average internal diameter of 94 mm was installed and lined on the inside with a transparent plastic foil (Figure 8b). The plastic foil protects against direct contact between sand and plastic pipe wall and against destruction of the sand cohesion when the half-cut plastic pipe is dismantled. The sand column with a desired relative saturation (S r) and density (I D) was treated in the pipe by filling it with a 5 cm thick layer and compacting it by tamping (Figure 8c). The half-cut pipe and the plastic foil were removed (Figure 8d), and the top of the column was levelled (Figure 8e). Then, the height of the sand column (h 0) was measured (Figure 8f) and it was gradually loaded (Figure 8g) until it failed. The observed failure mode in most sand columns is shown in Figure 8h. This means that the assumed procedure for calculating the apparent cohesion is correct.
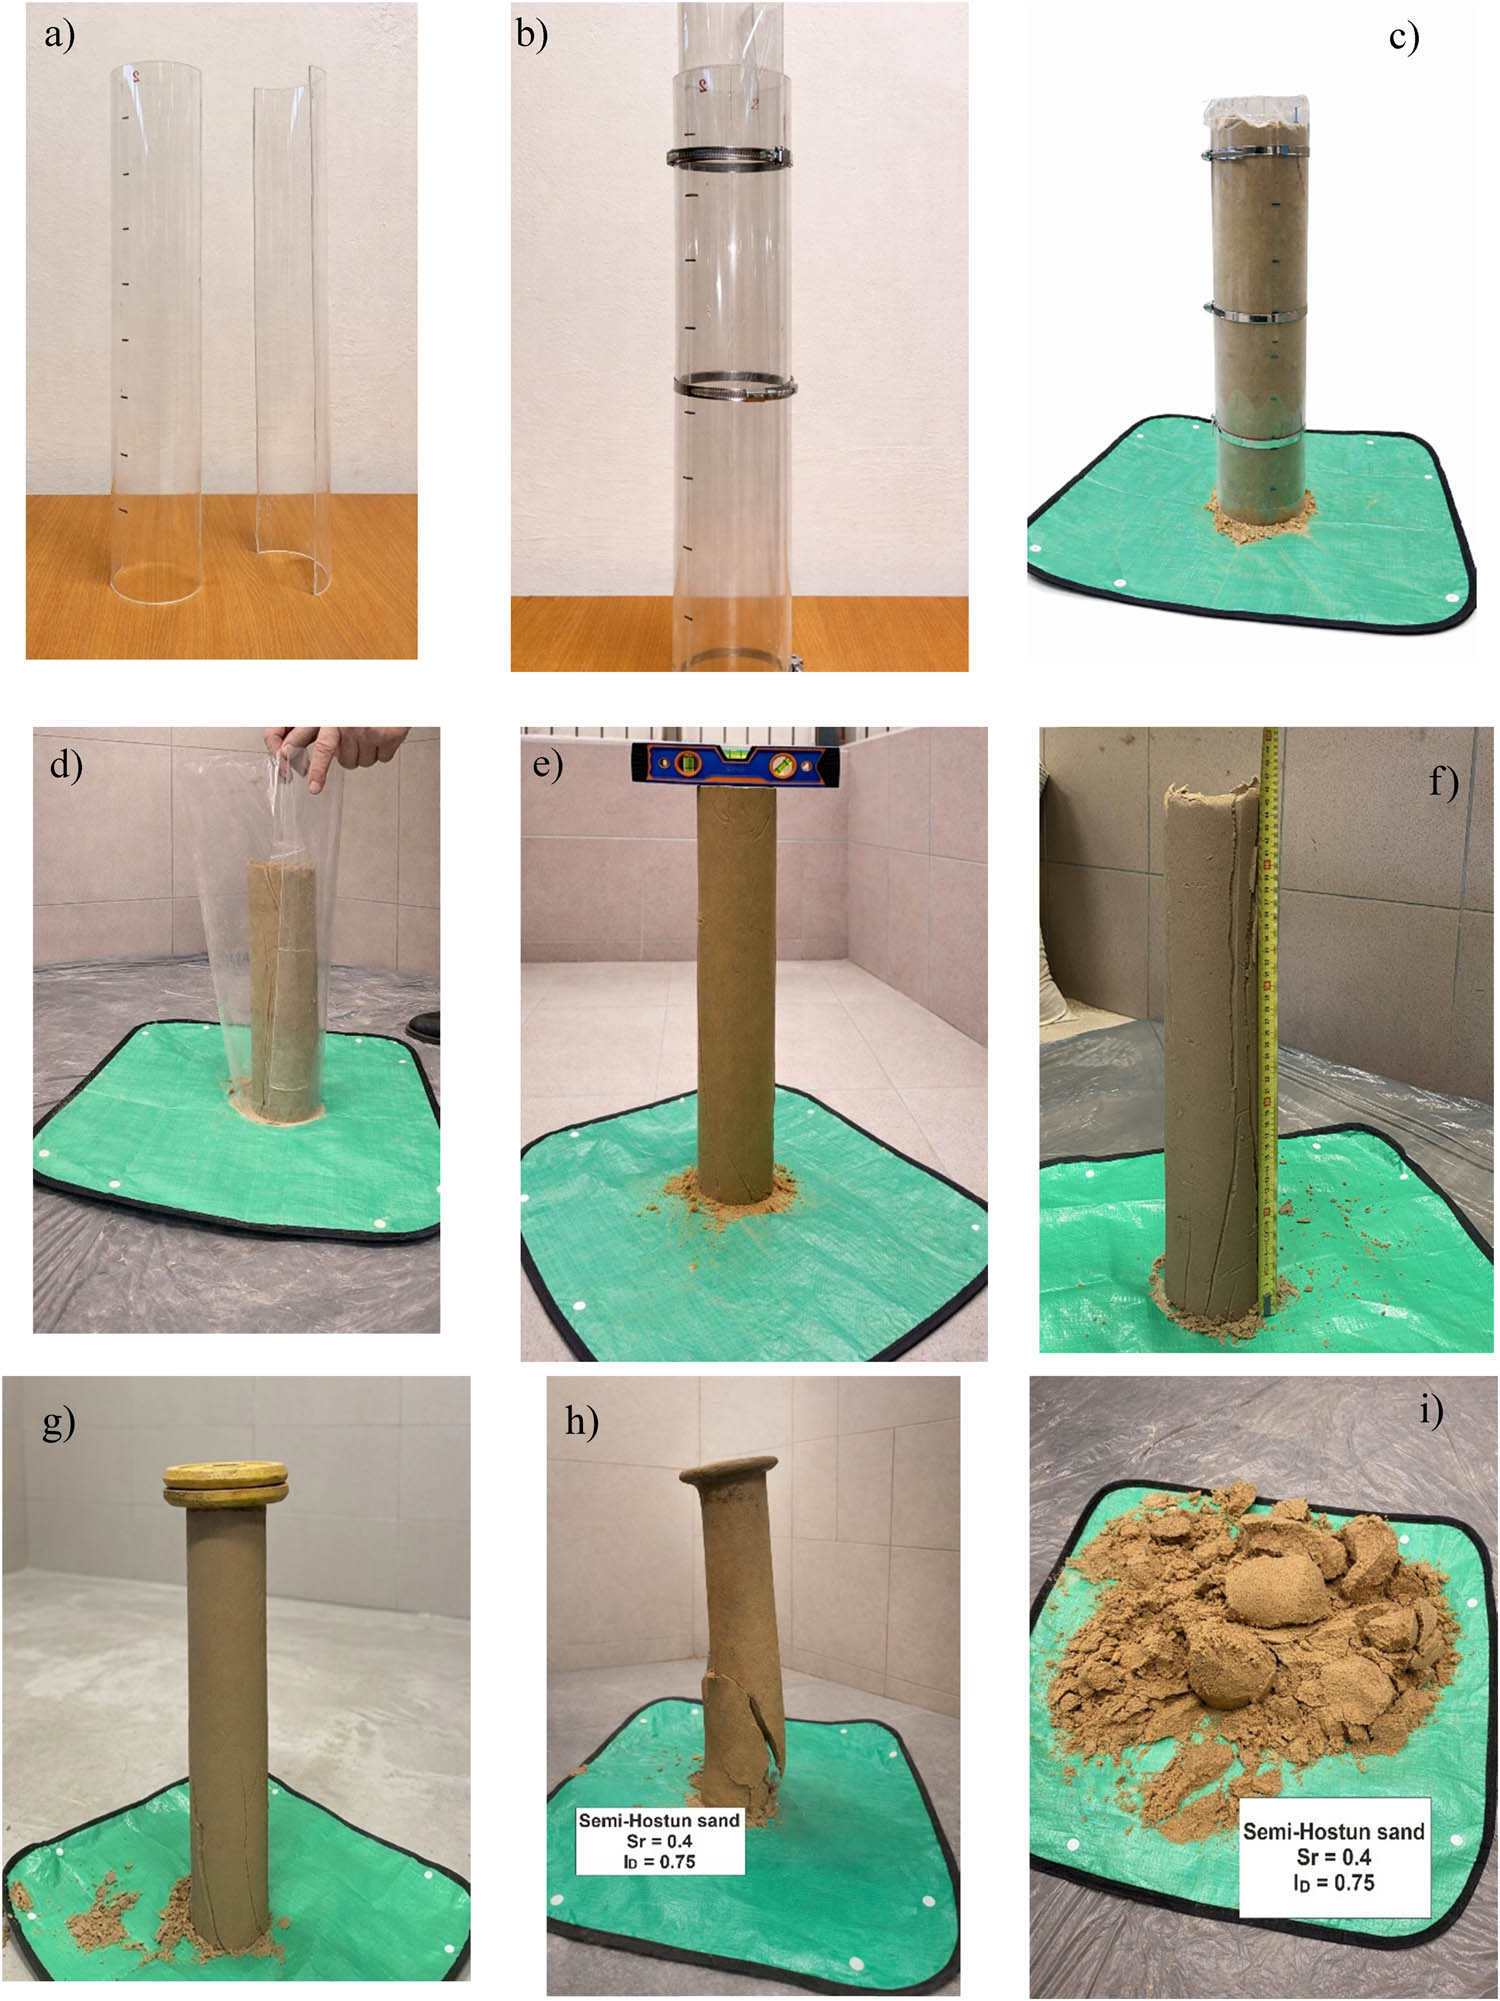
Figure 8
Stages of sand column stability testing: (a) halves of plastic pipe; (b) plastic pipe lined with plastic foil; (c) plastic pipe filled with soil; (d) dismantled plastic pipe and plastic foil; (e) levelling the top of the sand column; (f) measurement of the height of the sand column; (g) loading the sand column with steel plates; (h) initial stage of loss of sand column stability; and (i) final state of loss of stability.
Source: Author’s contribution.
4. Results
The dependence of the apparent cohesion (c a ) of the tested sands on the degree of saturation (S r ) and the sand density index (I D) obtained in the sand column stability tests is shown in Figure 9. The apparent cohesion obtained from the sand-column stability test (Figure 10) shows the same behaviour: zero in the dry and saturated states, a maximum at S r = 0.4, and an increase with density index.
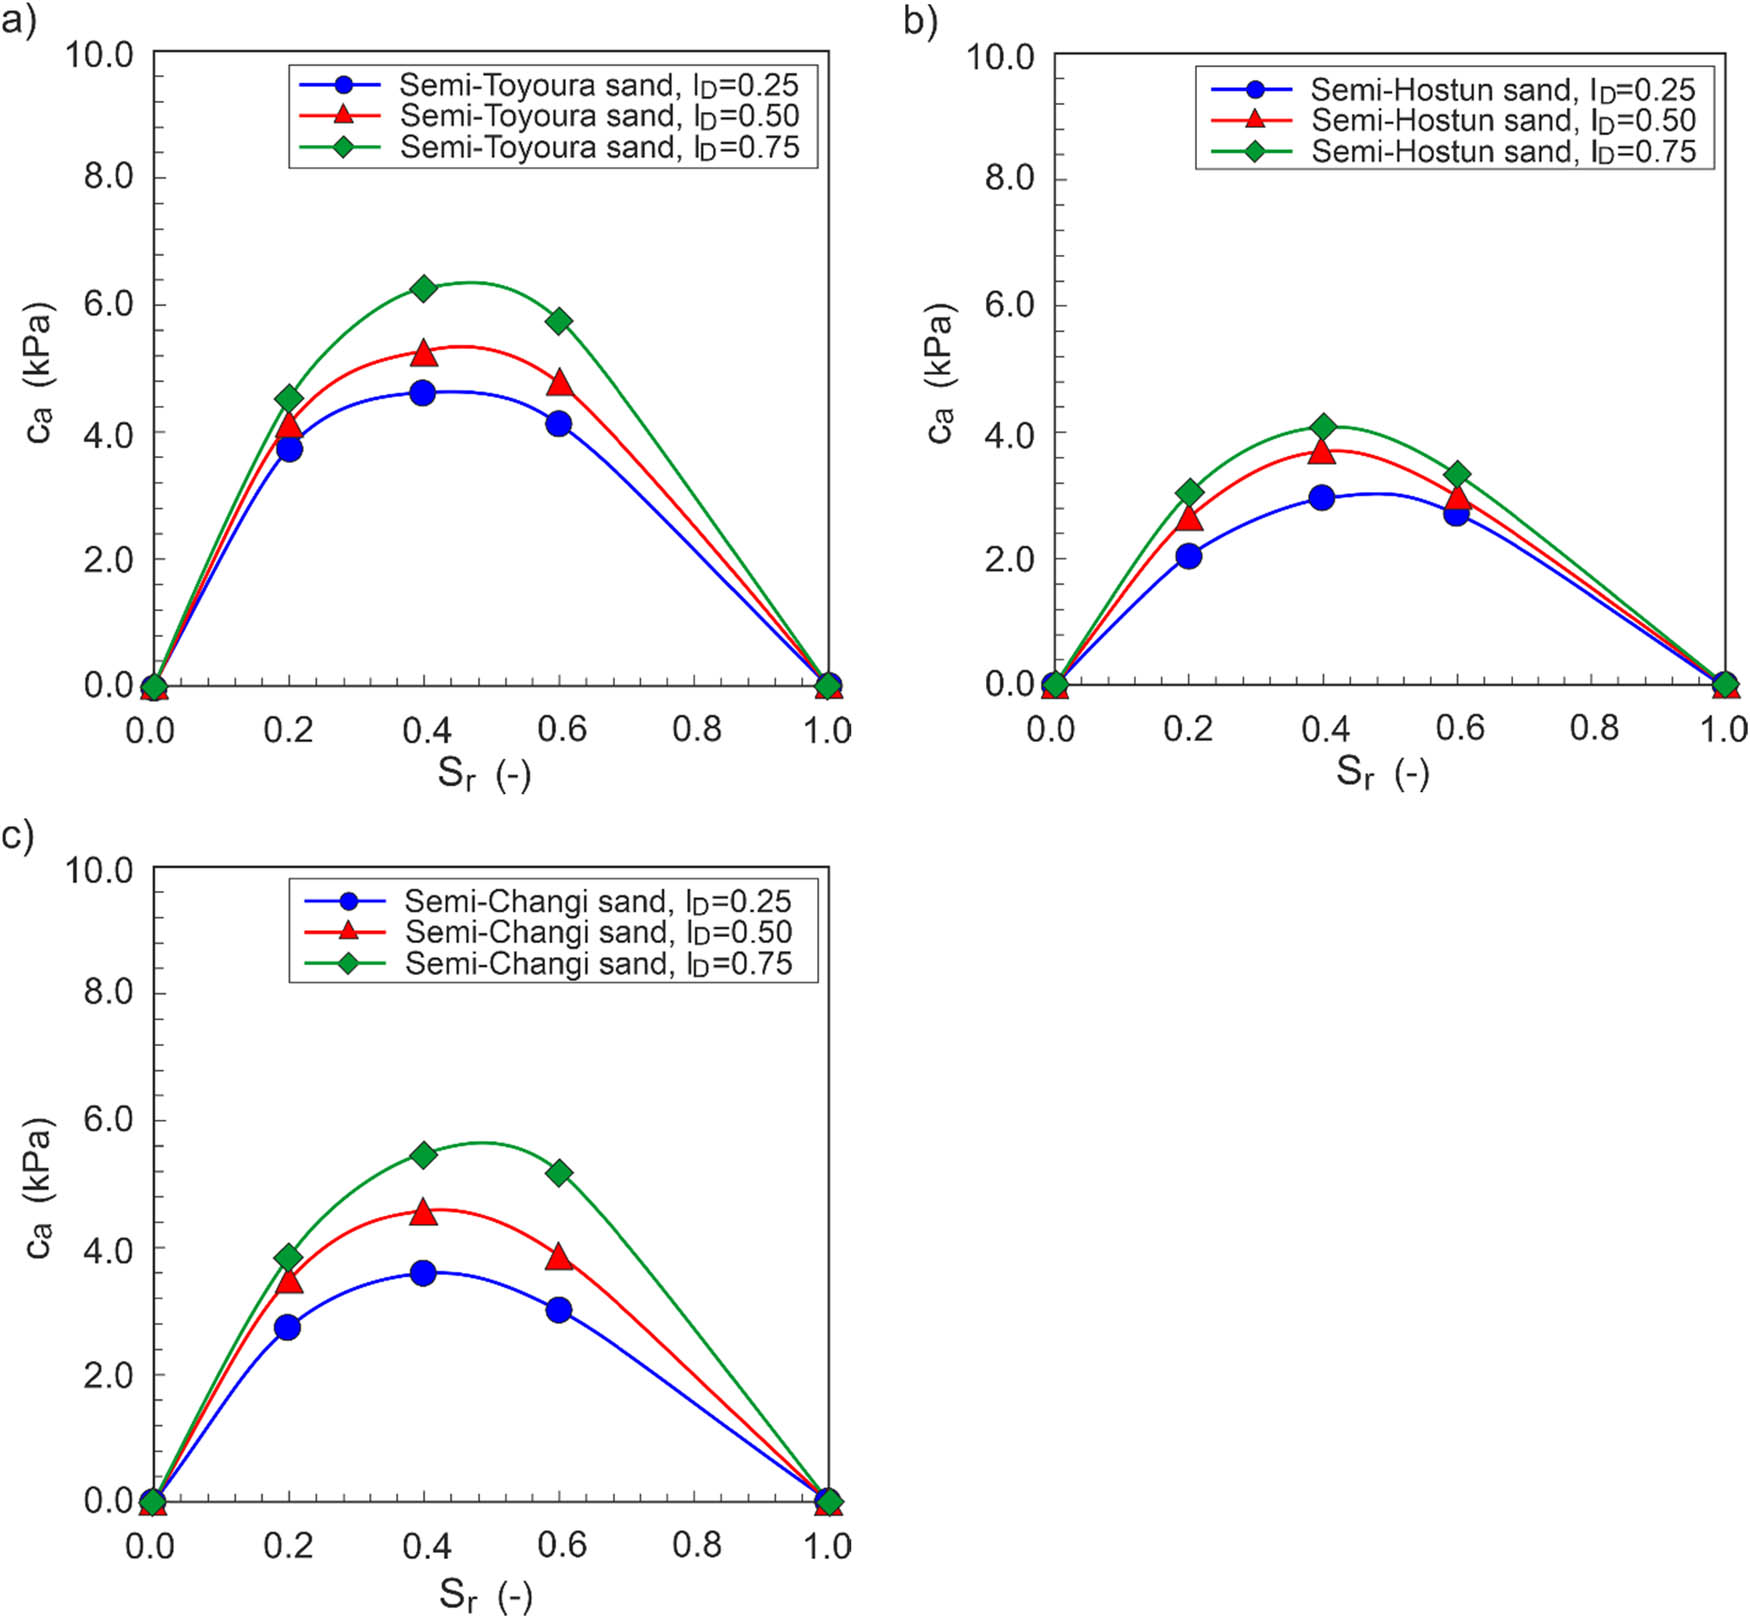
Figure 9
Dependence of apparent cohesion on saturation and density for sands: (a) semi-Toyoura; (b) semi-Hostun; and (c) semi-Changi.
Source: Author’s contribution.
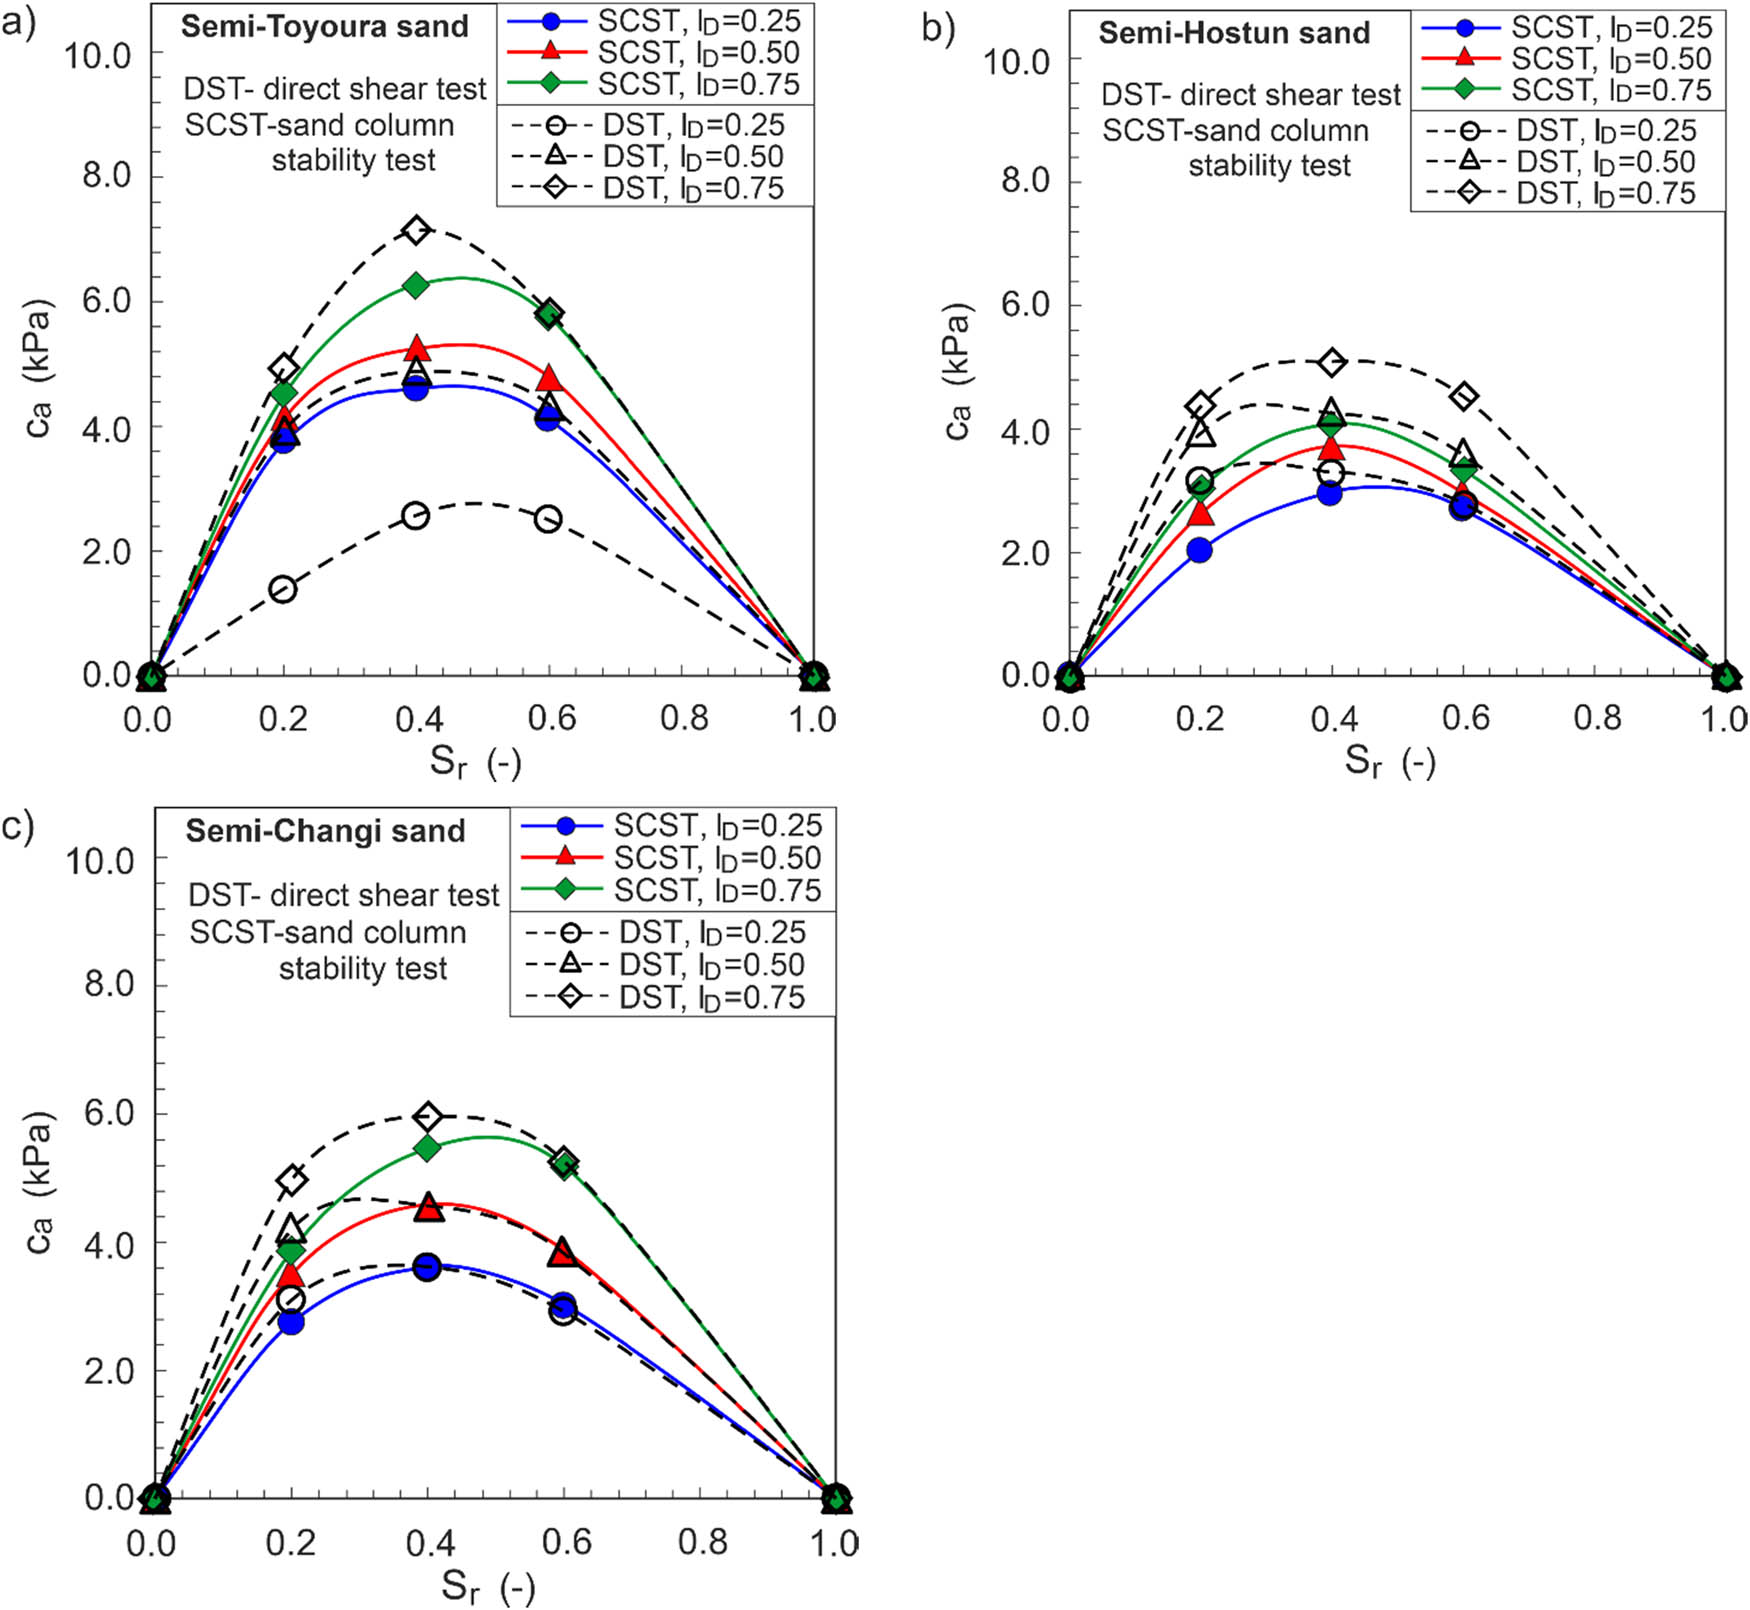
Figure 10
Comparison of apparent cohesion values obtained in sand column stability test and direct shear test for sands: (a) semi-Toyoura; (b) semi-Hostun; and (c) semi-Changi.
Source: Author’s contribution.
The column and direct shear results are in close agreement (Figure 10), the column values being slightly lower. The small offset is attributed to minor deviations from verticality of the column and to non-axial loading by the steel plates, which introduce a mildly non-uniform stress state.
The agreement supports the sand-column test as a simple, inexpensive method for evaluating the apparent cohesion of sands.
4.1 Estimation of suction and effective stress prediction
4.1.1. Estimation of SWRC and matric suction
The SWRC of each sand was predicted with the MK model [27], which requires only the grain size and void ratio, and it is well suited to clean granular soils. The degree of saturation is the sum of a capillary component S c and an adhesive component S a .
where are Macaulay brackets, with For granular soils, the parameter follows the grain size and void ratio: where D 10 is in cm, ψ is the matric suction in cm, m is the pore size distribution parameter, a c is the adhesion coefficient, ψ r is the suction at residual water content, ψ 0 is the suction at oven dryness (=107 cm), and ψ n is the normalizing suction (=1 cm) [27]. Applying these relations to the gradation curve and void ratio at each density index gives the parameters in Table 3; suction is converted from cm of water to kPa using 1 cm = 0.0981 kPa. The equivalent capillary rise (h co) is inversely proportional to e•D 10, with an additional dependence on the coefficient of uniformity, finer and/or more densely packed sands are expected to exhibit larger values of h co. Thus, the finer semi-Toyoura sand is expected to exhibit a larger h co and air-entry value (AEV) than the coarser semi-Changi and semi-Hostun sand in that order. This difference in the characteristic pore structure is relevant to the subsequent interpretation of the predicted SWRCs.4.1.2. Effective-stress interpretation
For clean quartz sand, the effective (drained) cohesion (c’) is negligible, so the measured apparent cohesion is entirely attributed to suction, which is affected by the degree of saturation. Within Bishop’s effective stress, the apparent cohesion is
whereFollowing the effective saturation closure of Vanapalli et al. [21], the air-entry-based closure given in the study Khalili and Khabbaz [18] and the upper bound are used for comparison. Combining the MK-estimated suction, the residual saturation (Table 3), and the independently determined ϕ′ (Table 2), Equation (11) predicts the apparent cohesion at every test point, and the effective parameter implied by the data is back-calculated as . c′ represents the effective (drained) cohesion (kPa); χ is the Bishop effective-stress parameter (-); ϕ′ is the effective angle of internal friction (o); S e is the effective (normalised) degree of saturation; S r,res is the residual degree of saturation (-); ψ aev is the AEV expressed as suction (kPa); χ implied is the effective-stress parameter back-calculated from the measured cohesion; and c a ,measured is the measured apparent cohesion (kPa).
Table 3
MK parameters and residual saturation for the tested sands
| Sand | I D (−) | e (−) | h co ≈ AEV (kPa) | ψ r (cm) | m (−) | S r, res (−) |
|---|---|---|---|---|---|---|
| Semi-Toyoura | 0.25 | 0.794 | 6.97 | 143 | 0.537 | 0.089 |
| 0.50 | 0.699 | 7.92 | 167 | 0.096 | ||
| 0.75 | 0.604 | 9.16 | 199 | 0.105 | ||
| Semi-Hostun | 0.25 | 0.720 | 3.43 | 61 | 0.661 | 0.094 |
| 0.50 | 0.653 | 3.78 | 69 | 0.086 | ||
| 0.75 | 0.585 | 4.22 | 79 | 0.090 | ||
| Semi-Changi | 0.25 | 0.688 | 5.00 | 96 | 0.394 | 0.081 |
| 0.50 | 0.614 | 5.61 | 110 | 0.086 | ||
| 0.75 | 0.539 | 6.39 | 129 | 0.093 |
Source: Author’s contribution.
4.1.3. Estimated suction and effective-stress prediction
The MK-predicted SWRC of the three sands (Figure 11) reproduces the expected ordering: the finer semi-Toyoura retains water to the highest suction and the coarser semi-Hostun drains first, and the estimated suctions at the tested saturations lie in the range of roughly 2–10 kPa. Substituting these suctions in equation (11) yields the predicted apparent cohesion, compared with the measured values in Table 4 and Figure 12, together with the back-calculated effective-stress parameter χ implied (Figure 13).
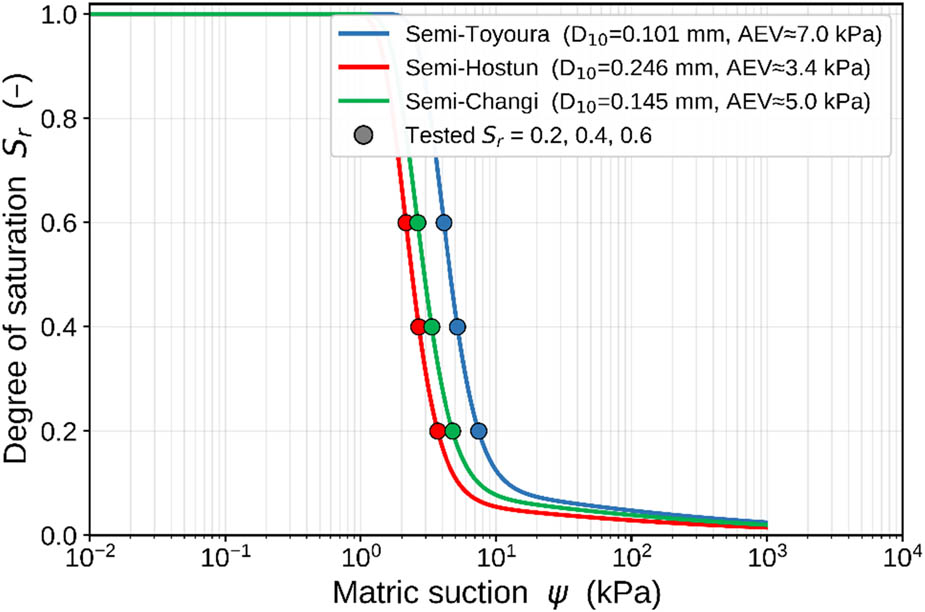
Figure 11
MK SWRCs with the tested saturations marked, air-entry ordering follows 1/D 10.
Source: Author’s contribution.
Table 4
Estimated suction, Bishop (χ = S e ) prediction, measured apparent cohesion (direct shear) and implied χ
| Sand | I D (−) | S r (−) | ψ (kPa) | S e (−) | c a pred (kPa) | c a meas. DST (kPa) | χ implied (−) |
|---|---|---|---|---|---|---|---|
| Semi-Toyoura | 0.25 | 0.2 | 7.45 | 0.12 | 0.51 | 1.38 | 0.33 |
| 0.4 | 5.20 | 0.34 | 0.99 | 2.56 | 0.88 | ||
| 0.6 | 4.12 | 0.56 | 1.29 | 2.51 | 1.09 | ||
| 0.50 | 0.2 | 8.67 | 0.12 | 0.59 | 3.92 | 0.77 | |
| 0.4 | 5.96 | 0.34 | 1.18 | 4.87 | 1.39 | ||
| 0.6 | 4.70 | 0.56 | 1.54 | 4.32 | 1.57 | ||
| 0.75 | 0.2 | 10.38 | 0.11 | 0.68 | 4.92 | 0.77 | |
| 0.4 | 6.98 | 0.33 | 1.42 | 7.13 | 1.66 | ||
| 0.6 | 5.48 | 0.55 | 1.86 | 5.82 | 1.73 | ||
| Semi-Hostun | 0.25 | 0.2 | 3.70 | 0.13 | 0.29 | 3.16 | 1.40 |
| 0.4 | 2.68 | 0.35 | 0.57 | 3.28 | 2.01 | ||
| 0.6 | 2.15 | 0.56 | 0.74 | 2.79 | 2.12 | ||
| 0.50 | 0.2 | 4.12 | 0.12 | 0.33 | 3.94 | 1.47 | |
| 0.4 | 2.97 | 0.34 | 0.66 | 4.27 | 2.21 | ||
| 0.6 | 2.38 | 0.56 | 0.87 | 3.58 | 2.32 | ||
| 0.75 | 0.2 | 4.66 | 0.12 | 0.39 | 4.38 | 1.37 | |
| 0.4 | 3.33 | 0.34 | 0.78 | 5.08 | 2.22 | ||
| 0.6 | 2.67 | 0.56 | 1.03 | 4.53 | 2.47 | ||
| Semi-Changi | 0.25 | 0.2 | 4.77 | 0.13 | 0.38 | 3.09 | 1.06 |
| 0.4 | 3.33 | 0.35 | 0.71 | 3.61 | 1.77 | ||
| 0.6 | 2.63 | 0.56 | 0.91 | 2.90 | 1.81 | ||
| 0.50 | 0.2 | 5.45 | 0.12 | 0.44 | 4.20 | 1.19 | |
| 0.4 | 3.76 | 0.34 | 0.84 | 4.54 | 1.86 | ||
| 0.6 | 2.96 | 0.56 | 1.08 | 3.83 | 1.99 | ||
| 0.75 | 0.2 | 6.36 | 0.12 | 0.52 | 4.97 | 1.14 | |
| 0.4 | 4.33 | 0.34 | 1.01 | 5.96 | 2.00 | ||
| 0.6 | 3.39 | 0.56 | 1.30 | 5.28 | 2.26 |
Source: Author’s contribution.
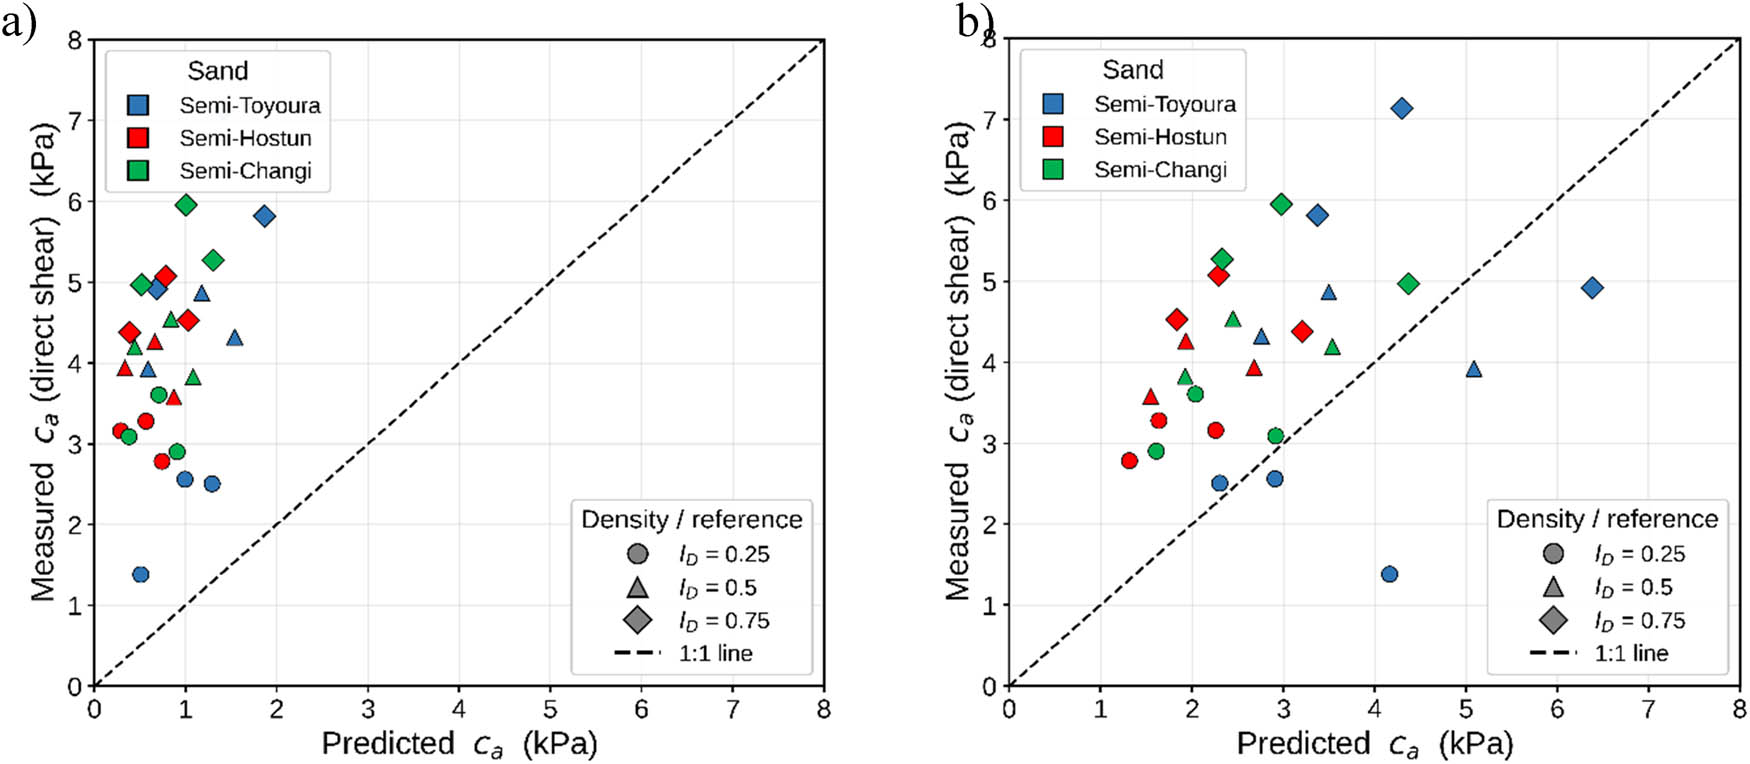
Figure 12
Measured vs predicted apparent cohesion (27 points): (a) χ = S e (Vanapalli) and (b) χ = 1.
Source: Author’s contribution.
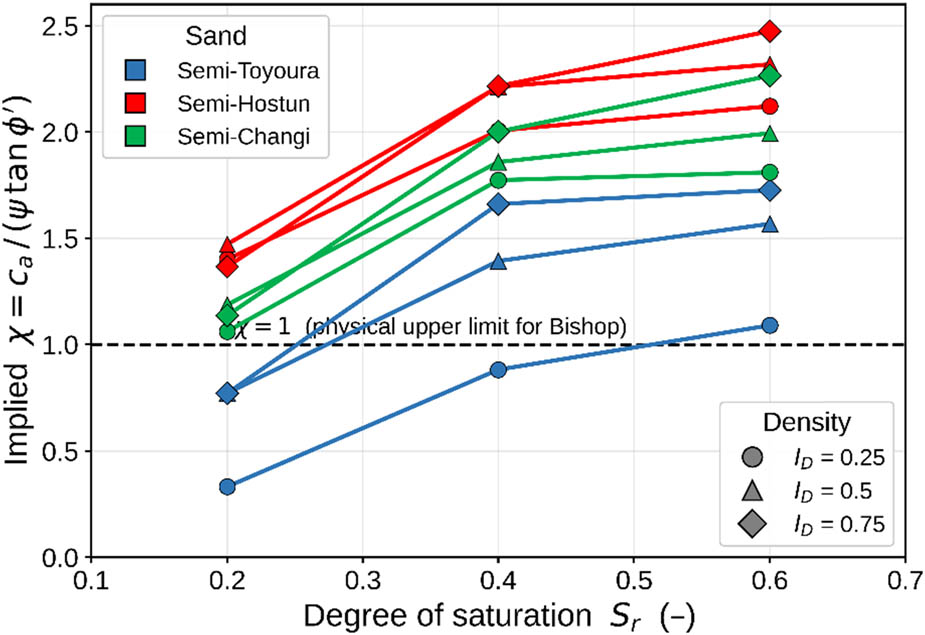
Figure 13
Effective-stress parameter χ implied by the measured cohesion.
Source: Author’s contribution.
5. Discussion
The maximum apparent cohesion was observed to be at the intermediate saturation, S r = 0.4, which is consistent with the physics of wet granular media. In the pendular regime at low saturation, water occupies isolated menisci, which increase with water content and increasing the aggregate capillary force. As the funicular regime is approached, the bridges begin to merge, and the suction falls, so the cohesion passes through a maximum and then decreases towards zero at full saturation [24–26]. It was observed that at density indices of 0.50 and 0.75, the finest sand (semi-Toyoura) develops the greatest apparent cohesion and the coarsest (semi-Hostun) the least. This is explained mechanistically by the pore structure rather than asserted from correlation. The equivalent capillary rise in the MK model scales a , so a smaller effective grain size produces smaller pores, a higher AEV and higher suction at a given saturation (Table 3), and therefore a larger suction contribution to strength.
Qualitatively, the Bishop framework predicted apparent cohesion vanishes at S r = 0 and 1, and the sand ranking follows the retention behaviour. Quantitatively, however, the χ = S e closure underpredicts the measured cohesion, and even the physical upper bound χ = 1 underpredicts on average. Correspondingly, the effective-stress parameter back-calculated from the data exceeds unity in most of the cases (Figure 13). A true Bishop χ cannot exceed one, this indicates that the generic MK suction underestimates the actual suction in these sands, and/or that funicular capillary-bridge forces contribute to the measured cohesion beyond the macroscopic χψ term. Either way, the effective-stress interpretation captures the trends but cannot be closed quantitatively without measured suction; this is a concrete, data-based demonstration of the importance of suction measurement rather than a rejection of the framework. The comparison also shows why a single macroscopic closure with a monotonic SWRC cannot reproduce the S r = 0.4 maximum, which is a funicular-regime feature. A bimodal or micro-mechanical treatment [26,30] would be required to capture both the magnitude and the peak location.
The measured apparent cohesion of a few kilopascals is sufficient to stabilise steep sand faces, shallow excavations, and contributes to bearing capacity and tunnel-face stability in unsaturated sandy ground [13,38]. However, because it is suction-derived, it is transient such that at total saturation (e.g., during rainfall when S r = 1), the apparent cohesion vanishes, as the present data illustrate.
6. Conclusion
The apparent cohesion of sand can be determined by direct shear and sand column stability tests.
In a direct shear test, a slightly higher apparent cohesion was obtained than in the sand column stability test.
The apparent cohesion of the tested sands increases with increasing density index. The maximum apparent cohesion values were obtained for a saturation degree of 0.4 (S r = 0.4).
Semi-Toyoura sand has maximum, semi-Changi average, and semi-Hostun minimum apparent cohesion for medium dense and dense sands. This means that the apparent cohesion follows the effective grain size D 10 as explained by the capillarity rise scaling .
Apparent cohesion is suction driven; hence, it is only relevant in unsaturated conditions. Direct measurement of matric suction is recommended to validate the retention curves and to close the effective-stress analysis quantitatively.
Acknowledgements
The investigations were conducted at the Bialystok University of Technology, Poland. This work was supported by Polish financial resources for science under project no. WI/WB-IIL/4/2025.
Funding information
This work was supported by Polish financial resources for science under project no. WI/WB-IIL/4/2025.
Author contributions
The author was responsible for the conceptualization, methodology, investigation, data collection, formal analysis, interpretation of the results, and preparation of the original manuscript. The author also reviewed and approved the final version of the manuscript.
Conflict of interest statement
Authors state no conflict of interest.
Data availability statement
The data supporting the findings of this study are available from the corresponding author upon reasonable request.