
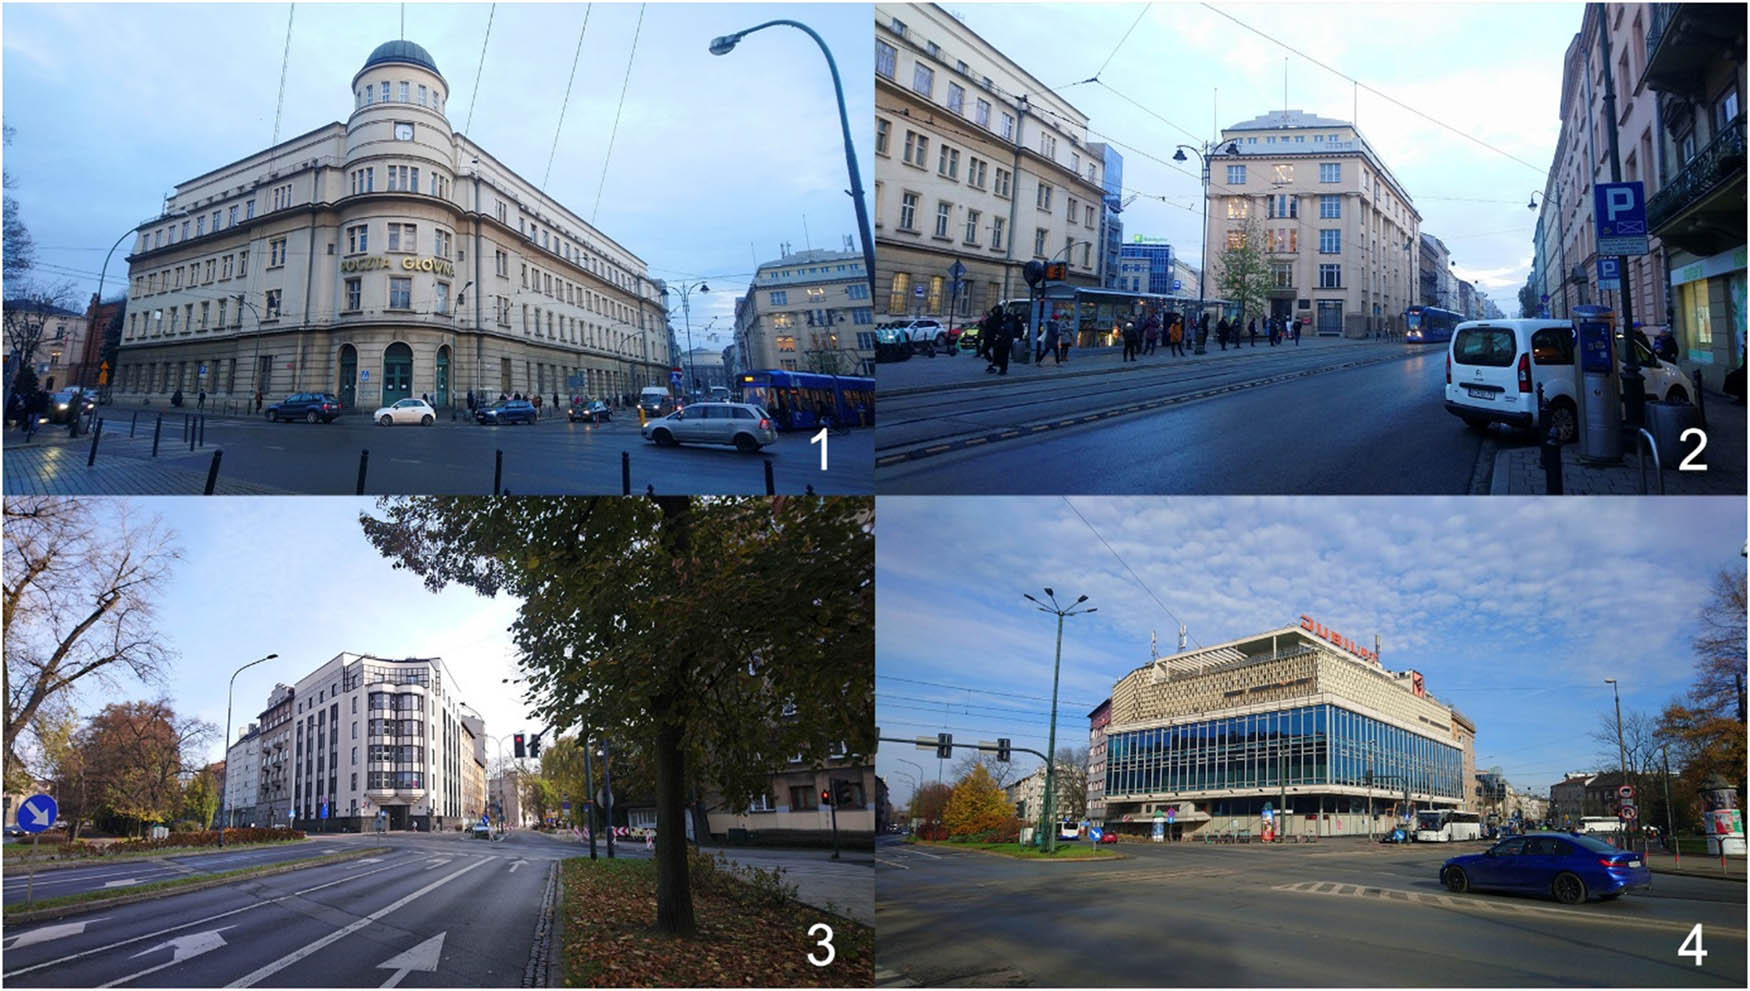
Figure 1
Examples of the corner buildings. (1) The Main Post Office at the intersection of Westerplatte, Wielopole, and Starowiślna streets. (2) The Press Palace at the intersection of Westerplatte, Wielopole, and Starowiślna streets. (3) The residential building for Jagiellonian University professors at the corner of Słowackiego avenue and Łobzowska street. (4) The Jubilat department store at the intersection of Krasińskiego avenue and Zwierzyniecka streets.
Source: Author.
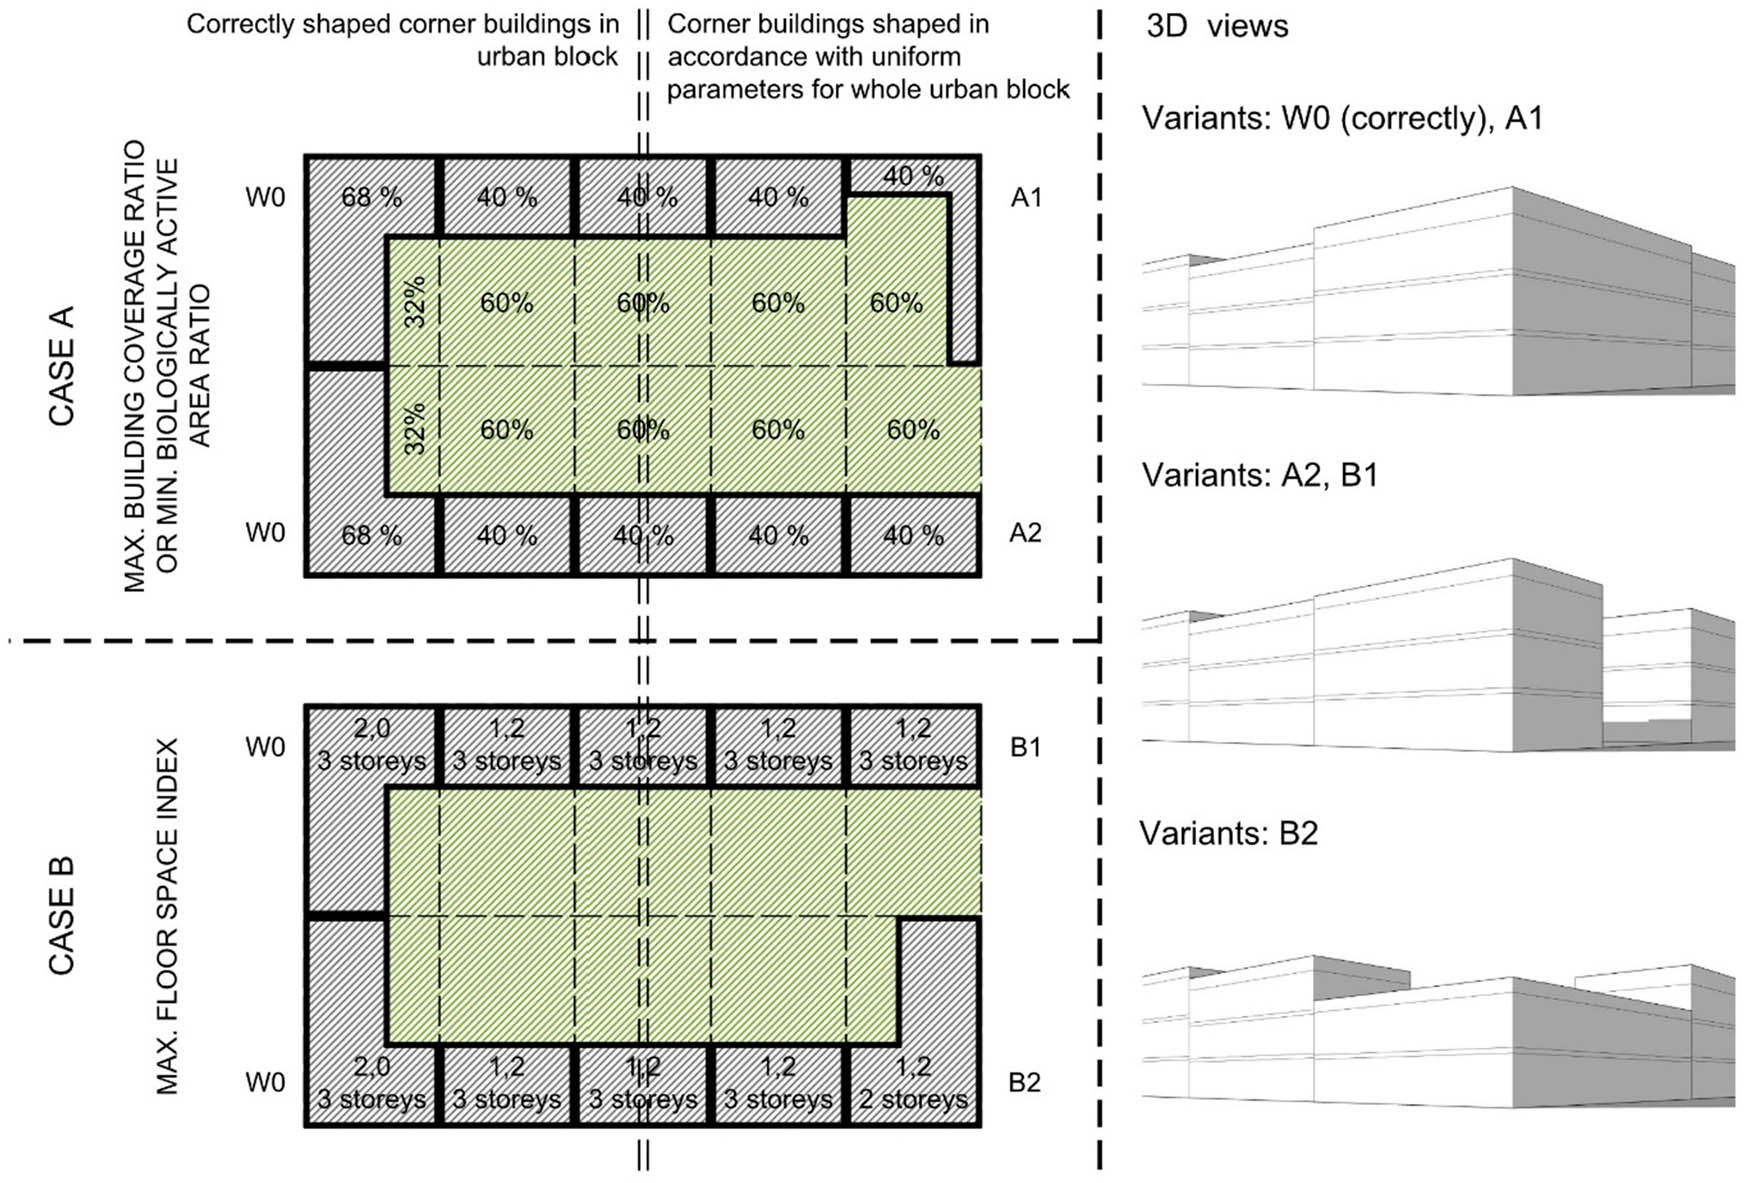
Figure 2
Diagram of the impact of the local spatial development plan on corner building shape. Case (A) shows a situation where a minimum biologically active area ratio or maximum building coverage ratio is defined. Case (B) illustrates the impact of the floor space index on design decisions.
Source: Author.
Table 1
Summary of all the examples studied
| No. | City | Location (GPS coordinates) | Defined parameters | Other | Problem | |||||
|---|---|---|---|---|---|---|---|---|---|---|
| PZ | PB | I | LZ | Wk | Wm | |||||
| 1 | Brzeg | 50.8587, 17.4583 | 50% | 20% | 1.0–2.5 | — | 5 | 23 | — | Yes |
| 2 | Chełmno | 53.3477, 18.4244 | 80% | 0% | 0.0–45 | — | — | 8 | — | y/n |
| 3 | Gdańsk | 54.4000, 18.6687 | — | 30% | — | — | — | 18 | — | y/n |
| 4 | Gdynia | 54.5169, 18.5421 | 60%/72%n | 20%/0%n | — | Yes | 5/6n | 18/21n | — | No |
| 5 | Gdynia | 54.5103, 18.5391 | 60%/72%n | 20%/0%n | — | Yes | 5/6n | 18/21n | Yes | No |
| 6 | Gliwice | 50.2925, 18.6576 | 70% | 20% | min. 1.3 | — | 5 | — | — | y/n |
| 7 | Jaworzno | 50.2051, 19.2779 | 70% | 10% | — | — | 3 | — | — | y/n |
| 8 | Kalisz | 51.7593, 18.0786 | 40% | 25% | 0.1–0.4 | — | 3 | — | — | Yes |
| 9 | Katowice | 50.2536, 19.0221 | 60% | 5% | 2.4–3.0 | Yes | 4–5 | 23.2 | — | Yes |
| 10 | Kraków | 50.0527, 19.9207 | 80% | 5% | — | — | — | 19 | — | y/n |
| 11 | Kraków | 50.0513, 19.9281 | 60% | 40% | — | — | — | 16 | — | Yes |
| 12 | Kraków | 50.0483, 19.9462 | — | 24% | 0.1–3.7 | — | — | 20 | — | Yes |
| 13 | Kraków | 50.0729, 19.9343 | — | 16% | 2.5–3.5 | — | — | 20 | Yes | No |
| — | 16% | 3.0–5.6 | — | — | 22 | |||||
| — | 16% | 2.5–3.5 | — | — | 20 | |||||
| — | 16% | 4.0–5.0 | — | — | 23 | |||||
| 14 | Kraków | 50.0708, 19.9598 | 40% | 50% | — | — | — | 15 | — | Yes |
| 15 | Kraków | 50.0443, 19.9193 | — | 40% | — | — | — | — | Yes | Other |
| 16 | Kraków | 50.0631, 19.9312 | — | 20% | 1.0–3.5 | — | — | 20 | — | Yes |
| 17 | Kraków | 50.0727, 19.9190 | — | 24% | 1.5–5.0 | Yes | — | 21 | Yes | y/n |
| 18 | Kraków | 50.0623, 19.9340 | — | — | — | — | — | — | Yes | No |
| 19 | Kraków | 50.0437, 19.9483 | — | 20% | 1.0–4.5 | Yes | — | 25 | Yes | Yes |
| 20 | Kraków | 50.0384, 19.9419 | — | 20% | 1.2–4.0 | — | — | 21 | — | Yes |
| 21 | Kraków | 50.0562, 19.9414 | — | 16% | 0.1–4.6 | — | — | 20 | — | Yes |
| 22 | Kraków | 50.0337, 19.9438 | 60% | 15% | — | — | — | 15 | Yes | No |
| 23 | Kraków | 50.0595, 19.9497 | — | 30% | 0.1–3.5 | — | — | 20/25 | — | Yes |
| 24 | Kraków | 50.0631, 19.9459 | — | 16% | 0.1–3.7 | — | — | 22 | — | Yes |
| 25 | Kraków | 50.0473, 19.9532 | — | 30% | 1.35–5.0 | Yes | — | 17 | — | Yes |
| 26 | Łomża | 53.1783, 22.0809 | 50% | 10% | — | — | 2 | — | — | Yes |
| 27 | Łódź | 51.7734, 19.4466 | 85% | 5% | 1.0–4.5 | — | — | 23 | — | No |
| 28 | Mysłowice | 50.2436, 19.1406 | 75% | 10% | 1.1–4.5 | Yes | 6 | 20 | — | y/n |
| 29 | Nowy Targ | 49.4803, 20.0230 | 80% | 20% | — | — | — | 4 | — | No |
| 30 | Opole | 50.6703, 17.9287 | — | 30% | — | — | 5 | — | Yes | y/n |
| 31 | Szczecin | 53.4300, 14.5457 | 60% | 14% | — | — | — | 18.5 | — | Yes |
| 32 | Warszawa | 52.2042, 21.0210 | 60% | 20% | 0.0–2.5 | — | — | 24 | — | Yes |
| 33 | Wrocław | 51.1019, 17.0508 | — | 30%* | — | — | — | 22 | Yes | No |
| 34 | Wrocław | 51.1188, 17.0295 | 80%/85% | — | — | — | — | 25 | Yes | No |
Defined parameters: PZ – maximum building coverage ratio; PB – minimum biologically active area ratio; I – permissible floor space index; LZ – obligatory or non-exceedable building line within the interior of an urban block; Wk – maximum building height in number of storeys; Wm – maximum building height in meters; Other – other parameters or local conditions influencing the development of corner plots; Problem – problem with the possibility of shaping corner buildings; n – applies to corner plots.
Problem: Yes – the problem occurs; y/n – the problem occurs, but scale was mitigated by the parameters permitting intensive development in the local spatial plan or by other conditions; No – the problem does not occur.
* at a distance of 25 m from the boundary lines.
Source: Author’s contribution.
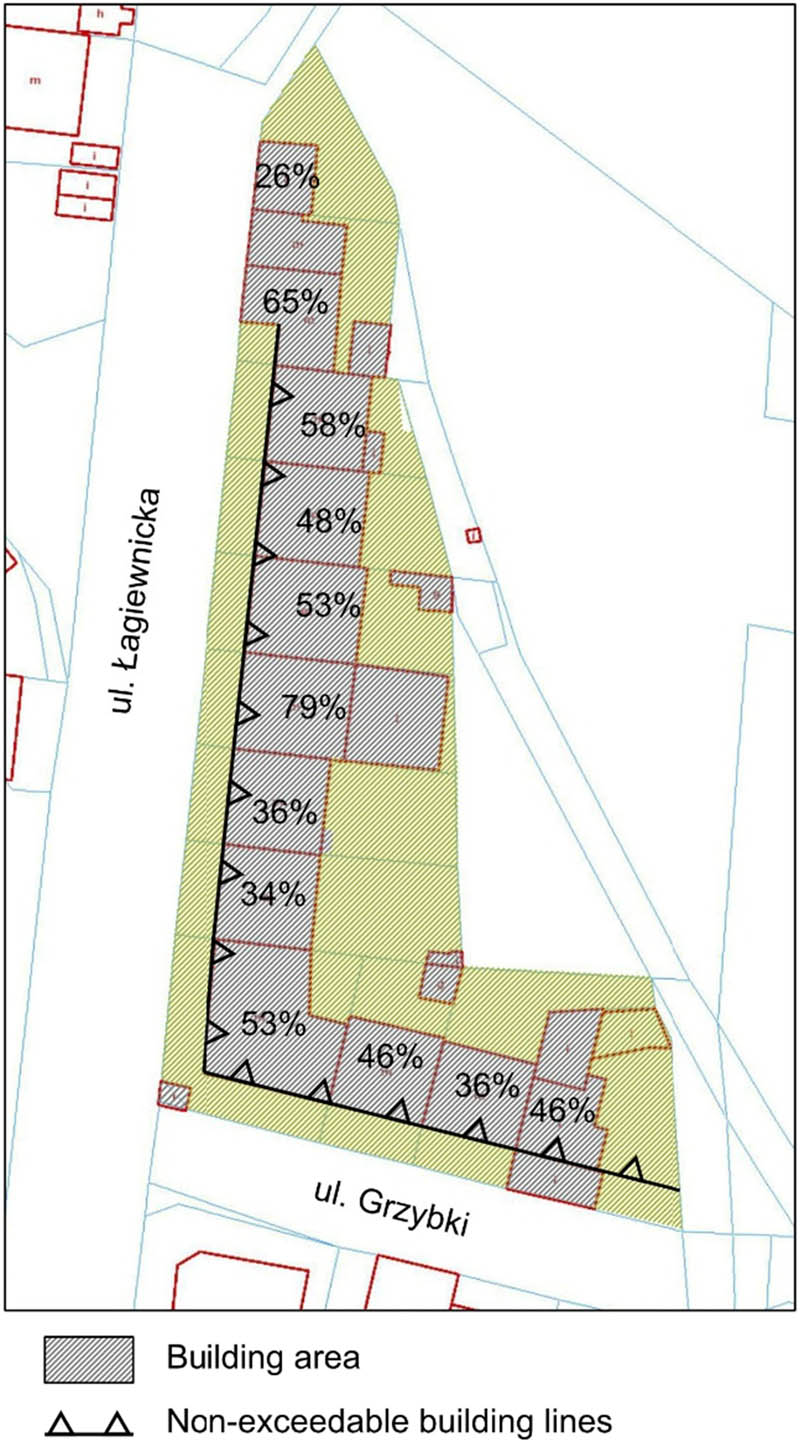
Figure 3
Example from Kraków: Wadowicka-Tischnera Area.
Source: Author, Basemap: https://www.geoportal.gov.pl/.
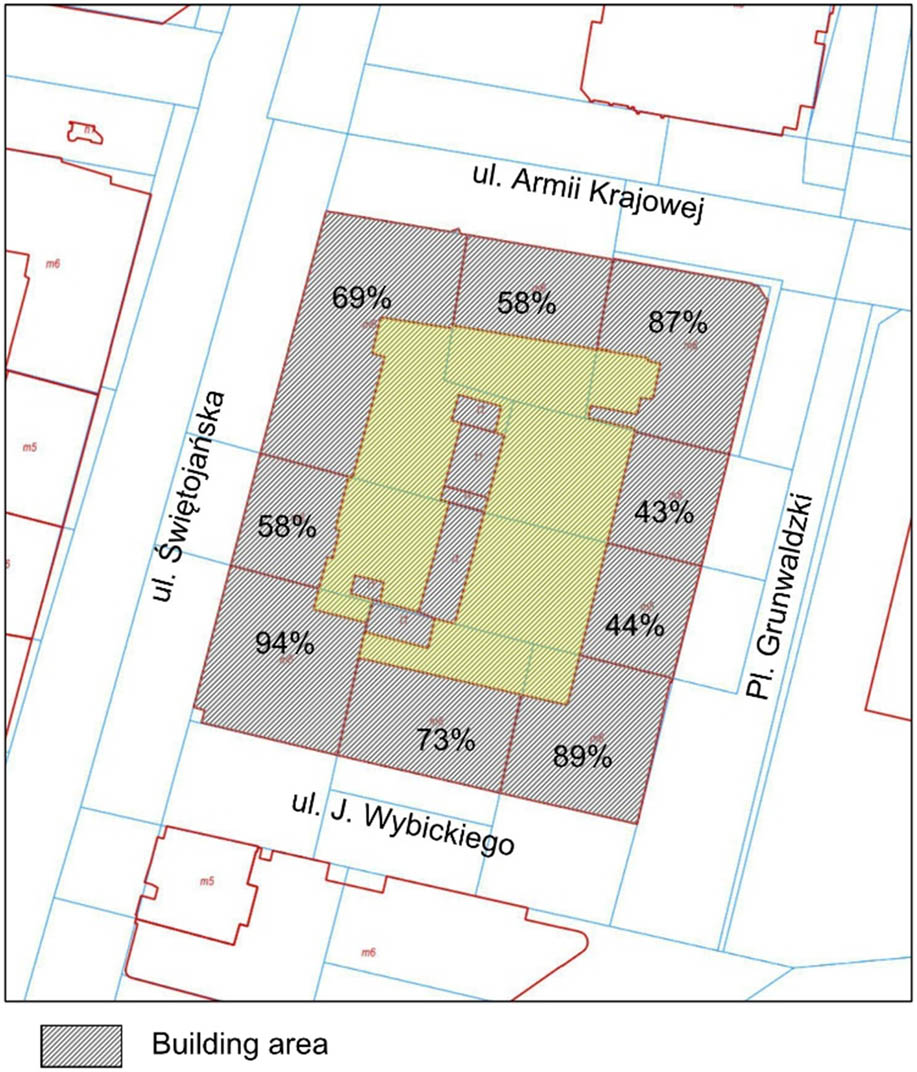
Figure 4
Example from Gdynia.
Source: Author, Basemap: https://www.geoportal.gov.pl/.
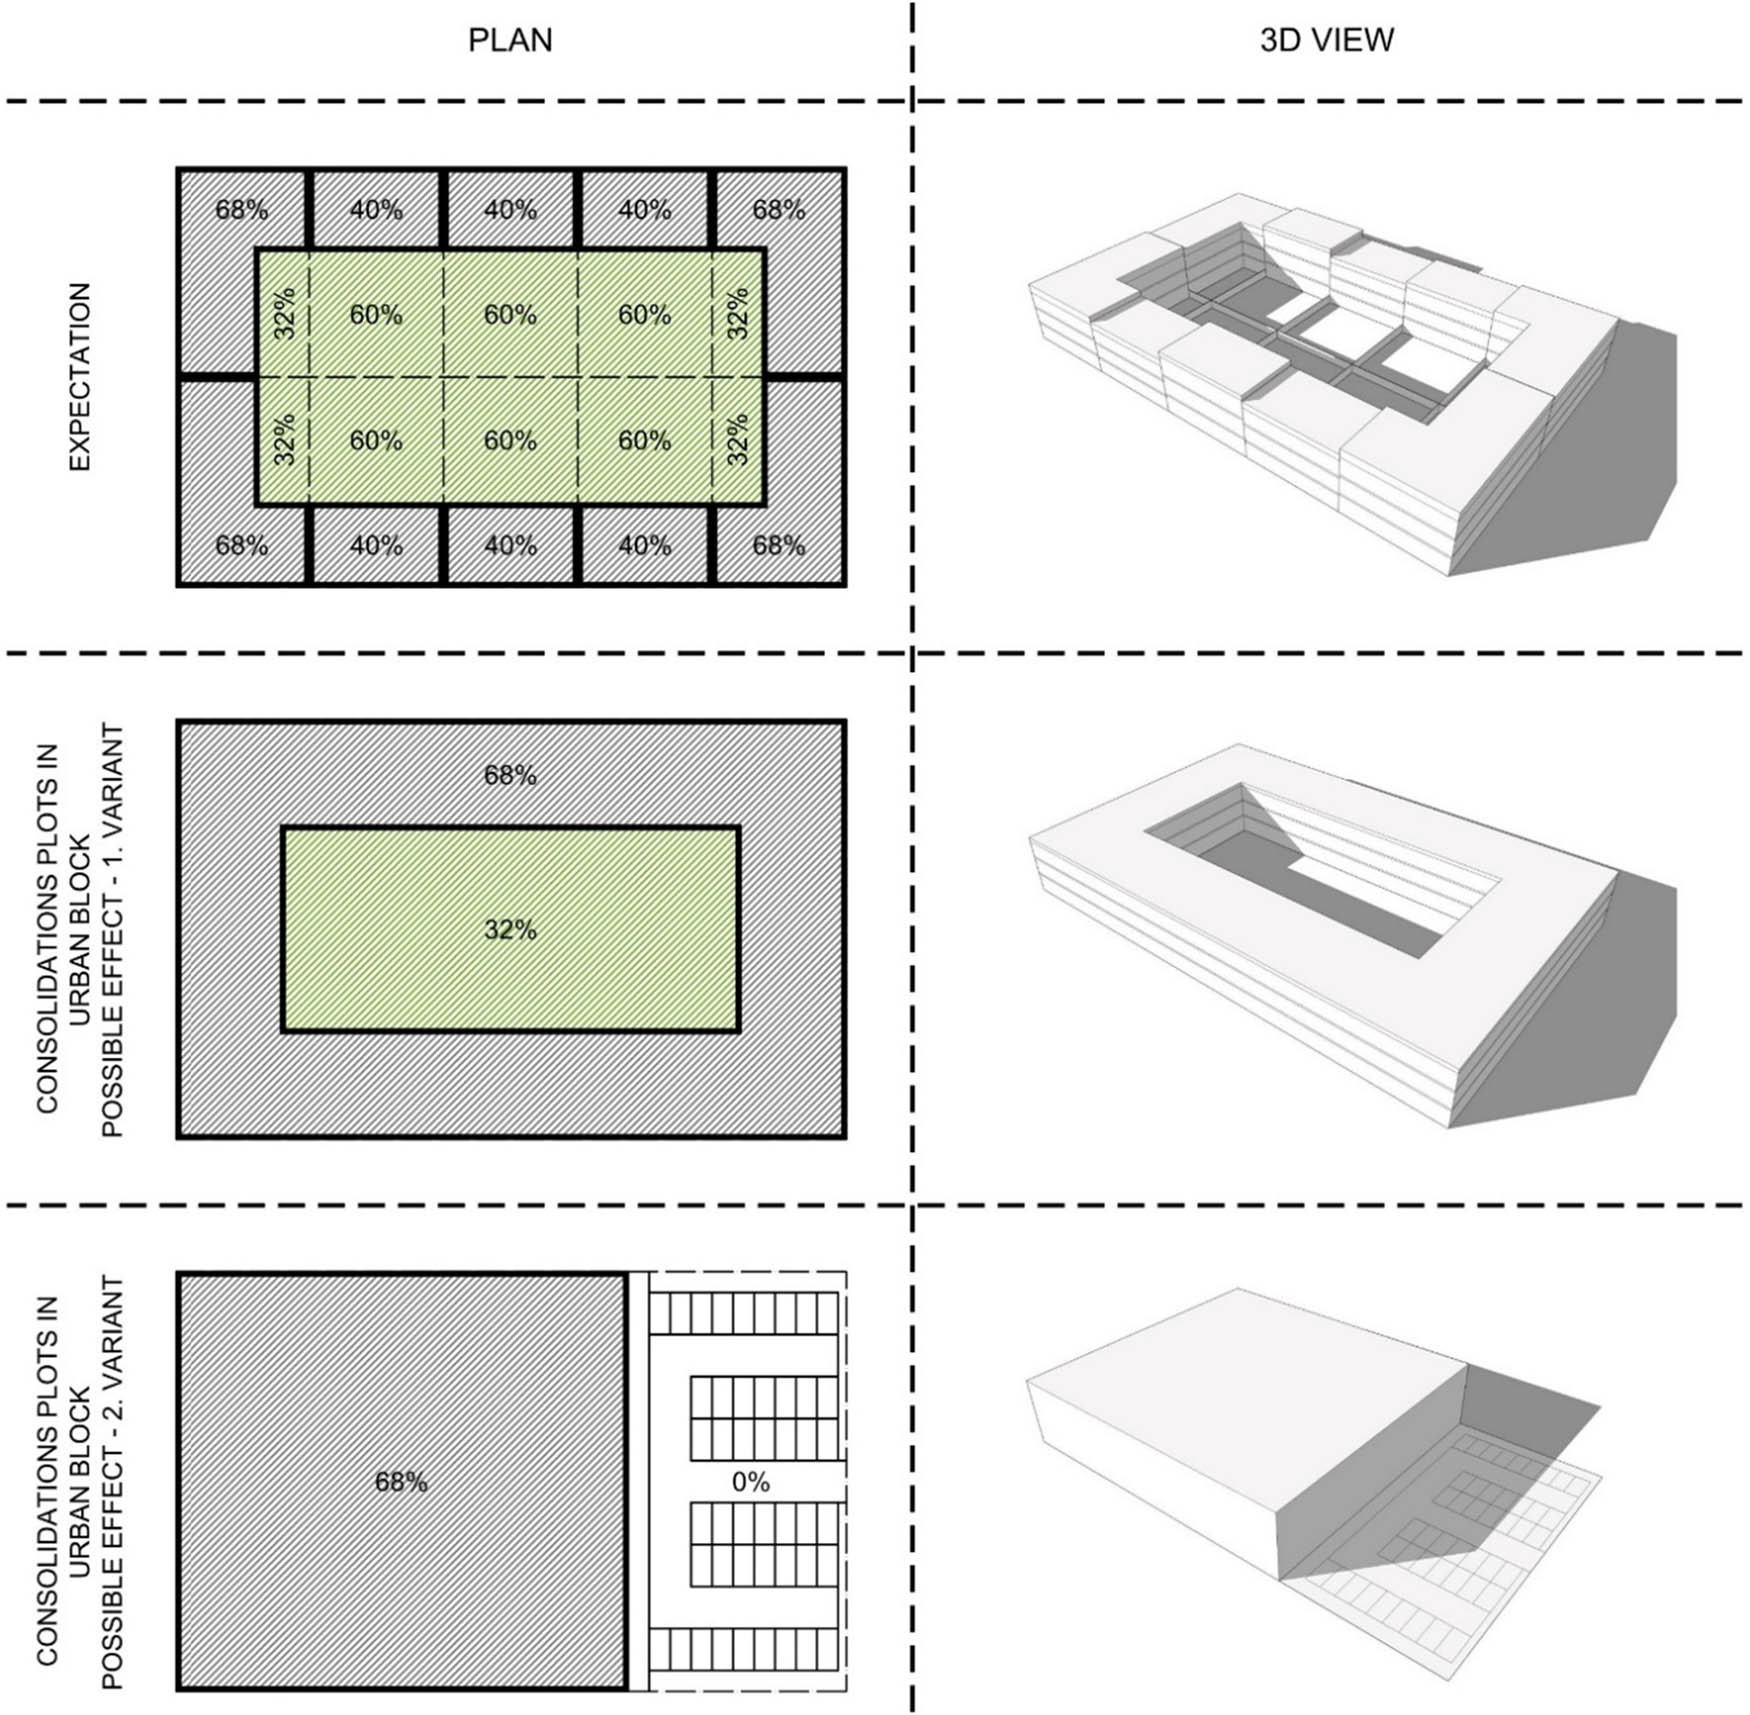
Figure 5
The simulation of the effects of individual parameters for corner plots in a local spatial development plan and the consolidation of all plots in an urban block.
Source: Author.
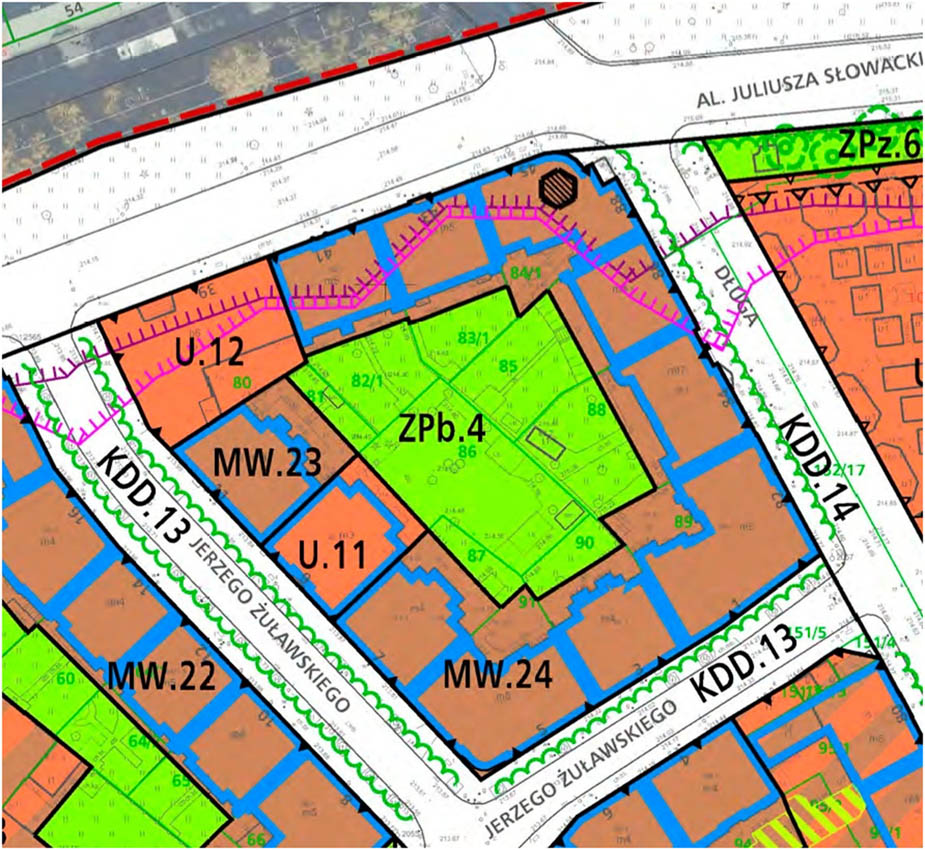
Figure 6
Fragment of the local spatial development plan for Kraków’s Nowy Kleparz.
Source: Miejscowy plan zagospodarowania przestrzennego obszaru „Kleparz”, https://www.bip.krakow.pl/?dok_id=137657 [20.09.2024].
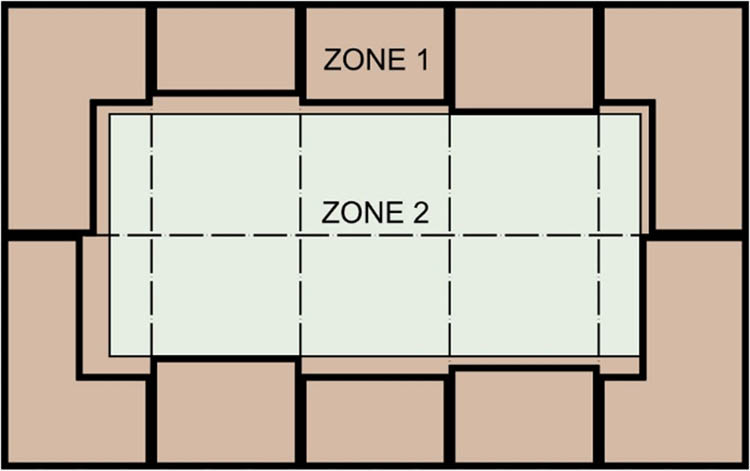
Figure 7
Diagram of the recommended solution for local spatial development plans.
Source: Author.