
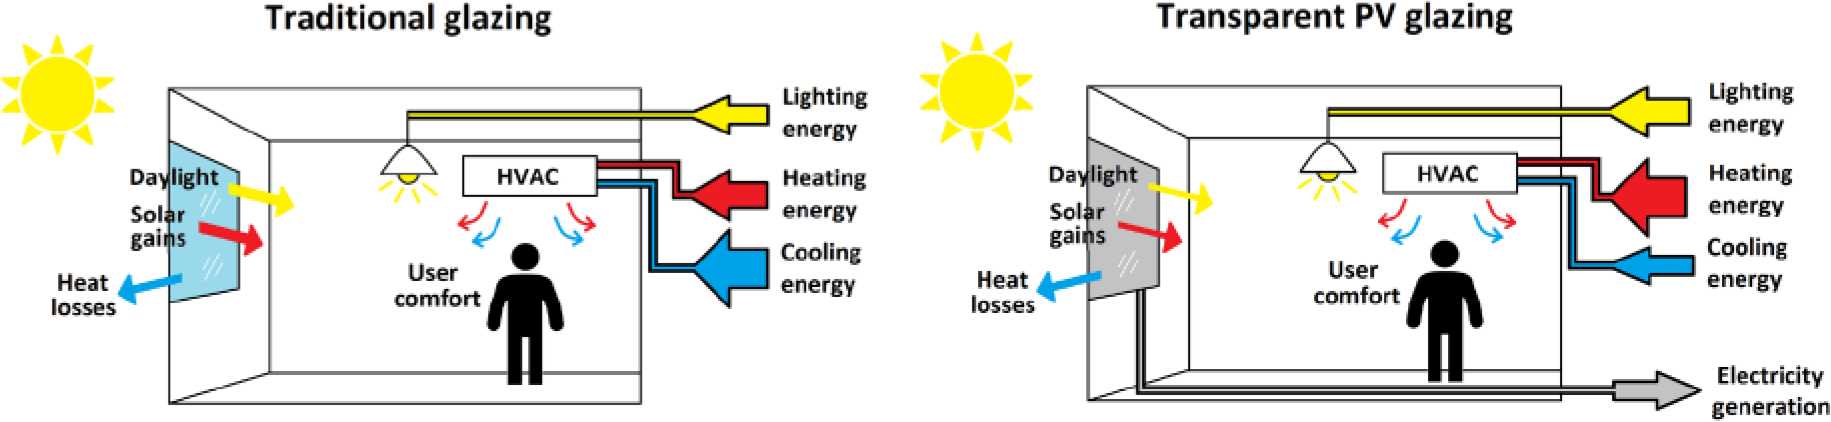
Figure 1.
Difference between traditional glazing and PV glazing on the energy balance of a building interior
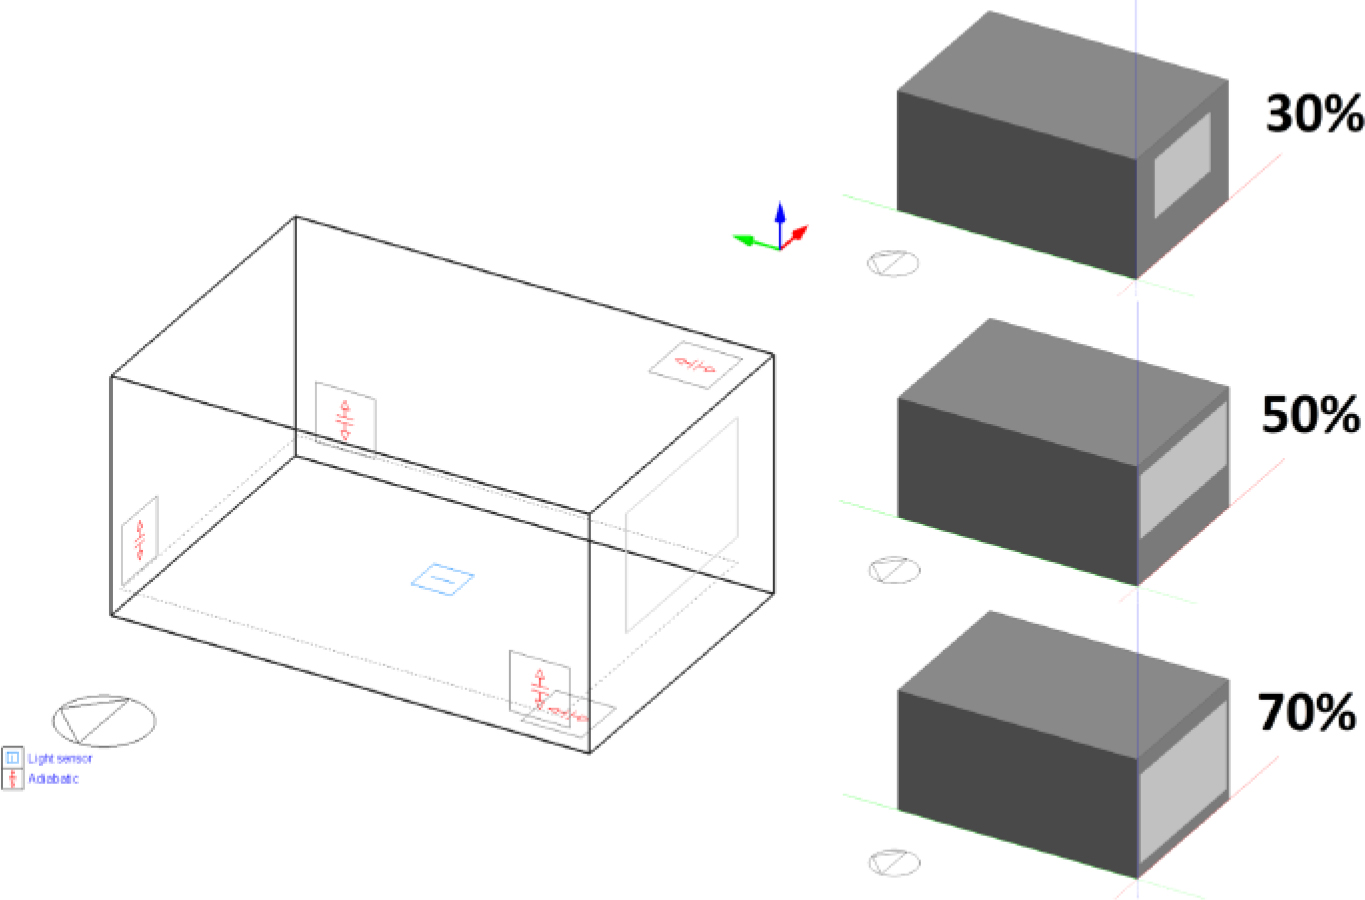
Figure 2.
Office room geometry (6.0 m x 4.0 m x 3.0 m) and analyzed WWR values (Window to Wall Ratio) for east, south and west façade orientation
Table 1.
Office room simulation settings
| Room parameter | Analyzed values |
|---|---|
| Location | Wroclaw, Poland (IMGW* weather data) |
| Dimensions (lenght x width x height) | 6.0 m x 4.0 m x 3.0 m |
External partition:
| East, South or West oriented façade (no shading from surroundings) Internal plaster + AAC blocks 25 cm + XPS boards 15 cm + External plaster U-value = 0.17 W/(m2K), according to WT2021 standard [13] Reference window or PV window, both with U-value = 0.80 W/(m2K) in three cases: with WWR of 30%, 50% and 70% |
Internal partitions:
| Set as adiabatic (but its heat capacities were added to room thermal mass): drywall / 10 cm airgap / drywall concrete 20 cm |
| User schedule | Monday – Friday, 8:00 - 16:00 + overtime hours (with lower activity) inbetween 7:00-8:00 and 16:00-18:00 |
| User density | 0,1 person/m2, according to EN 16798-1:2019 standard [14] |
Internal gains:
| As for typical office use: 127 W/person (1,2 Met, 70 W/m2 – for typical office activity according to ISO 7730 standard [15]) 11.77 W/m2 16.25 W/m2 |
| Lighting | 500 lx (typical for office spaces [16], according to EN 12464-1:2021 standard) |
Thermal comfort:
| Users clothing insulation levels: 1.0 clo (winter) and 0.5 clo (summer) Design temperatures for II category spaces (according to EN 16798-1:2019 standard [14]): +21°C inbetween 5:00–19:00, outside this period may drop to +19°C +24°C, inbetween 5:00–19:00 outside this period may rise to +28°C |
Technical systems:
| All relying on electricity from grid: Fan coil unit, Heating system seasonal CoP = 3.0 Fan coil unit, Cooling system seasonal CoP = 3.0 Mechanical, heat recovery 75% LEDs, power density 3.0 W/m2 |
Table 2.
Technical parameters of analyzed glazing units
| Parameter | Reference glazing set (Reference) | Transparent photovoltaic glazing set (PV) |
|---|---|---|
| Thermal transmittance – U-value [W/(m2K)] | 0.80 | 0.80 |
| Solar Heat Gain Coefficient – SHGC [-] | 0.47 | 0.42 |
| Light Transmittance – LT [-] | 0.66 | 0.25 |
| Power Conversion Efficiency – PCE [%] | Not applicable | 6.3% |
Table 3.
Technical parameter of analyzed PV glazing
| WWR (Window to Wall Ratio) | Glazing area [m2] | PV window peak power [W] |
|---|---|---|
| 30% | 3.6 | 226.8 |
| 50% | 6.0 | 378.0 |
| 70% | 8.4 | 529.2 |
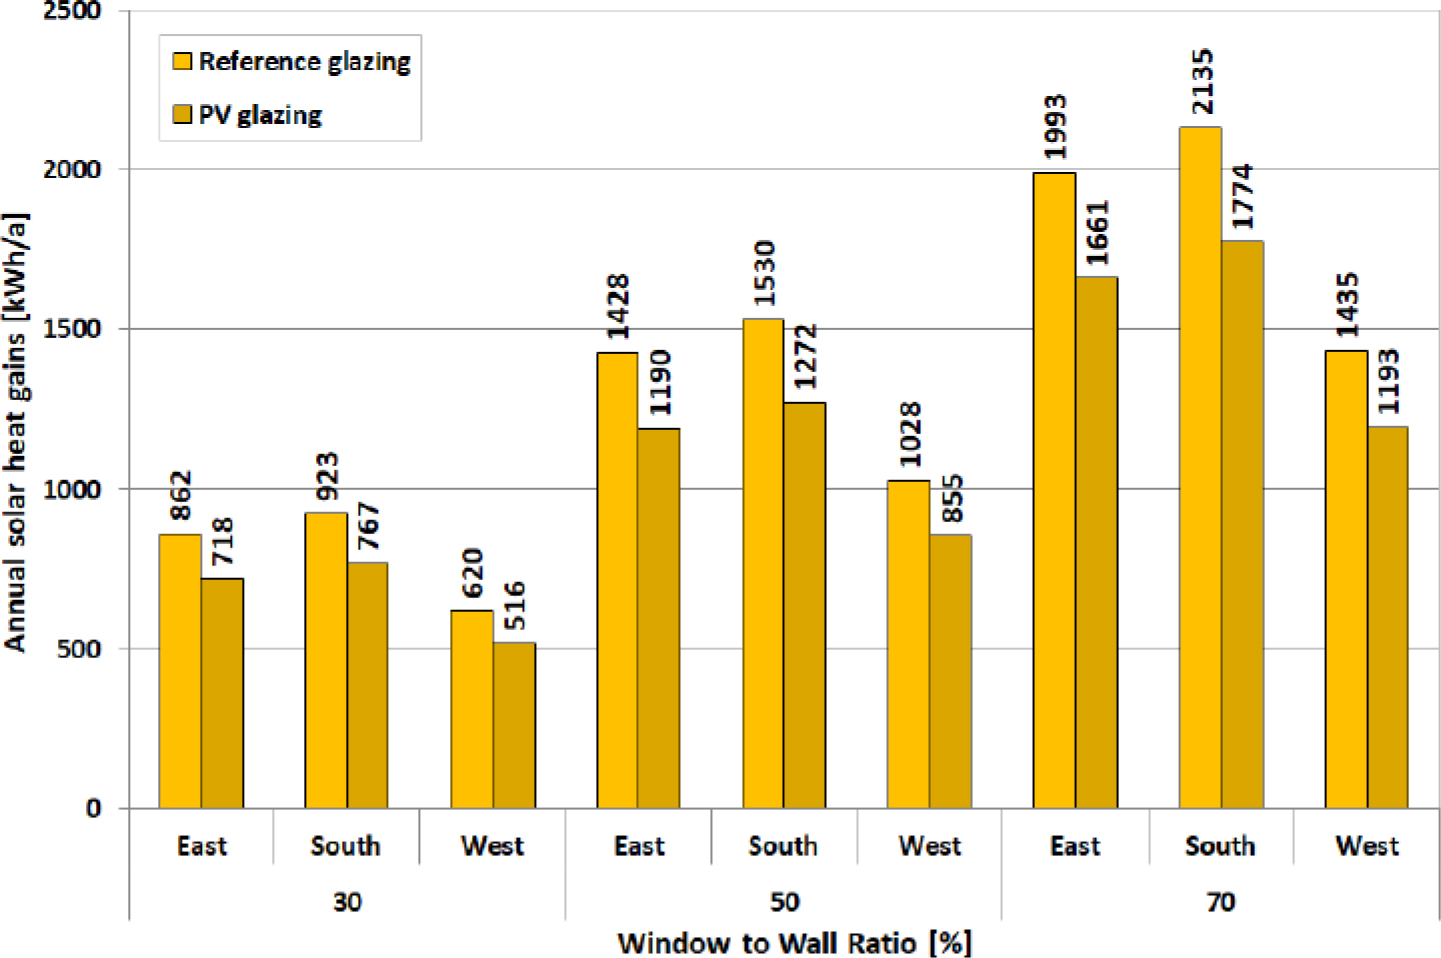
Figure 3.
Annual solar heat gains for the reference and PV glazing depending on the WWR value and façade orientation
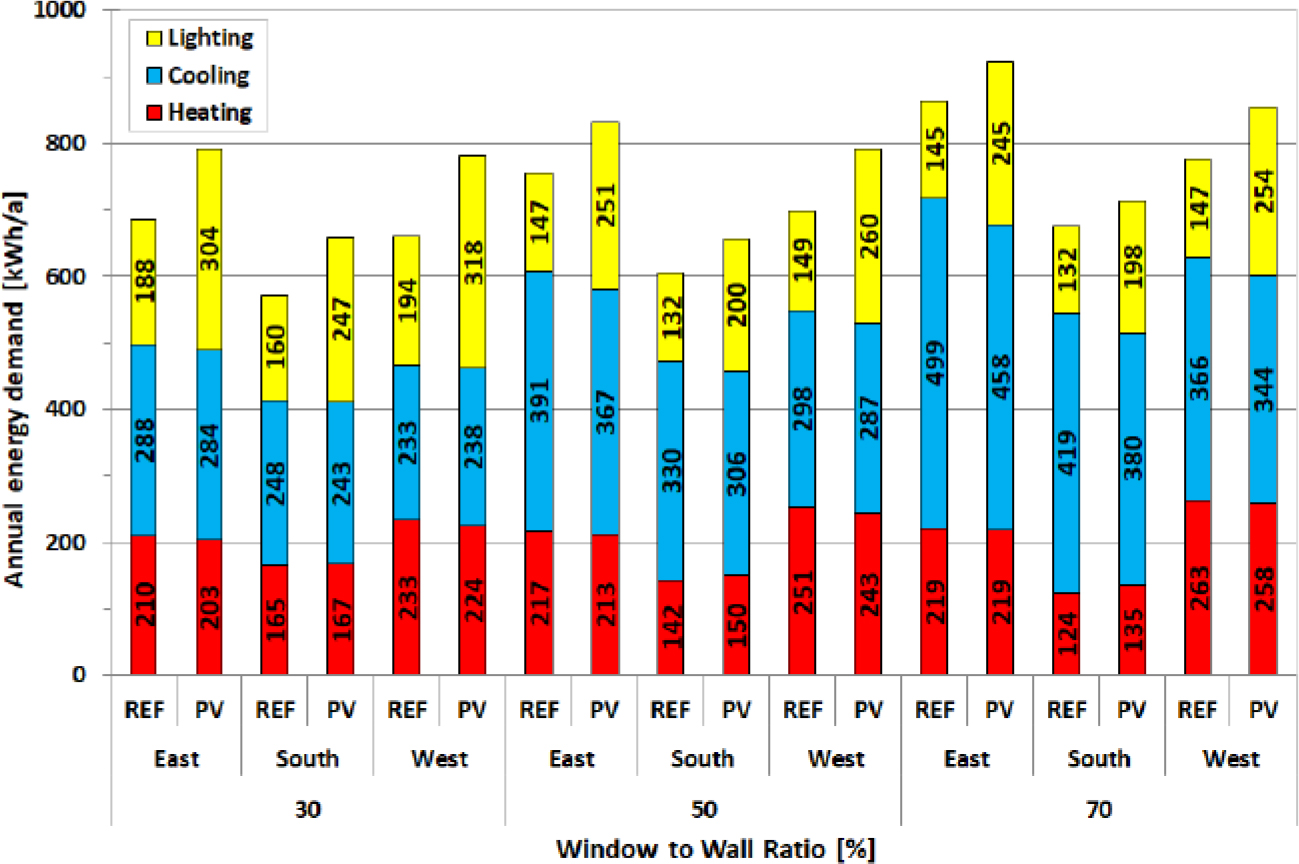
Figure 4.
Annual heating, cooling and lighting final (site) energy for reference and PV glazing depending on the WWR value and façade orientation
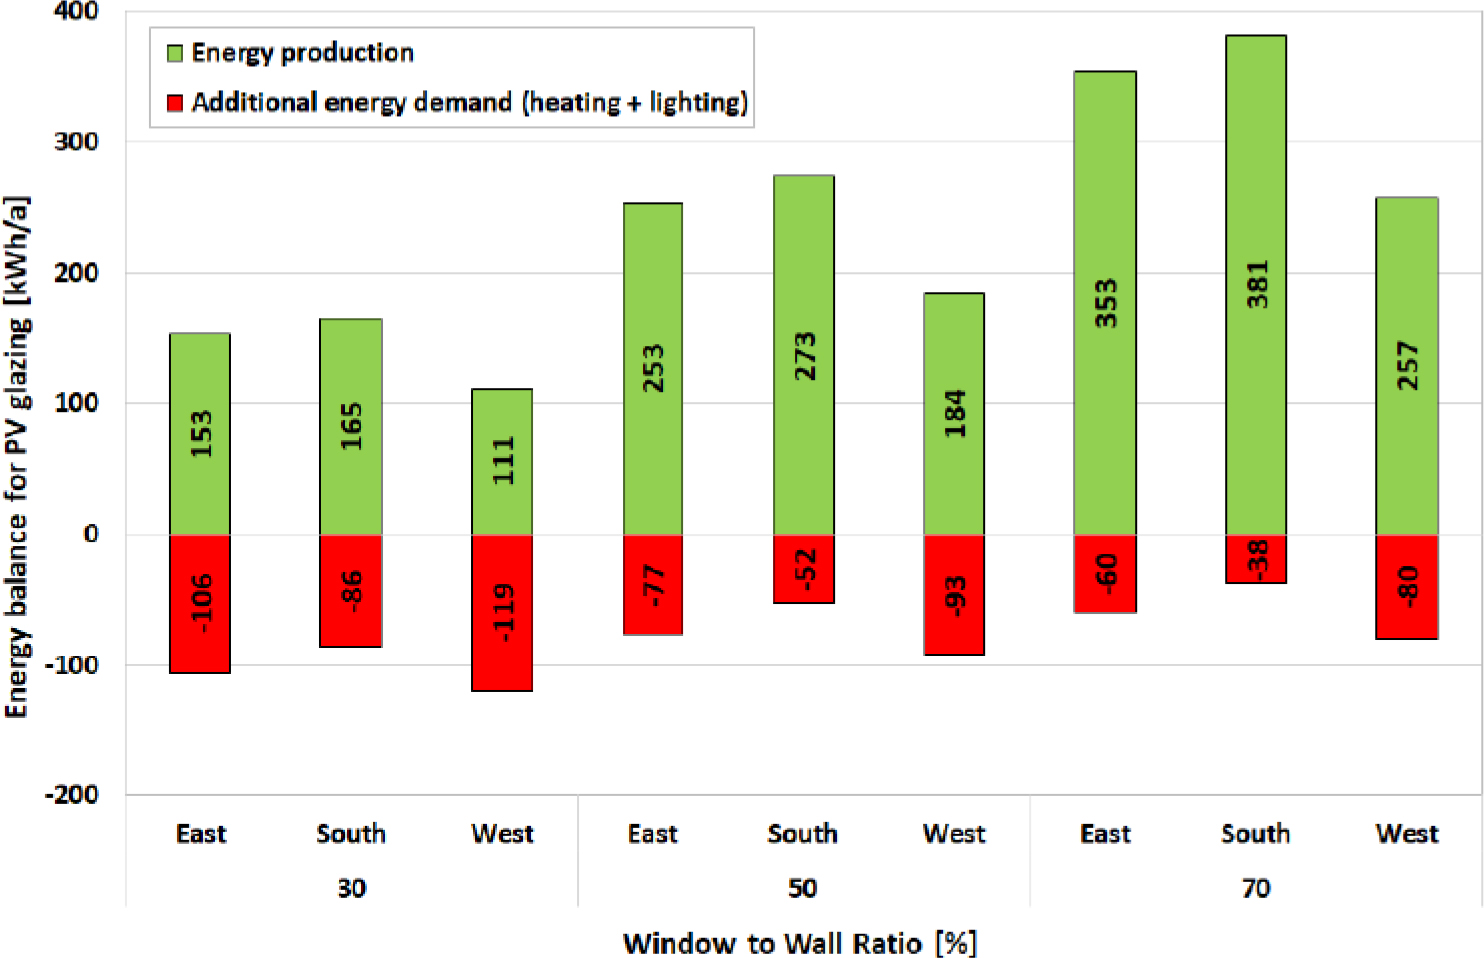
Figure 5.
PV glazing energy balance (energy production and additional energy demand) depending on the WWR value and façade orientation