Figure 1.
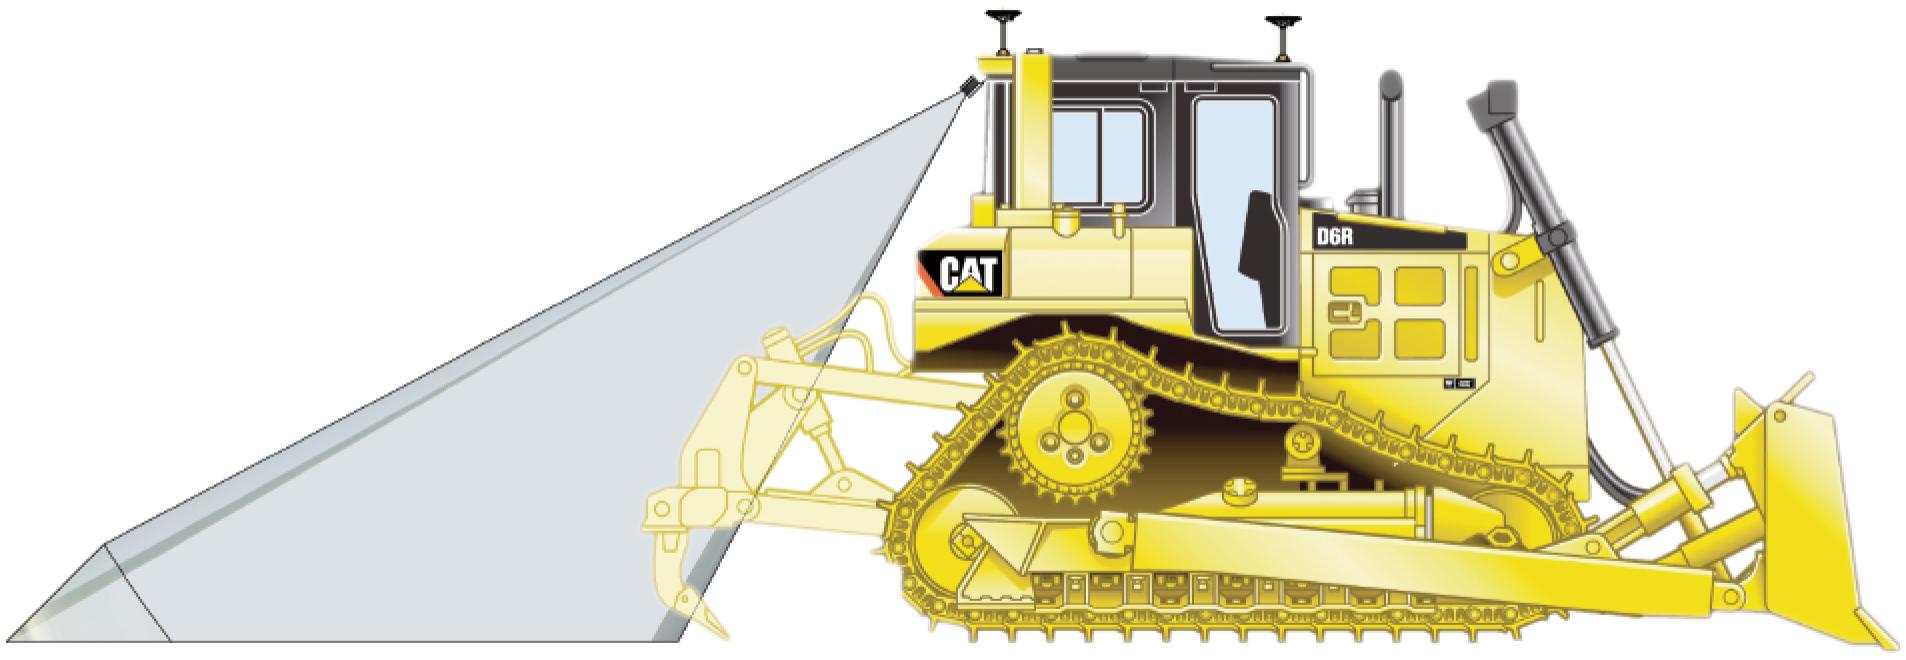
Figure 2.
![Velodyne VLP-16 LiDAR parameters: a) measurement beams (channels) in the vertical plane [42], b) dimensions of the measurement area [m]](https://sciendo-parsed.s3.eu-central-1.amazonaws.com/68ed236481e1b93419696e64/j_acee-2025-0041_fig_002.jpg?X-Amz-Algorithm=AWS4-HMAC-SHA256&X-Amz-Content-Sha256=UNSIGNED-PAYLOAD&X-Amz-Credential=ASIA6AP2G7AKAKFZSQ4S%2F20251211%2Feu-central-1%2Fs3%2Faws4_request&X-Amz-Date=20251211T052051Z&X-Amz-Expires=3600&X-Amz-Security-Token=IQoJb3JpZ2luX2VjEBsaDGV1LWNlbnRyYWwtMSJGMEQCIAnUIIQh2x9uXaMaRgOwjE6xRek3higXJ2HH7ChYlFV6AiAl6IhwxqtrqlDU5eupSSjZzfzCFZhb%2FZeiQS0BvR2AGirGBQjl%2F%2F%2F%2F%2F%2F%2F%2F%2F%2F8BEAIaDDk2MzEzNDI4OTk0MCIMMFEF3a%2Bg4Q60BOMbKpoFTFaRJqAG6ReW9OSs0zKk%2BQjWqiRjMNnjnB89T7LMHqv4WgAnrH28cs7FcgvDcx%2FMuUMcQad8G40FhcKmFnVXN4DntJRGi%2B9ncgLpbdlMZuuIUr6WT39A7fyGHhsRbw88kHvLqm2iSMQVQ%2FSpeMgsE%2BF5aW%2BjDghYbOXkfVTAXD7sz2DPd8rs%2FdrN%2FE8JPWTNcQvW67Jyc%2BaKczmnJy5SQ1Sc7B3T98EA3YUcXoU0%2B5ZwXwuqGth5BcUopBy2D76vlIk6euMP9%2BKpB8L7bthI5RjN2RXGgjo8qjomGpbwxZZ7LovMPWLbzpTAr1Nij0d%2FfmucbGLnznZEqYMCo5tWQDIoCpGWJ%2B757Sv%2FNnG28Iu1%2BPRmoQUWCM87WRqRQLRDAXakTFJG1dAYBdRWzBf7oKGF%2ByUs2q%2FCwbHz2nAVVIaJQ3hkOtdr3MHPfgkYIottbWvndbshLDZA7y6rBe8uAgN1E15gliMDlj7nX1cHseYt4c51UfiNksj%2BeIN9sR27pT%2BDTPsODKH06ytjidLGzbkf7SBLGupHUS8C22ZyCmSYHOthWceM%2B%2F8tOQUe0YyJjxJ%2Fry3vvF1K8oge1H0N3ds09XbgGIRmQl%2FbjpM8cVWpdlKu0A%2FeBZQAhZWs0NMiWwXOSOpV7Rye7lKGmf72tDQ7u27KcEN%2FpoZXXQ%2F0W0XaXkQU8J73pnk1k0X%2BzC3rxpjs3cVzqDSYii3lSvpfmt8X9zNbAFjUinhW%2FplOTjYvZGG7ue16%2F0MnYK8l%2Bg2tPuZZvjCvaEunaU6jEUwYlebz3HLcEM02V3gG7gxU4eFEfUvTCb%2Bxb30jx22nm9ezaZ9gTy9nUwcPFHoPHhWChRCbF5tUVc2%2BNQRtyHHAGfa0N1GHjYvJ8siNMOzy6MkGOrIBt1akoC1FyoO4vhyAzhsB3jQfnXZn%2FJkZNy6tChKU6kjfjURy0grD7Fxr%2FIKwId2UZGxDFcHsP8Mjtf%2BYQSZpsAMeLoy%2BKmcepfYg%2BgRoiMck12mbUKS%2BXNCFInHCV0Il7LkzhkTj9SRTDojWwumOrYWMSQHrsUNDrBcMfsJOucedOdEr8xj1LHEUfzotIeOiuh7PVT9uH%2Fc4kthjerf%2FUBAPJgE8fKRx6CrVqUgoUvSMaw%3D%3D&X-Amz-Signature=284cd7e4f5e07d876467b5966f31e3748590f116ba887fca9878337bd8a32ea4&X-Amz-SignedHeaders=host&x-amz-checksum-mode=ENABLED&x-id=GetObject)
Figure 3.
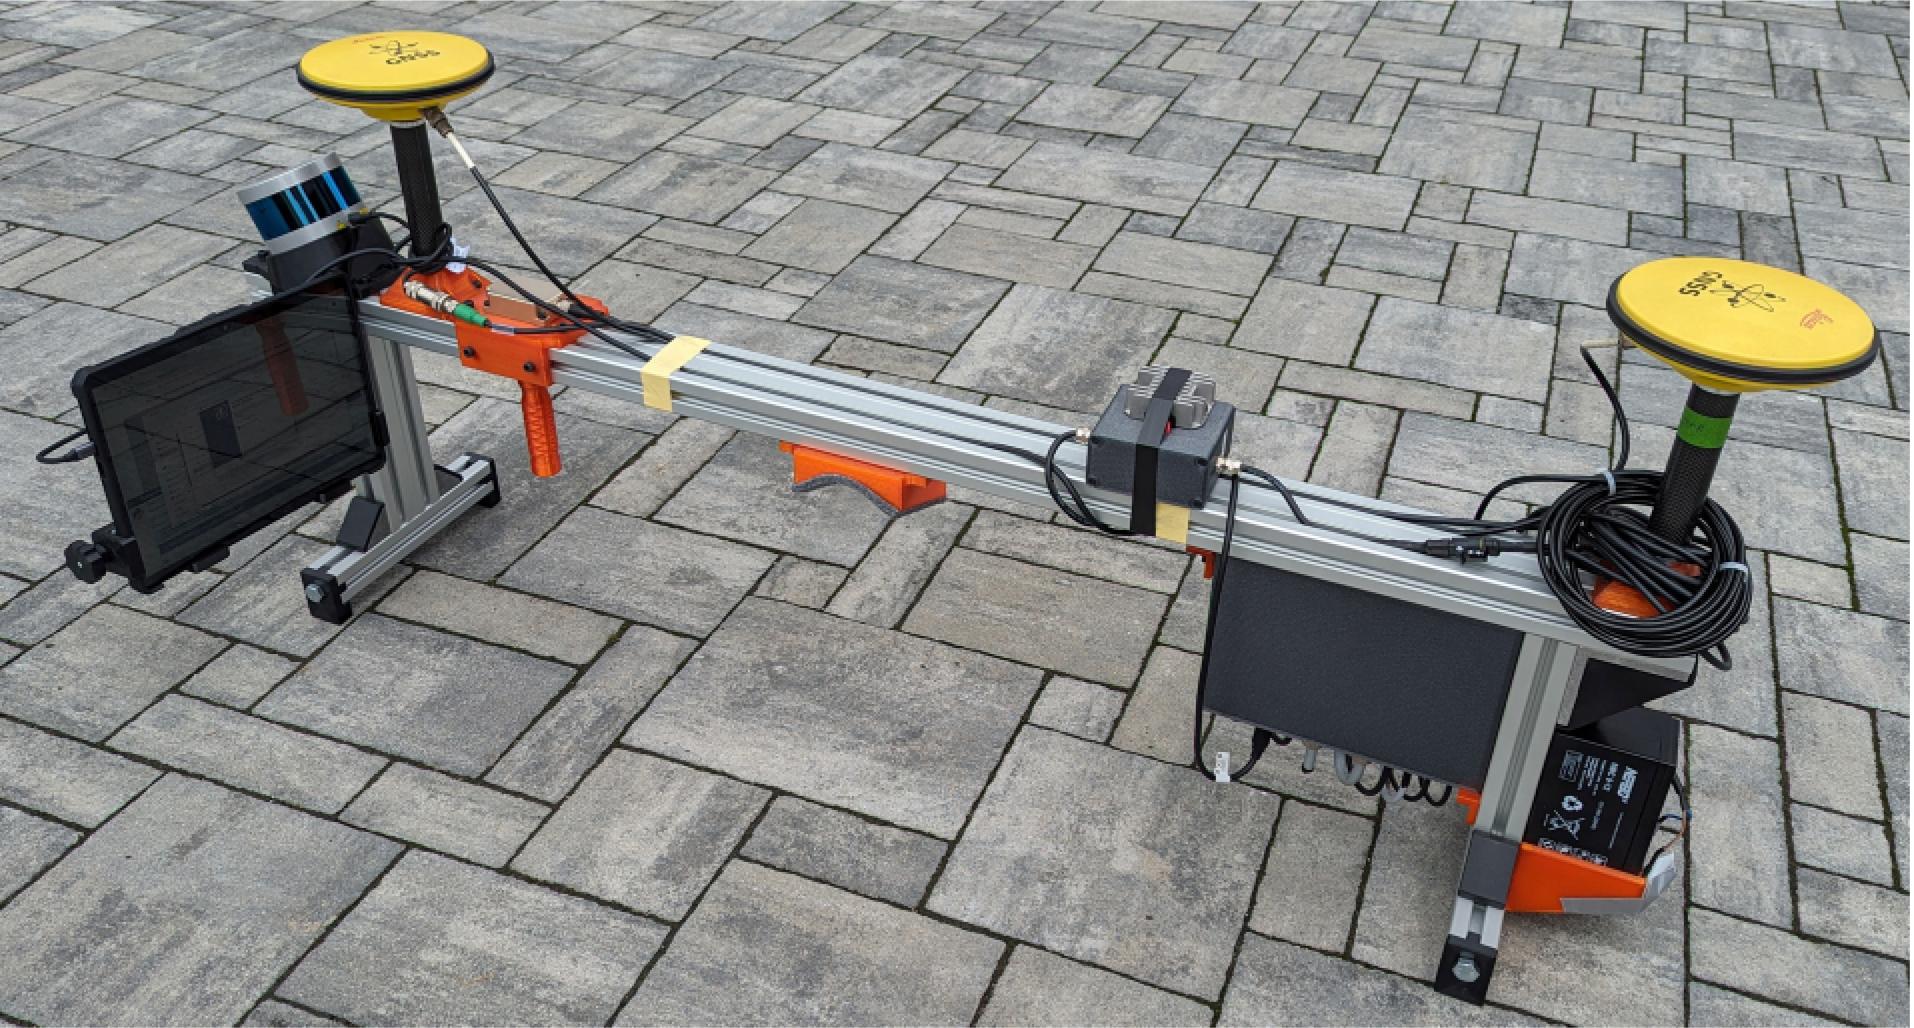
Fig. 4.
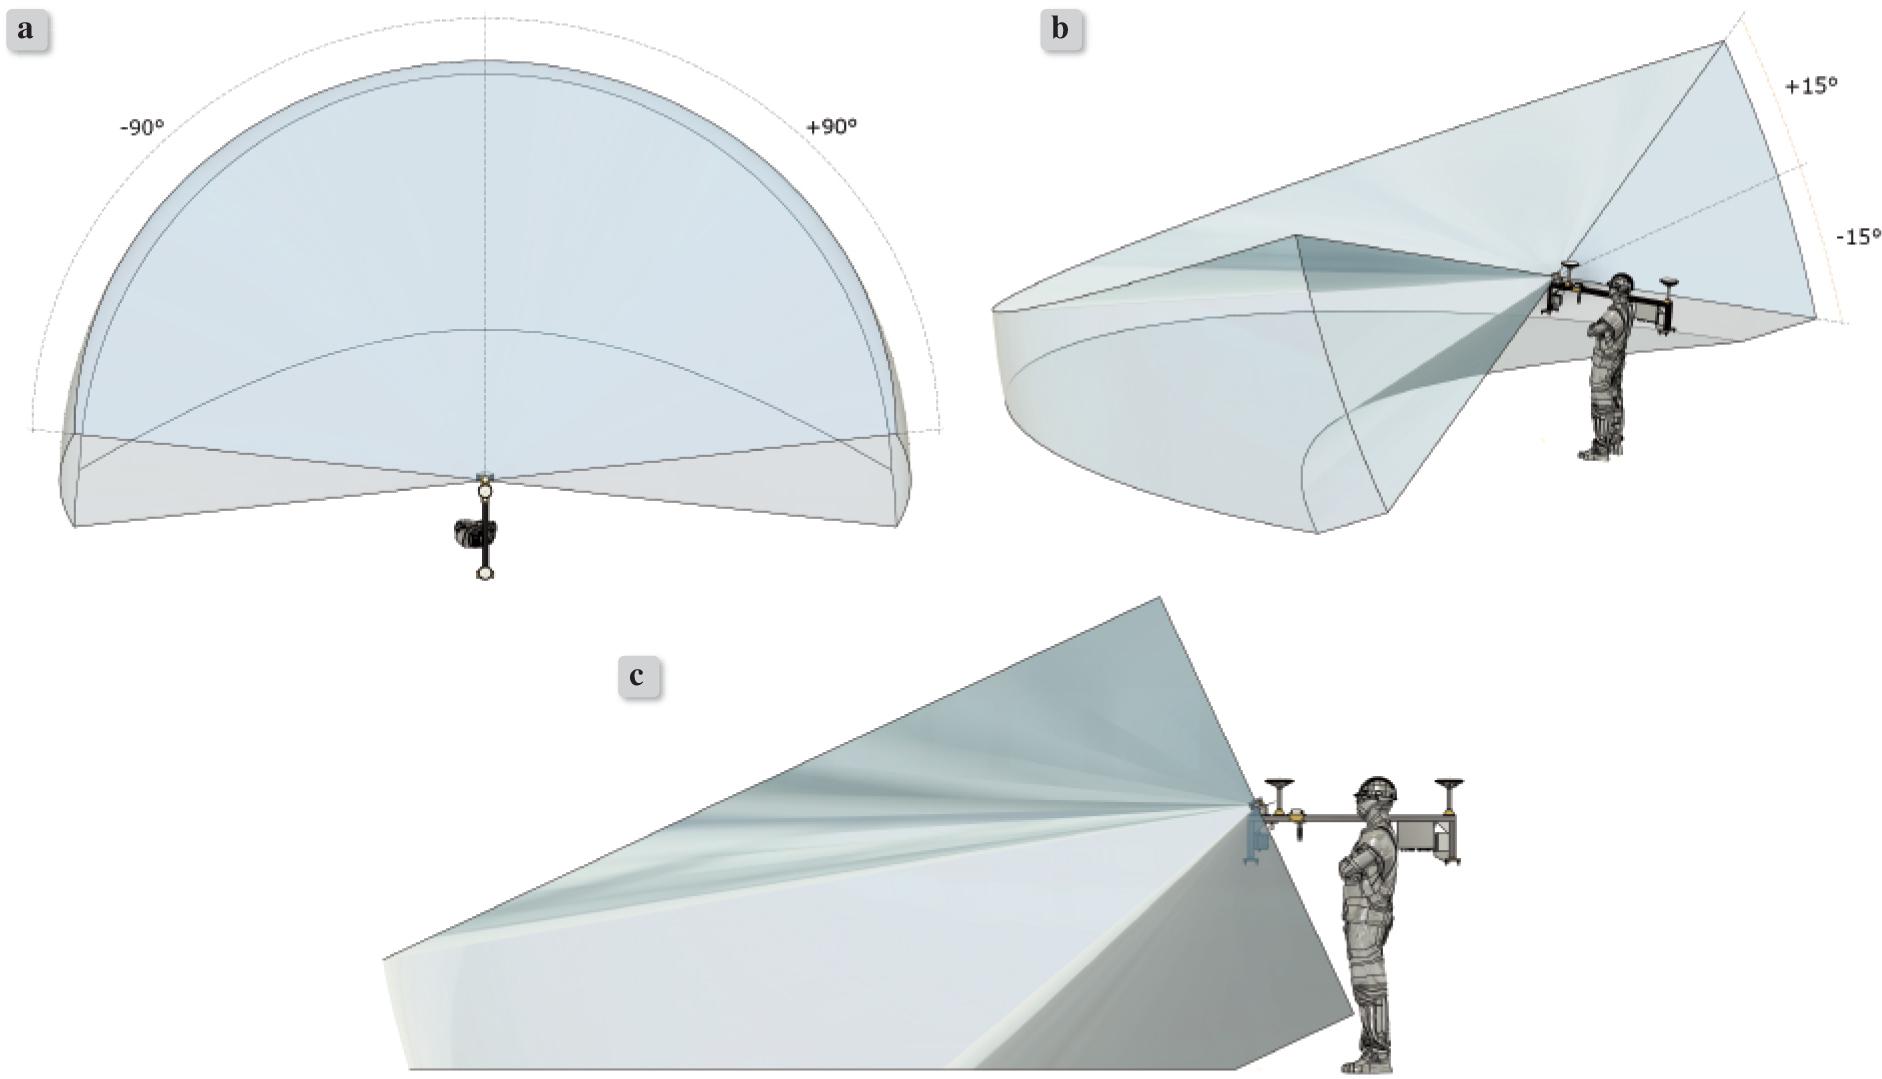
Figure 5.
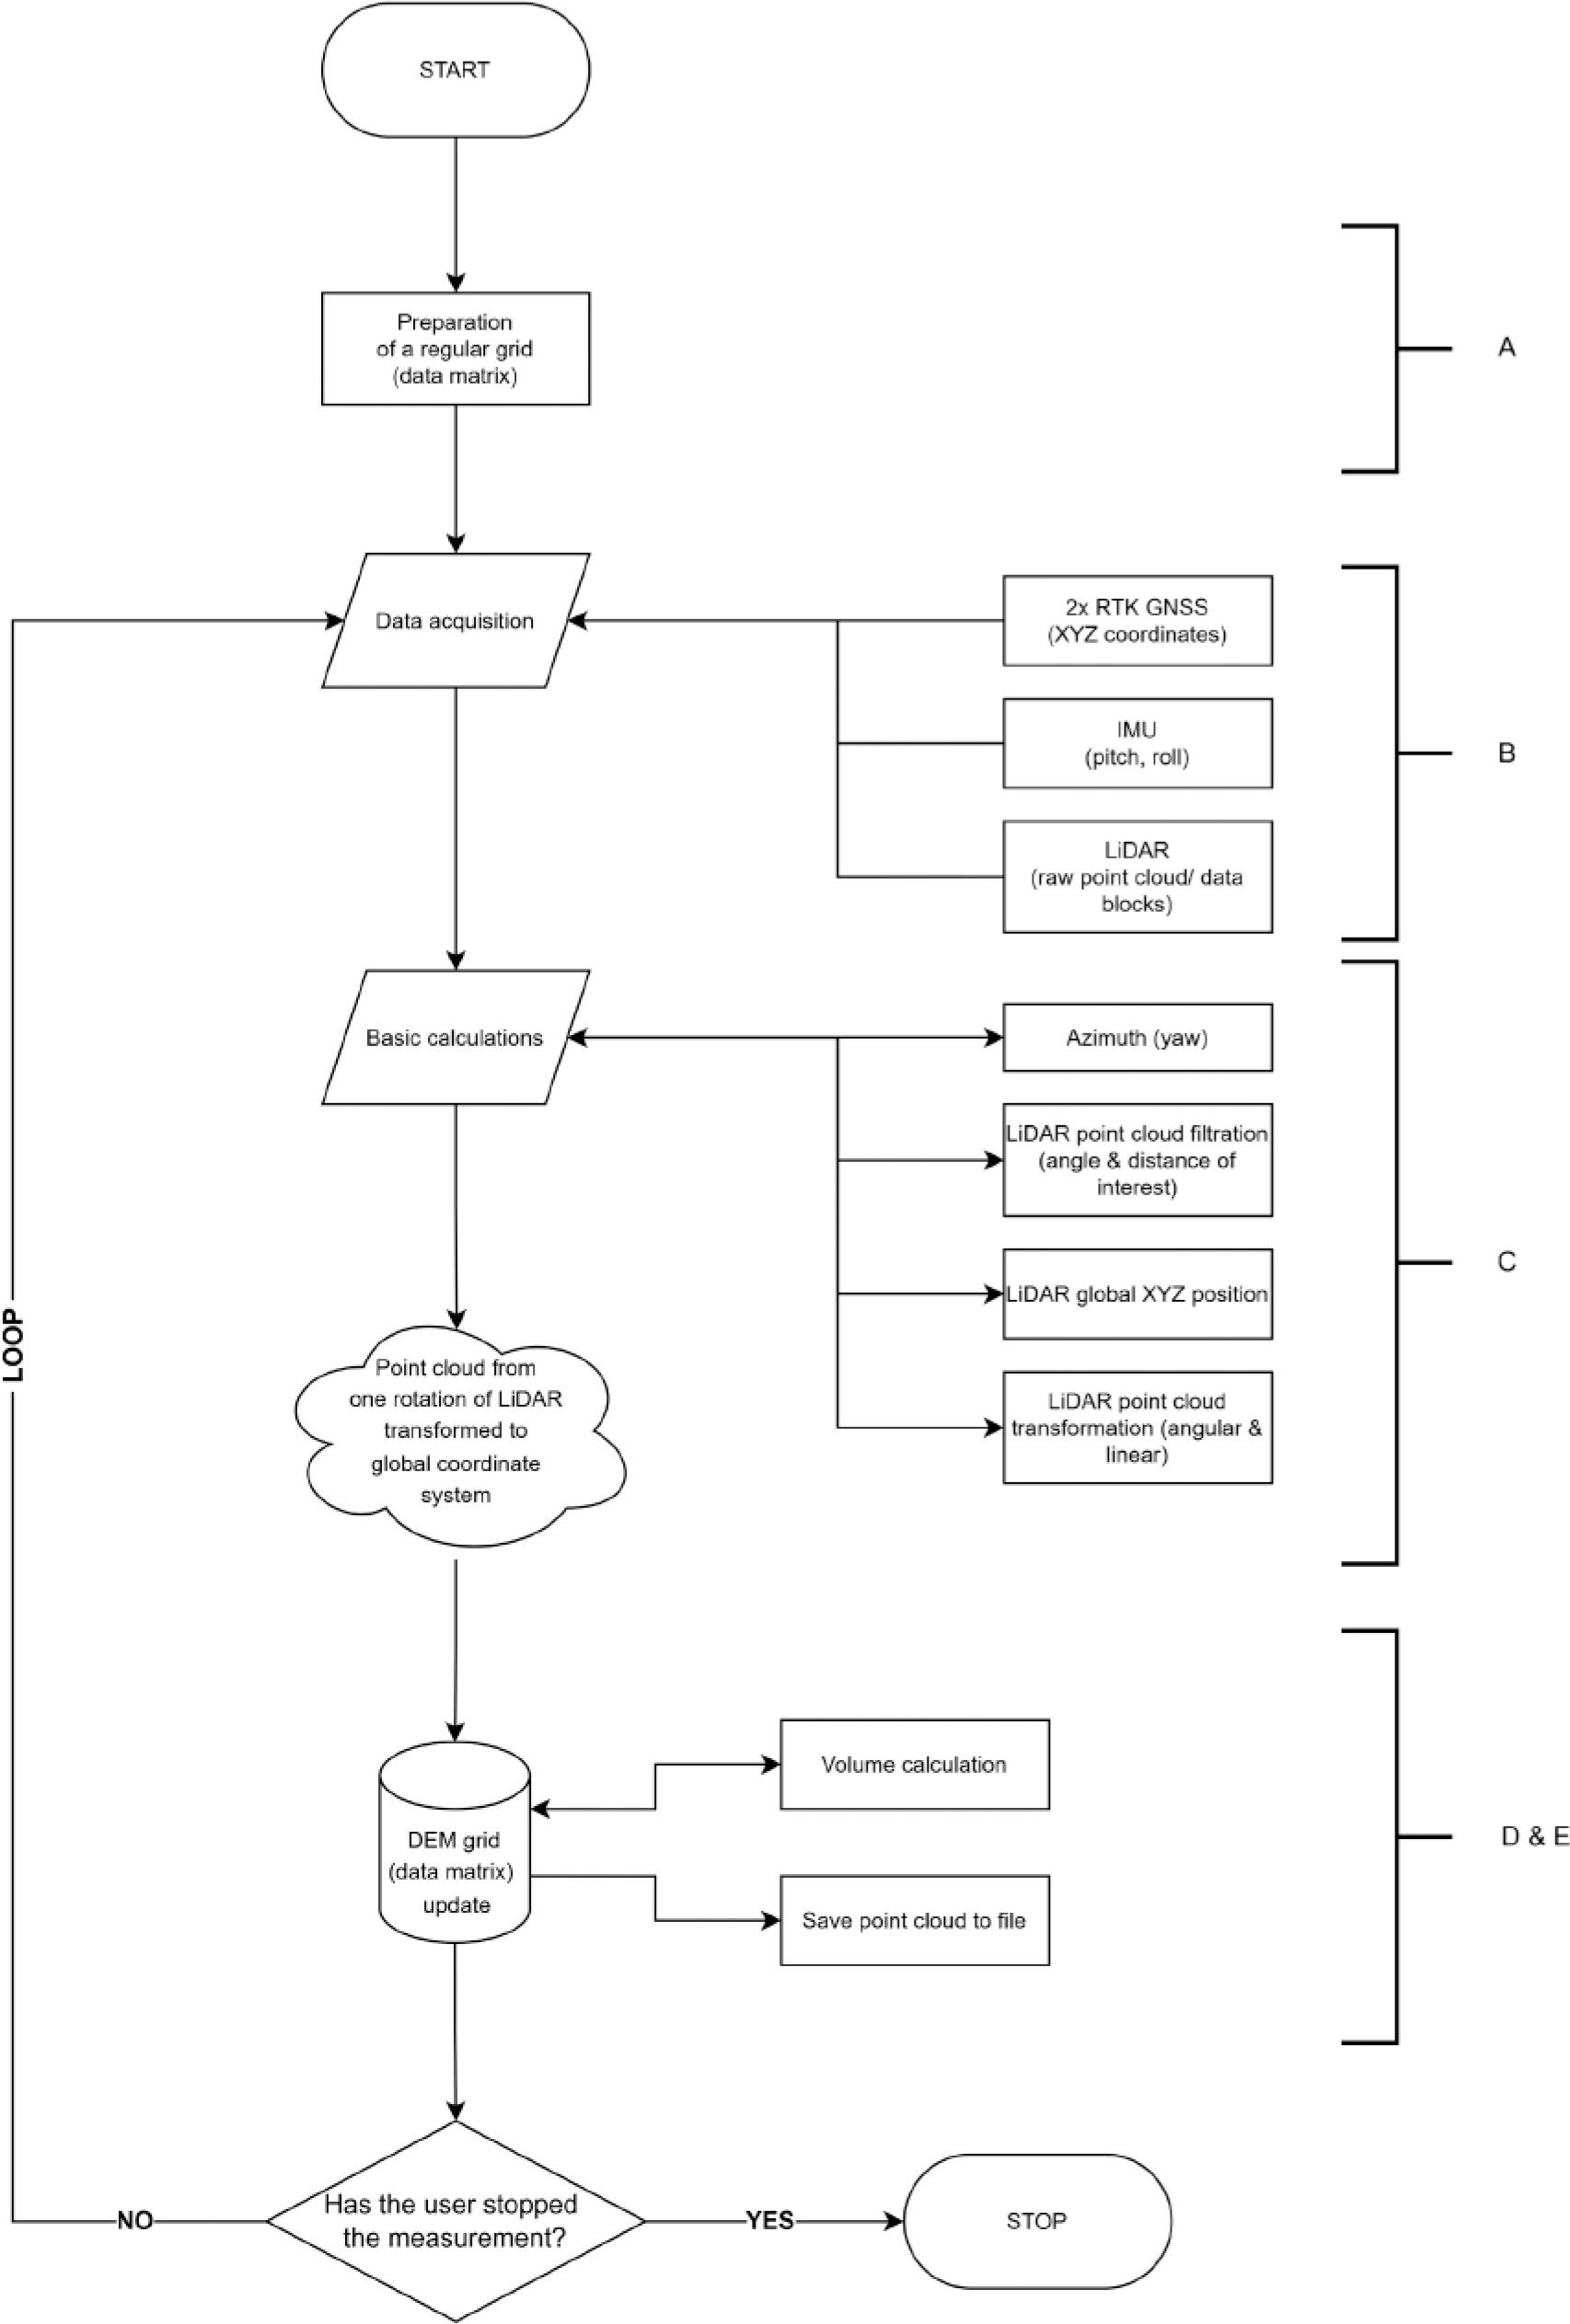
Figure 6.
![Visualization of the data matrix – a grid with a single pixel size of px. Each pixel, starting in the lower left corner, can only contain one point with data [X,Y,Z, Intensity, Hdiff]. The colors blue, green and yellow indicate the corresponding grid nodes (pixels) and measured points](https://sciendo-parsed.s3.eu-central-1.amazonaws.com/68ed236481e1b93419696e64/j_acee-2025-0041_fig_006.jpg?X-Amz-Algorithm=AWS4-HMAC-SHA256&X-Amz-Content-Sha256=UNSIGNED-PAYLOAD&X-Amz-Credential=ASIA6AP2G7AKAKFZSQ4S%2F20251211%2Feu-central-1%2Fs3%2Faws4_request&X-Amz-Date=20251211T052051Z&X-Amz-Expires=3600&X-Amz-Security-Token=IQoJb3JpZ2luX2VjEBsaDGV1LWNlbnRyYWwtMSJGMEQCIAnUIIQh2x9uXaMaRgOwjE6xRek3higXJ2HH7ChYlFV6AiAl6IhwxqtrqlDU5eupSSjZzfzCFZhb%2FZeiQS0BvR2AGirGBQjl%2F%2F%2F%2F%2F%2F%2F%2F%2F%2F8BEAIaDDk2MzEzNDI4OTk0MCIMMFEF3a%2Bg4Q60BOMbKpoFTFaRJqAG6ReW9OSs0zKk%2BQjWqiRjMNnjnB89T7LMHqv4WgAnrH28cs7FcgvDcx%2FMuUMcQad8G40FhcKmFnVXN4DntJRGi%2B9ncgLpbdlMZuuIUr6WT39A7fyGHhsRbw88kHvLqm2iSMQVQ%2FSpeMgsE%2BF5aW%2BjDghYbOXkfVTAXD7sz2DPd8rs%2FdrN%2FE8JPWTNcQvW67Jyc%2BaKczmnJy5SQ1Sc7B3T98EA3YUcXoU0%2B5ZwXwuqGth5BcUopBy2D76vlIk6euMP9%2BKpB8L7bthI5RjN2RXGgjo8qjomGpbwxZZ7LovMPWLbzpTAr1Nij0d%2FfmucbGLnznZEqYMCo5tWQDIoCpGWJ%2B757Sv%2FNnG28Iu1%2BPRmoQUWCM87WRqRQLRDAXakTFJG1dAYBdRWzBf7oKGF%2ByUs2q%2FCwbHz2nAVVIaJQ3hkOtdr3MHPfgkYIottbWvndbshLDZA7y6rBe8uAgN1E15gliMDlj7nX1cHseYt4c51UfiNksj%2BeIN9sR27pT%2BDTPsODKH06ytjidLGzbkf7SBLGupHUS8C22ZyCmSYHOthWceM%2B%2F8tOQUe0YyJjxJ%2Fry3vvF1K8oge1H0N3ds09XbgGIRmQl%2FbjpM8cVWpdlKu0A%2FeBZQAhZWs0NMiWwXOSOpV7Rye7lKGmf72tDQ7u27KcEN%2FpoZXXQ%2F0W0XaXkQU8J73pnk1k0X%2BzC3rxpjs3cVzqDSYii3lSvpfmt8X9zNbAFjUinhW%2FplOTjYvZGG7ue16%2F0MnYK8l%2Bg2tPuZZvjCvaEunaU6jEUwYlebz3HLcEM02V3gG7gxU4eFEfUvTCb%2Bxb30jx22nm9ezaZ9gTy9nUwcPFHoPHhWChRCbF5tUVc2%2BNQRtyHHAGfa0N1GHjYvJ8siNMOzy6MkGOrIBt1akoC1FyoO4vhyAzhsB3jQfnXZn%2FJkZNy6tChKU6kjfjURy0grD7Fxr%2FIKwId2UZGxDFcHsP8Mjtf%2BYQSZpsAMeLoy%2BKmcepfYg%2BgRoiMck12mbUKS%2BXNCFInHCV0Il7LkzhkTj9SRTDojWwumOrYWMSQHrsUNDrBcMfsJOucedOdEr8xj1LHEUfzotIeOiuh7PVT9uH%2Fc4kthjerf%2FUBAPJgE8fKRx6CrVqUgoUvSMaw%3D%3D&X-Amz-Signature=1d180660d0bd8a269c7c444cf89e7d89945a2ba1581c788e9bd036ca7c9d8e04&X-Amz-SignedHeaders=host&x-amz-checksum-mode=ENABLED&x-id=GetObject)
Figure 7.
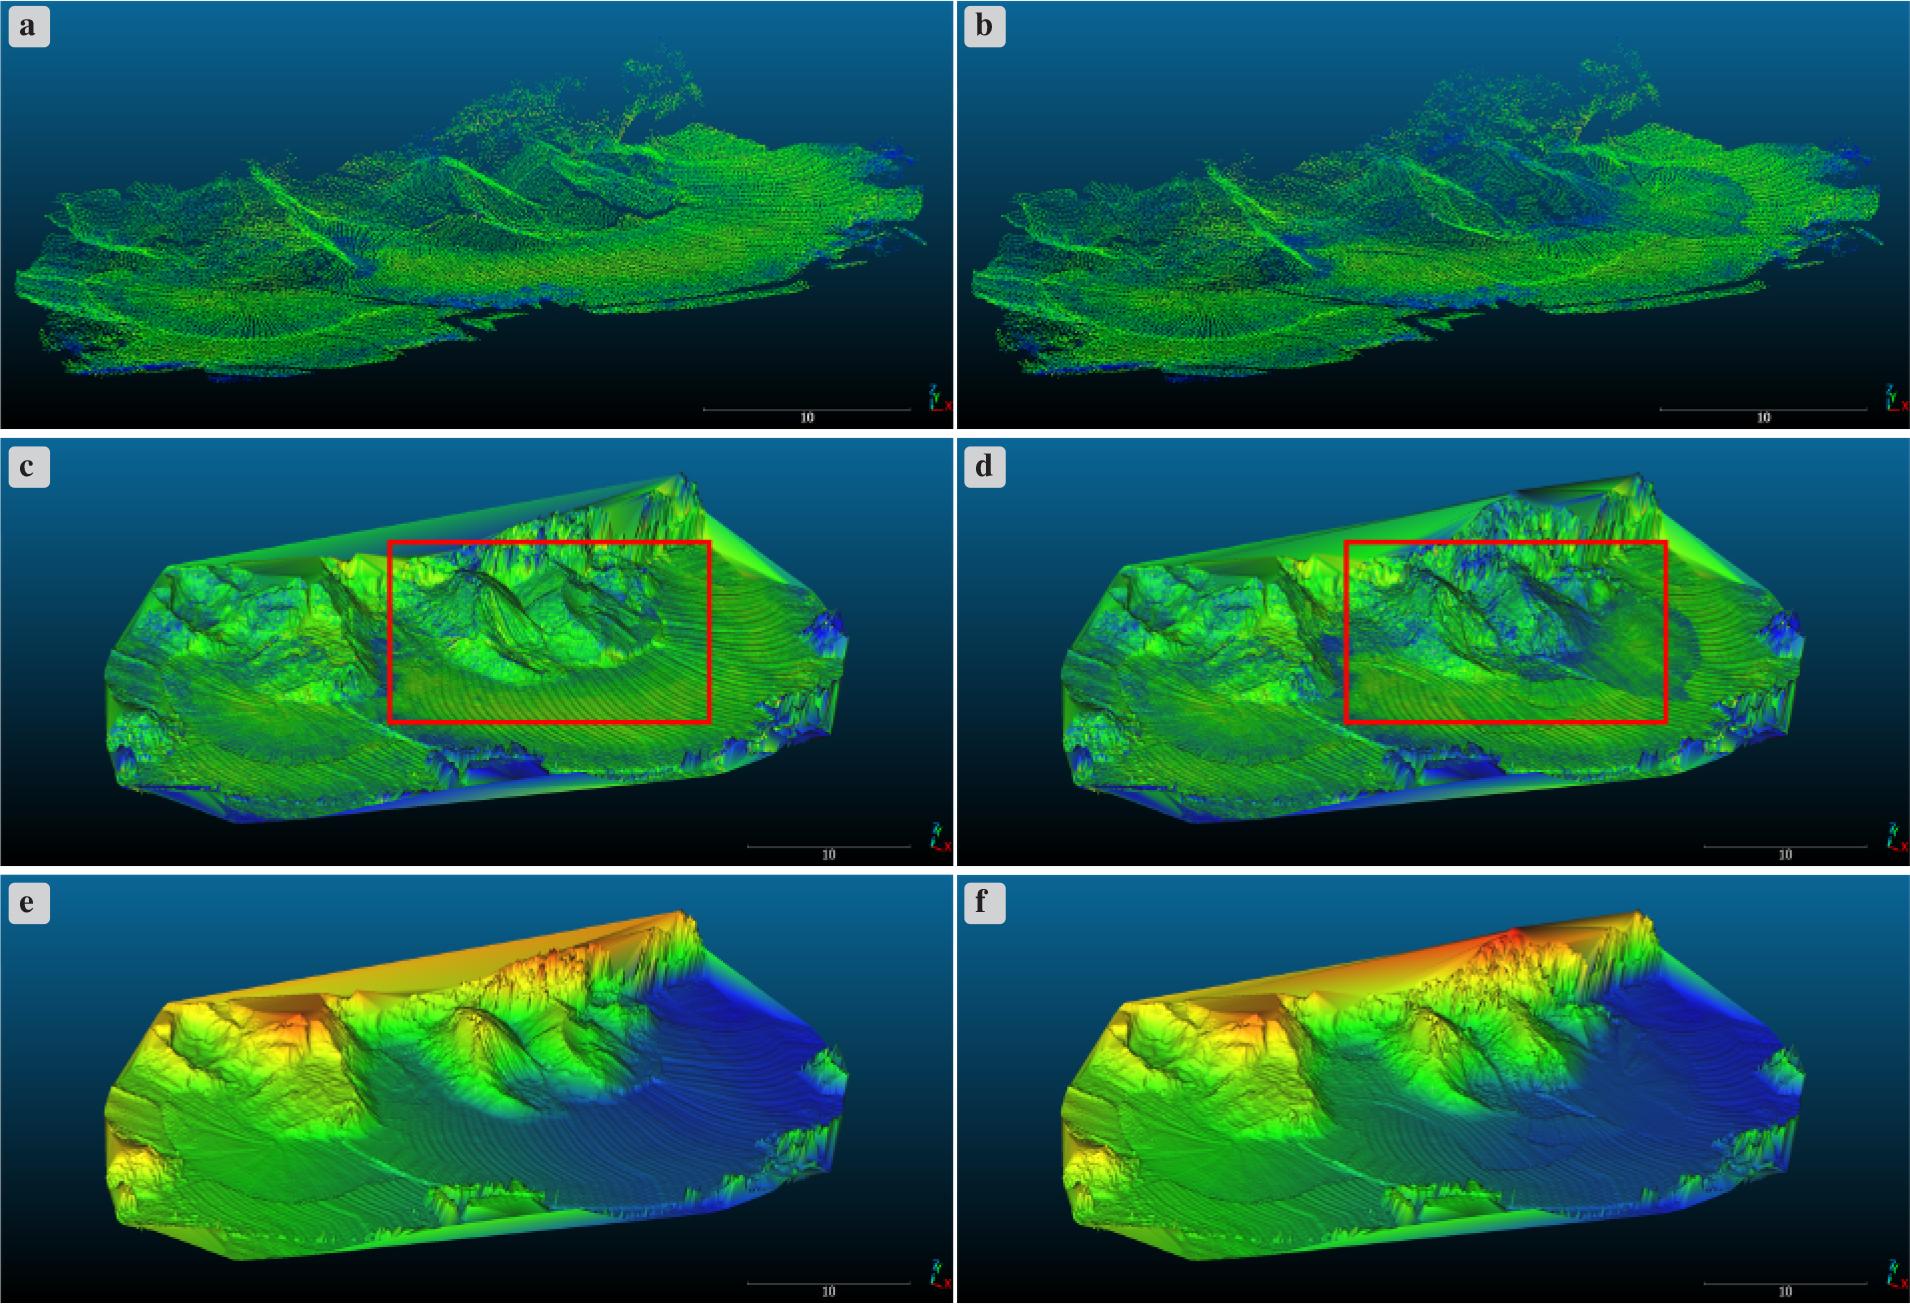
Figure 8.
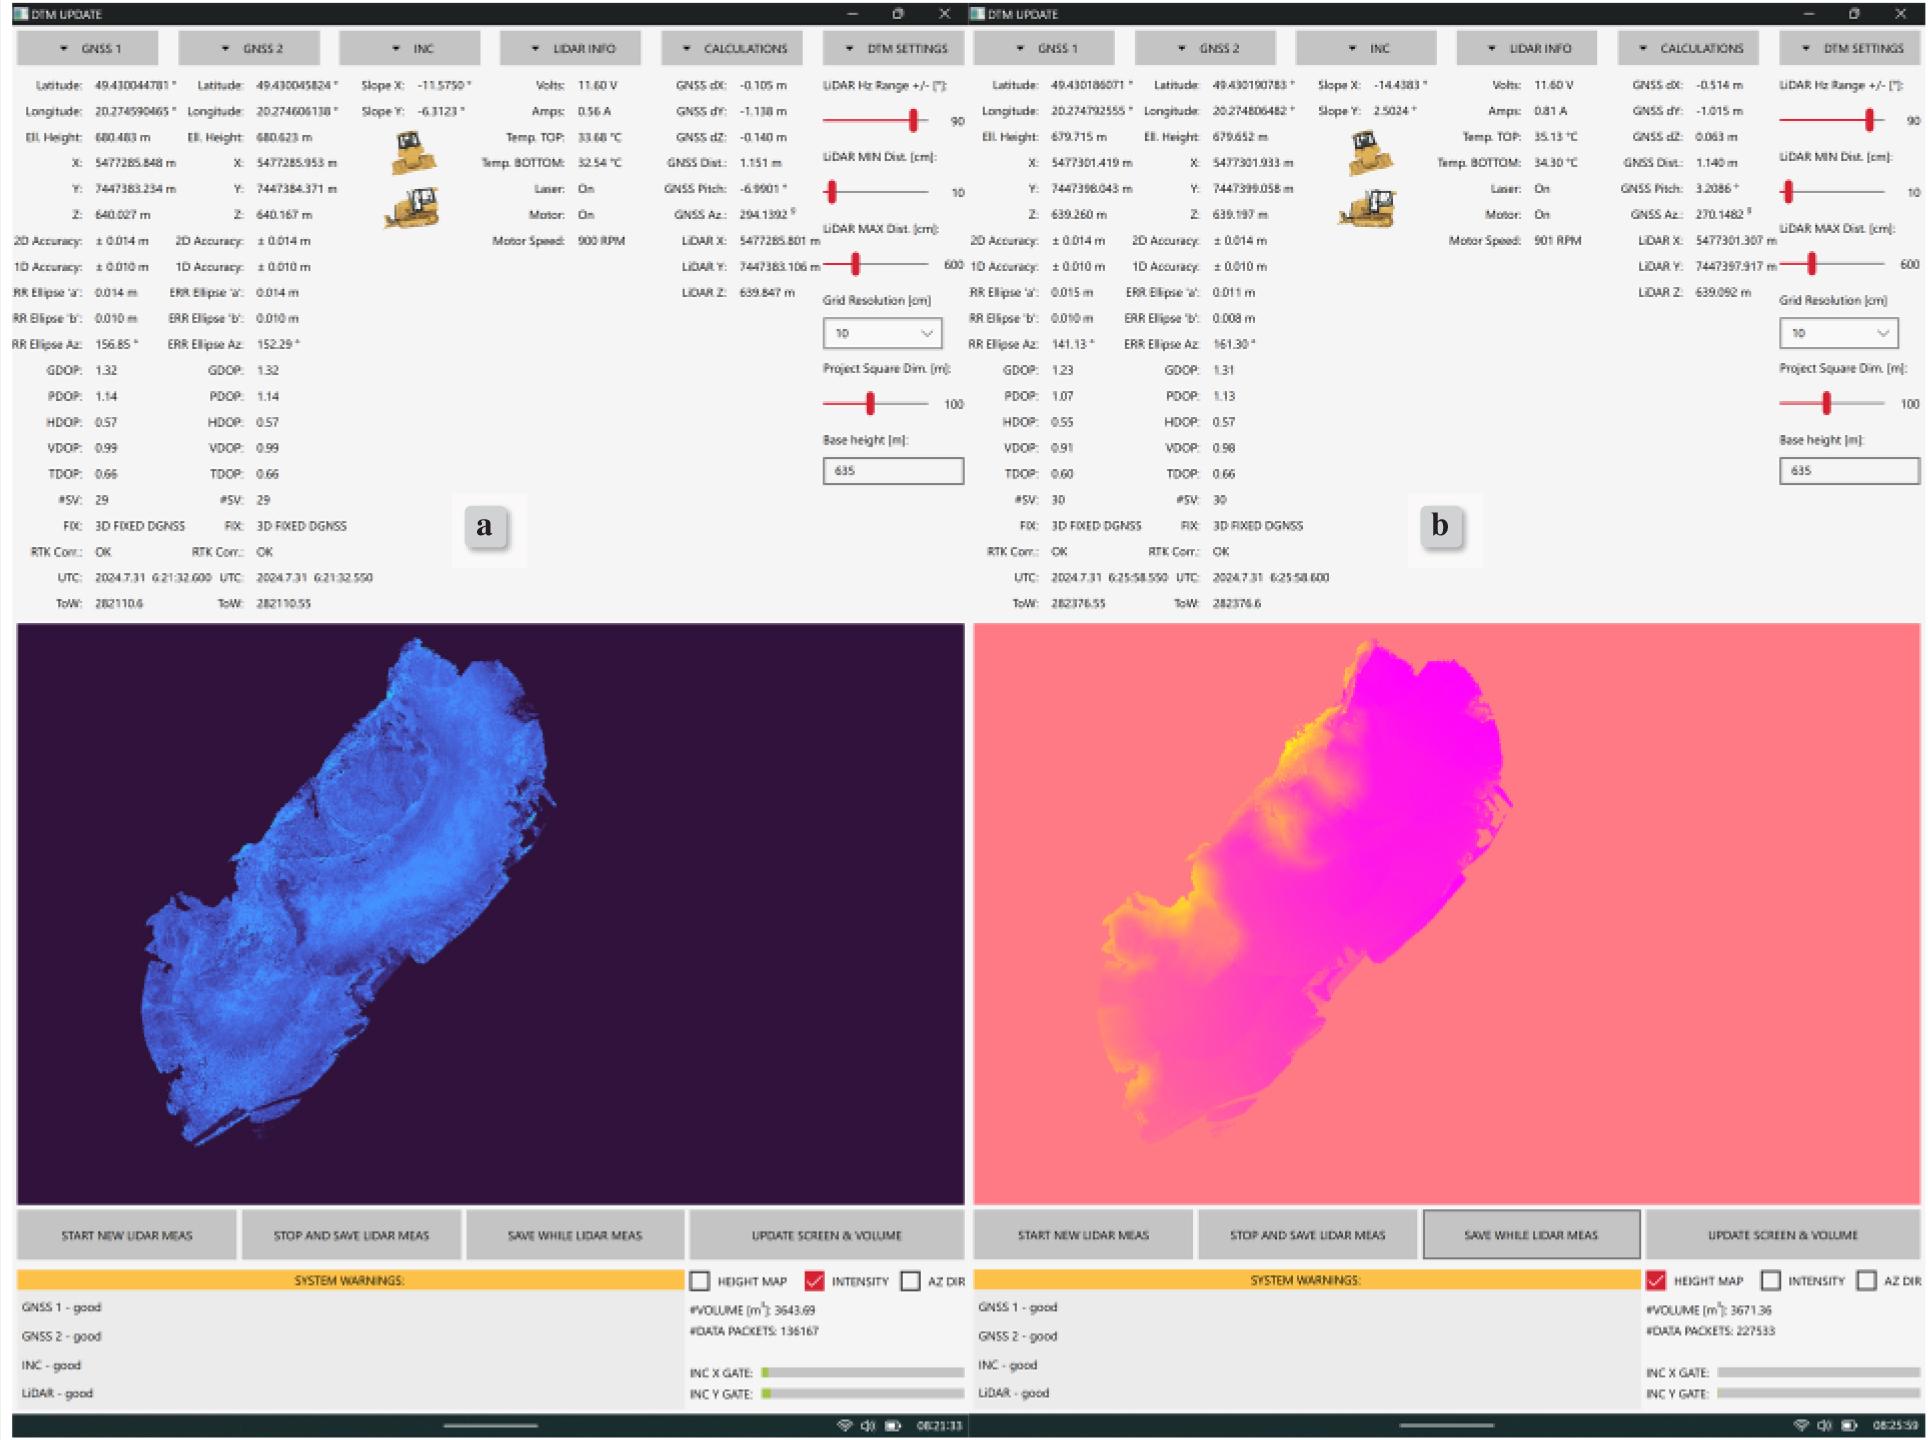
Figure 9.

Figure 10.
![Distances [cm] on the ground between points from all the 16 LiDAR channels, with the sensor mounted as specified: 3 m above the ground, at an angle of 45°, maximum distance 6 m](https://sciendo-parsed.s3.eu-central-1.amazonaws.com/68ed236481e1b93419696e64/j_acee-2025-0041_fig_010.jpg?X-Amz-Algorithm=AWS4-HMAC-SHA256&X-Amz-Content-Sha256=UNSIGNED-PAYLOAD&X-Amz-Credential=ASIA6AP2G7AKAKFZSQ4S%2F20251211%2Feu-central-1%2Fs3%2Faws4_request&X-Amz-Date=20251211T052051Z&X-Amz-Expires=3600&X-Amz-Security-Token=IQoJb3JpZ2luX2VjEBsaDGV1LWNlbnRyYWwtMSJGMEQCIAnUIIQh2x9uXaMaRgOwjE6xRek3higXJ2HH7ChYlFV6AiAl6IhwxqtrqlDU5eupSSjZzfzCFZhb%2FZeiQS0BvR2AGirGBQjl%2F%2F%2F%2F%2F%2F%2F%2F%2F%2F8BEAIaDDk2MzEzNDI4OTk0MCIMMFEF3a%2Bg4Q60BOMbKpoFTFaRJqAG6ReW9OSs0zKk%2BQjWqiRjMNnjnB89T7LMHqv4WgAnrH28cs7FcgvDcx%2FMuUMcQad8G40FhcKmFnVXN4DntJRGi%2B9ncgLpbdlMZuuIUr6WT39A7fyGHhsRbw88kHvLqm2iSMQVQ%2FSpeMgsE%2BF5aW%2BjDghYbOXkfVTAXD7sz2DPd8rs%2FdrN%2FE8JPWTNcQvW67Jyc%2BaKczmnJy5SQ1Sc7B3T98EA3YUcXoU0%2B5ZwXwuqGth5BcUopBy2D76vlIk6euMP9%2BKpB8L7bthI5RjN2RXGgjo8qjomGpbwxZZ7LovMPWLbzpTAr1Nij0d%2FfmucbGLnznZEqYMCo5tWQDIoCpGWJ%2B757Sv%2FNnG28Iu1%2BPRmoQUWCM87WRqRQLRDAXakTFJG1dAYBdRWzBf7oKGF%2ByUs2q%2FCwbHz2nAVVIaJQ3hkOtdr3MHPfgkYIottbWvndbshLDZA7y6rBe8uAgN1E15gliMDlj7nX1cHseYt4c51UfiNksj%2BeIN9sR27pT%2BDTPsODKH06ytjidLGzbkf7SBLGupHUS8C22ZyCmSYHOthWceM%2B%2F8tOQUe0YyJjxJ%2Fry3vvF1K8oge1H0N3ds09XbgGIRmQl%2FbjpM8cVWpdlKu0A%2FeBZQAhZWs0NMiWwXOSOpV7Rye7lKGmf72tDQ7u27KcEN%2FpoZXXQ%2F0W0XaXkQU8J73pnk1k0X%2BzC3rxpjs3cVzqDSYii3lSvpfmt8X9zNbAFjUinhW%2FplOTjYvZGG7ue16%2F0MnYK8l%2Bg2tPuZZvjCvaEunaU6jEUwYlebz3HLcEM02V3gG7gxU4eFEfUvTCb%2Bxb30jx22nm9ezaZ9gTy9nUwcPFHoPHhWChRCbF5tUVc2%2BNQRtyHHAGfa0N1GHjYvJ8siNMOzy6MkGOrIBt1akoC1FyoO4vhyAzhsB3jQfnXZn%2FJkZNy6tChKU6kjfjURy0grD7Fxr%2FIKwId2UZGxDFcHsP8Mjtf%2BYQSZpsAMeLoy%2BKmcepfYg%2BgRoiMck12mbUKS%2BXNCFInHCV0Il7LkzhkTj9SRTDojWwumOrYWMSQHrsUNDrBcMfsJOucedOdEr8xj1LHEUfzotIeOiuh7PVT9uH%2Fc4kthjerf%2FUBAPJgE8fKRx6CrVqUgoUvSMaw%3D%3D&X-Amz-Signature=d0005d09de5478078c60cd321e85b1ff8832ff2a661ce46090155dd903d6f542&X-Amz-SignedHeaders=host&x-amz-checksum-mode=ENABLED&x-id=GetObject)
Dependence of the moving speed (assuming the rotational speed of the LiDAR sensor is 900 RPM) on terrain coverage with measurements
Dependence of the azimuthal resolution at a distance of 6 m on the rotational LiDAR speed
Maximum project dimensions depending on the selected resolution of DTM grid
| Grid resolution (pixel size) [m] | Max project area [m2] | Example dimensions [m] |
|---|---|---|
| 0.01 | 90,000 | 300 × 300 |
| 0.02 | 360,000 | 600 × 600 |
| 0.04 | 1,440,000 | 1200 × 1200 |
| 0.05 | 2,250,000 | 1500 × 1500 |
| 0.10 | 9,000,000 | 3000 × 3000 |
| 0.20 | 36,000,000 | 6000 × 3000 |
| 0.25 | 56,250,000 | 7500 × 3000 |
| 0.50 | 225,000,000 | 15000 × 3000 |
| 1 | 900,000,000 | 30000 × 3000 |