Figure 1.
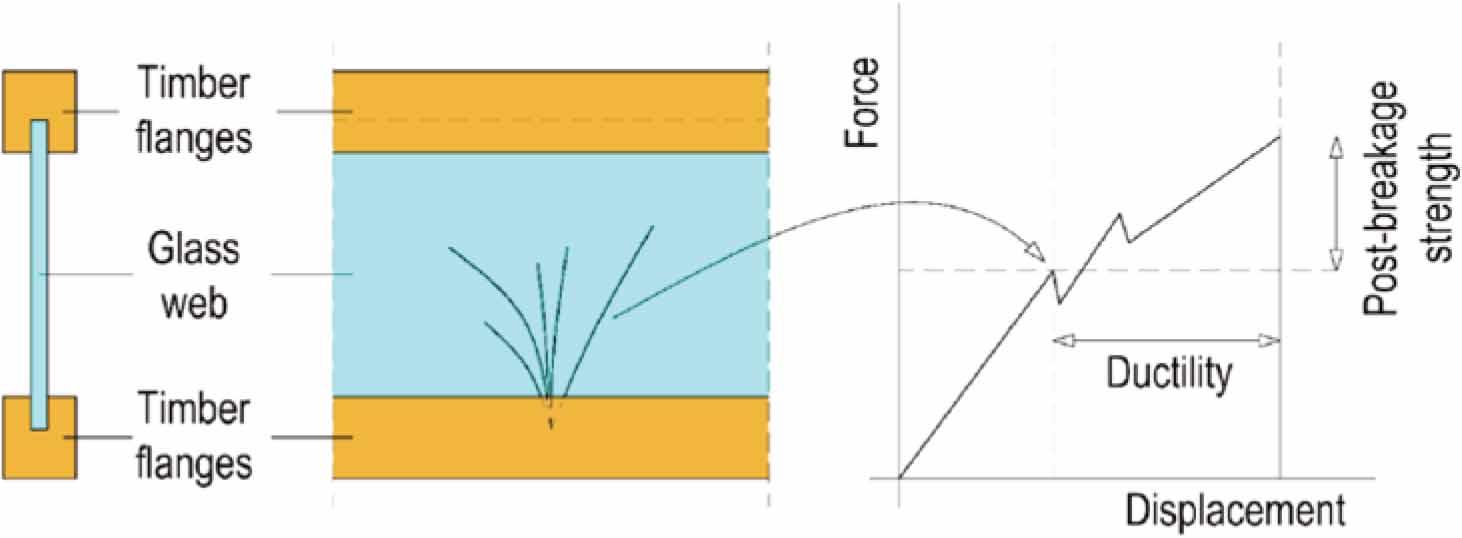
Figure 2.
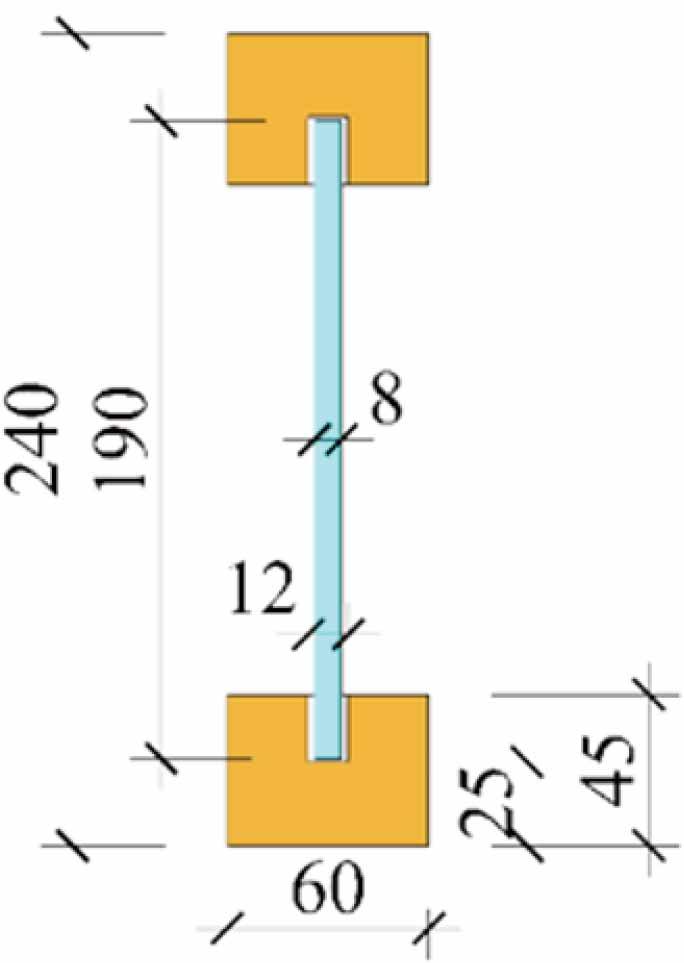
Figure 3.

Figure 4.
![Experimental load-displacement plots for beams type TGCB1 obtained from the four-point bending tests [26,27,28]. Notation: E = Epoxy, A = Acrylate, S = Silicone, AF = annealed float, HS = heat-strengthened](https://sciendo-parsed.s3.eu-central-1.amazonaws.com/68ed236481e1b93419696e64/j_acee-2025-0039_fig_004.jpg?X-Amz-Algorithm=AWS4-HMAC-SHA256&X-Amz-Content-Sha256=UNSIGNED-PAYLOAD&X-Amz-Credential=AKIA6AP2G7AKOUXAVR44%2F20251209%2Feu-central-1%2Fs3%2Faws4_request&X-Amz-Date=20251209T144609Z&X-Amz-Expires=3600&X-Amz-Signature=bbb71e9262aebcc44914c0674bb9642544c7fa1fd0135910f16a246caa1416db&X-Amz-SignedHeaders=host&x-amz-checksum-mode=ENABLED&x-id=GetObject)
Figure 5.
![Experimental load-displacement plots for beams type TGCB2 obtained from the four-point bending tests [13,14]. Notation: A = Acrylate, S = Silicone, LN = large groove (no edge treatment), SP = small groove (polished edges)](https://sciendo-parsed.s3.eu-central-1.amazonaws.com/68ed236481e1b93419696e64/j_acee-2025-0039_fig_005.jpg?X-Amz-Algorithm=AWS4-HMAC-SHA256&X-Amz-Content-Sha256=UNSIGNED-PAYLOAD&X-Amz-Credential=AKIA6AP2G7AKOUXAVR44%2F20251209%2Feu-central-1%2Fs3%2Faws4_request&X-Amz-Date=20251209T144609Z&X-Amz-Expires=3600&X-Amz-Signature=2c7f725687eee742ae0ab8f44386d6d3dd52cf9e8d4407cb206a2de92f6e2353&X-Amz-SignedHeaders=host&x-amz-checksum-mode=ENABLED&x-id=GetObject)
Figure 6
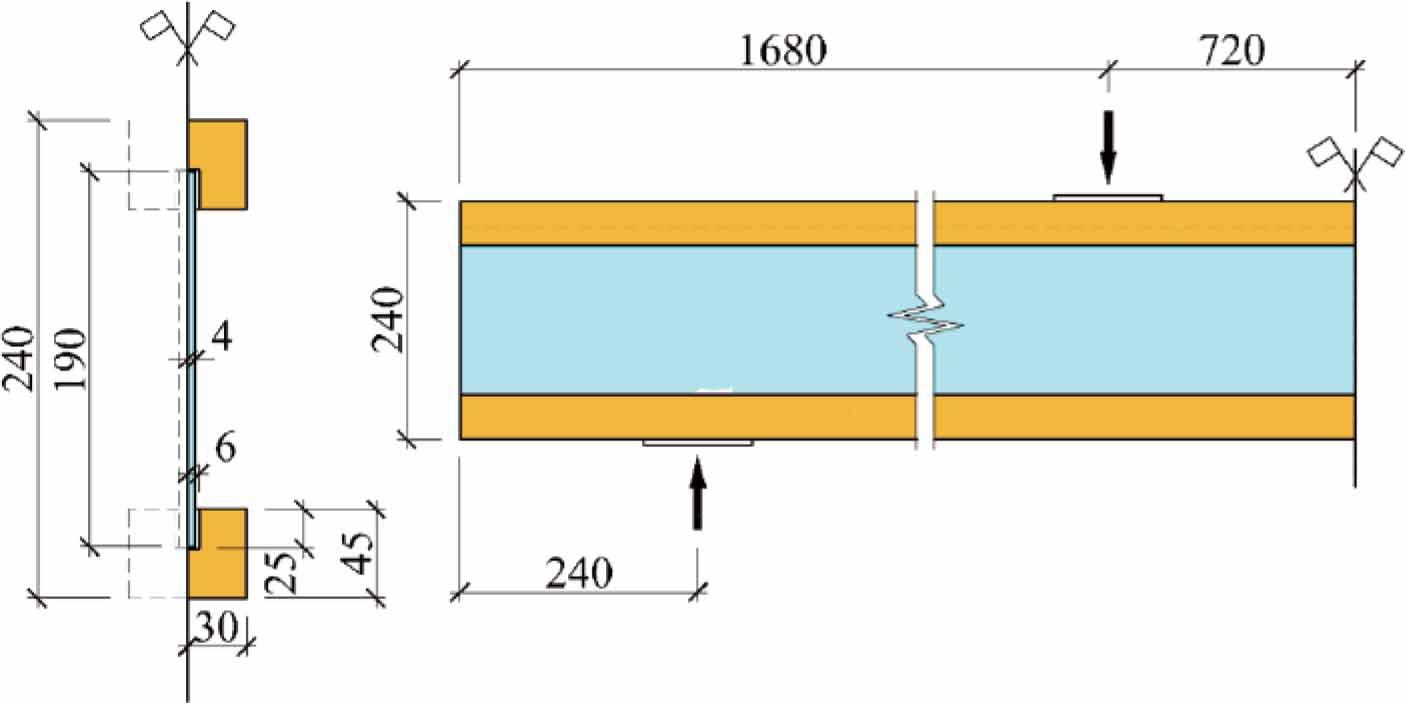
Figure 7.
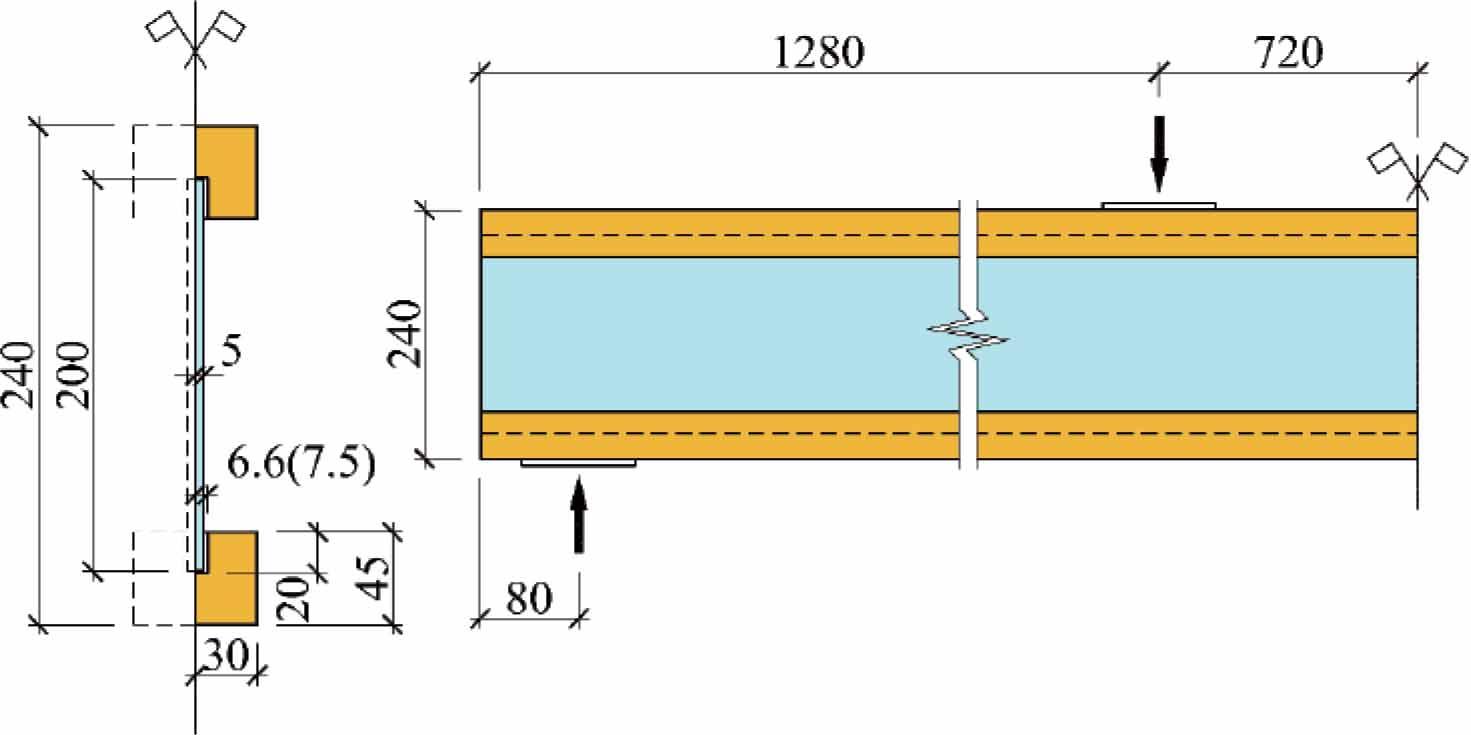
Figure 8.

Figure 9.
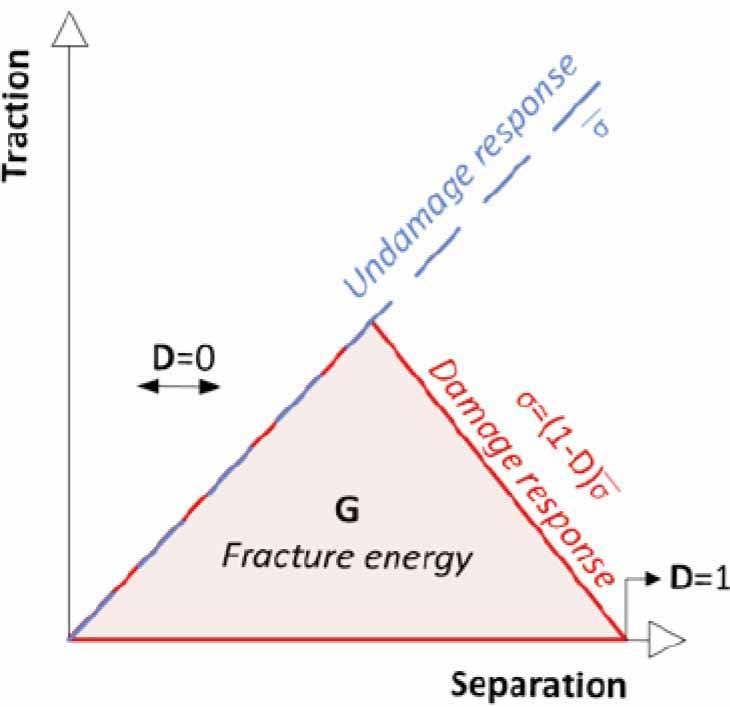
Figure 10.
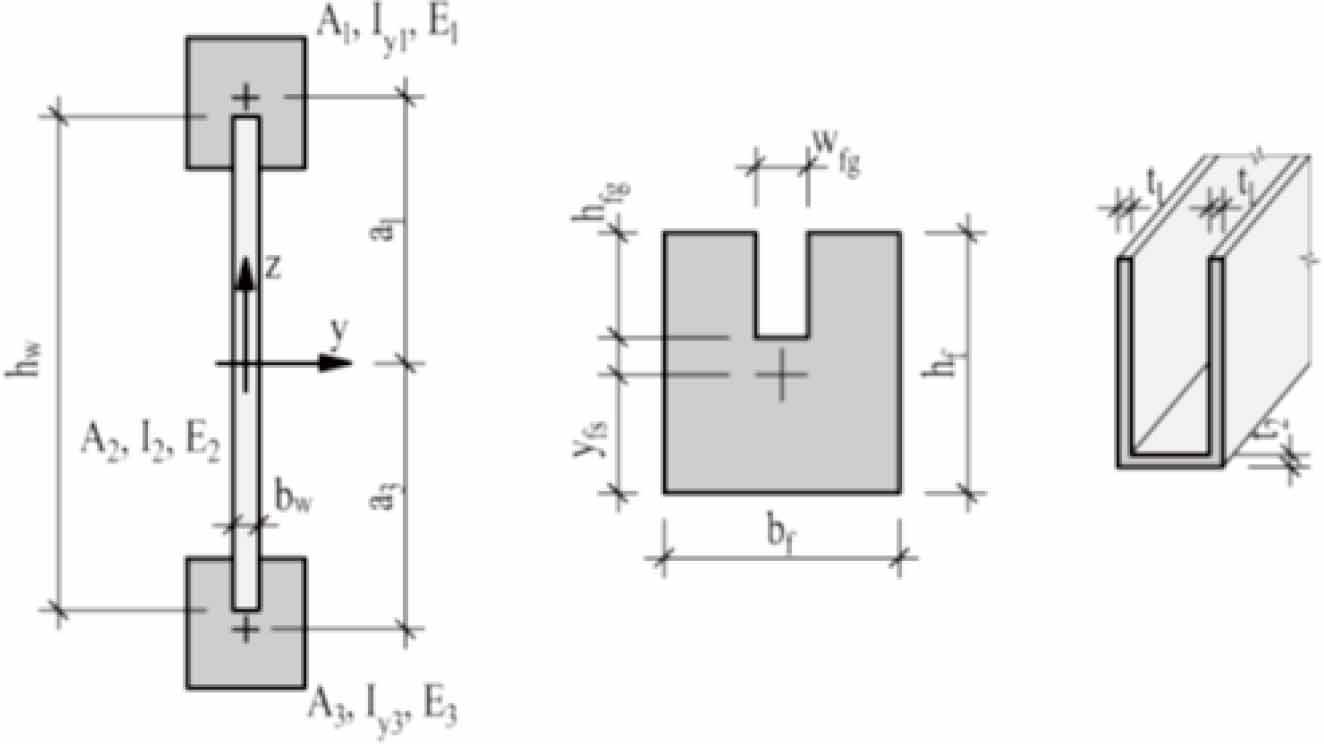
Figure 11.

Figure 12.
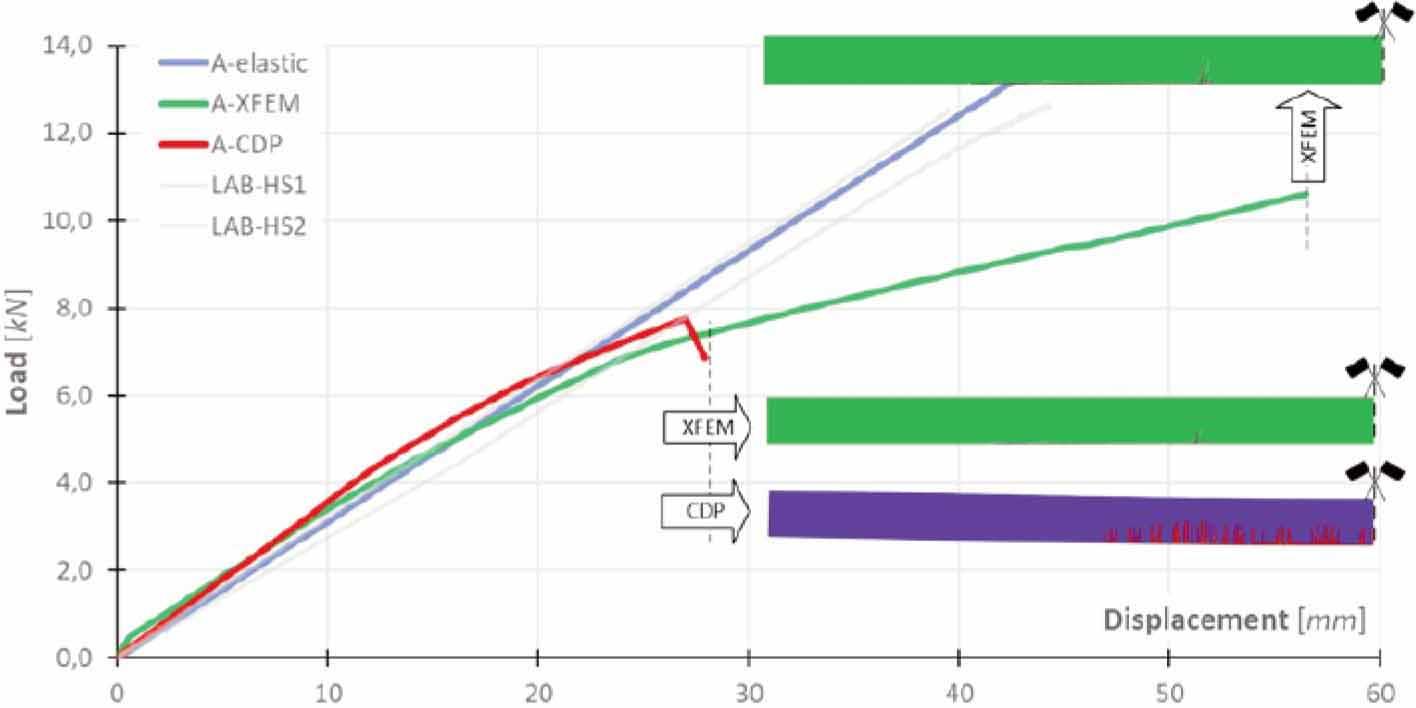
Figure 13.
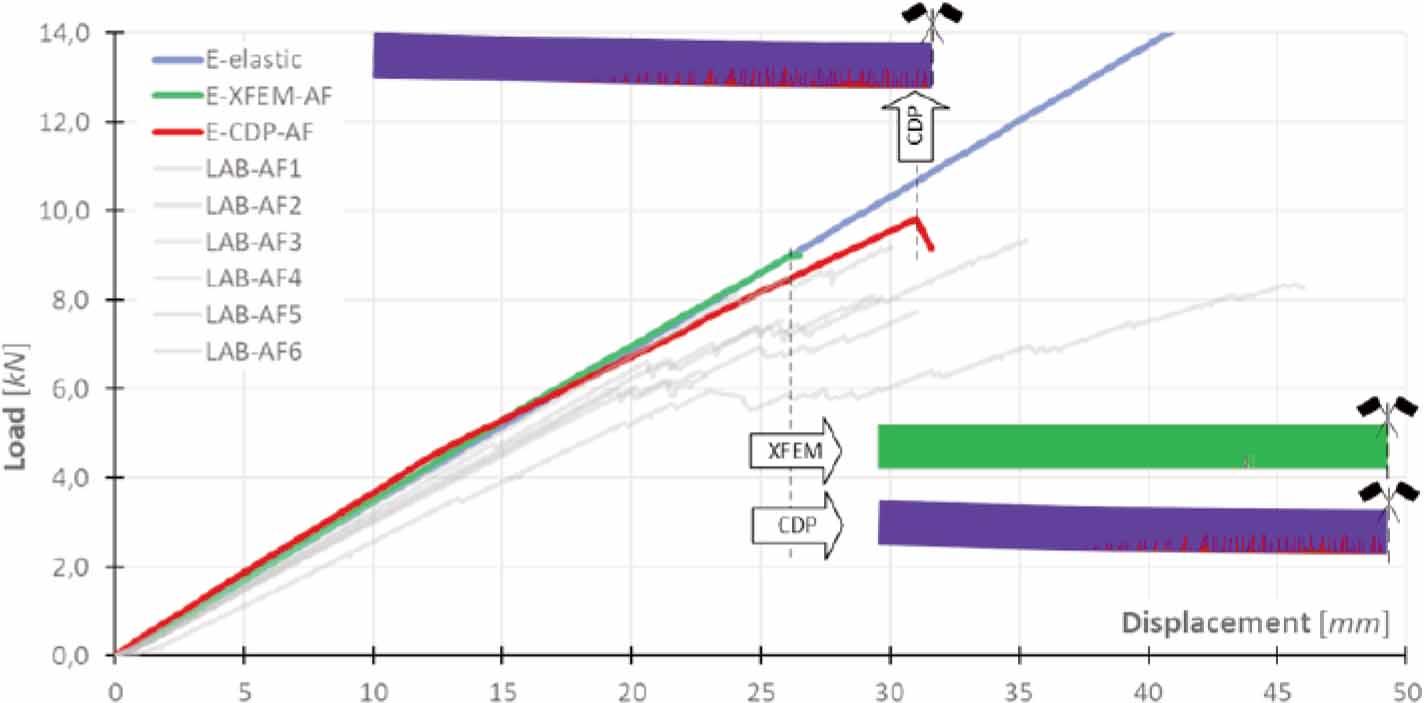
Figure 14

Figure 15.

Figure 16.

Figure 17

Figure 18.
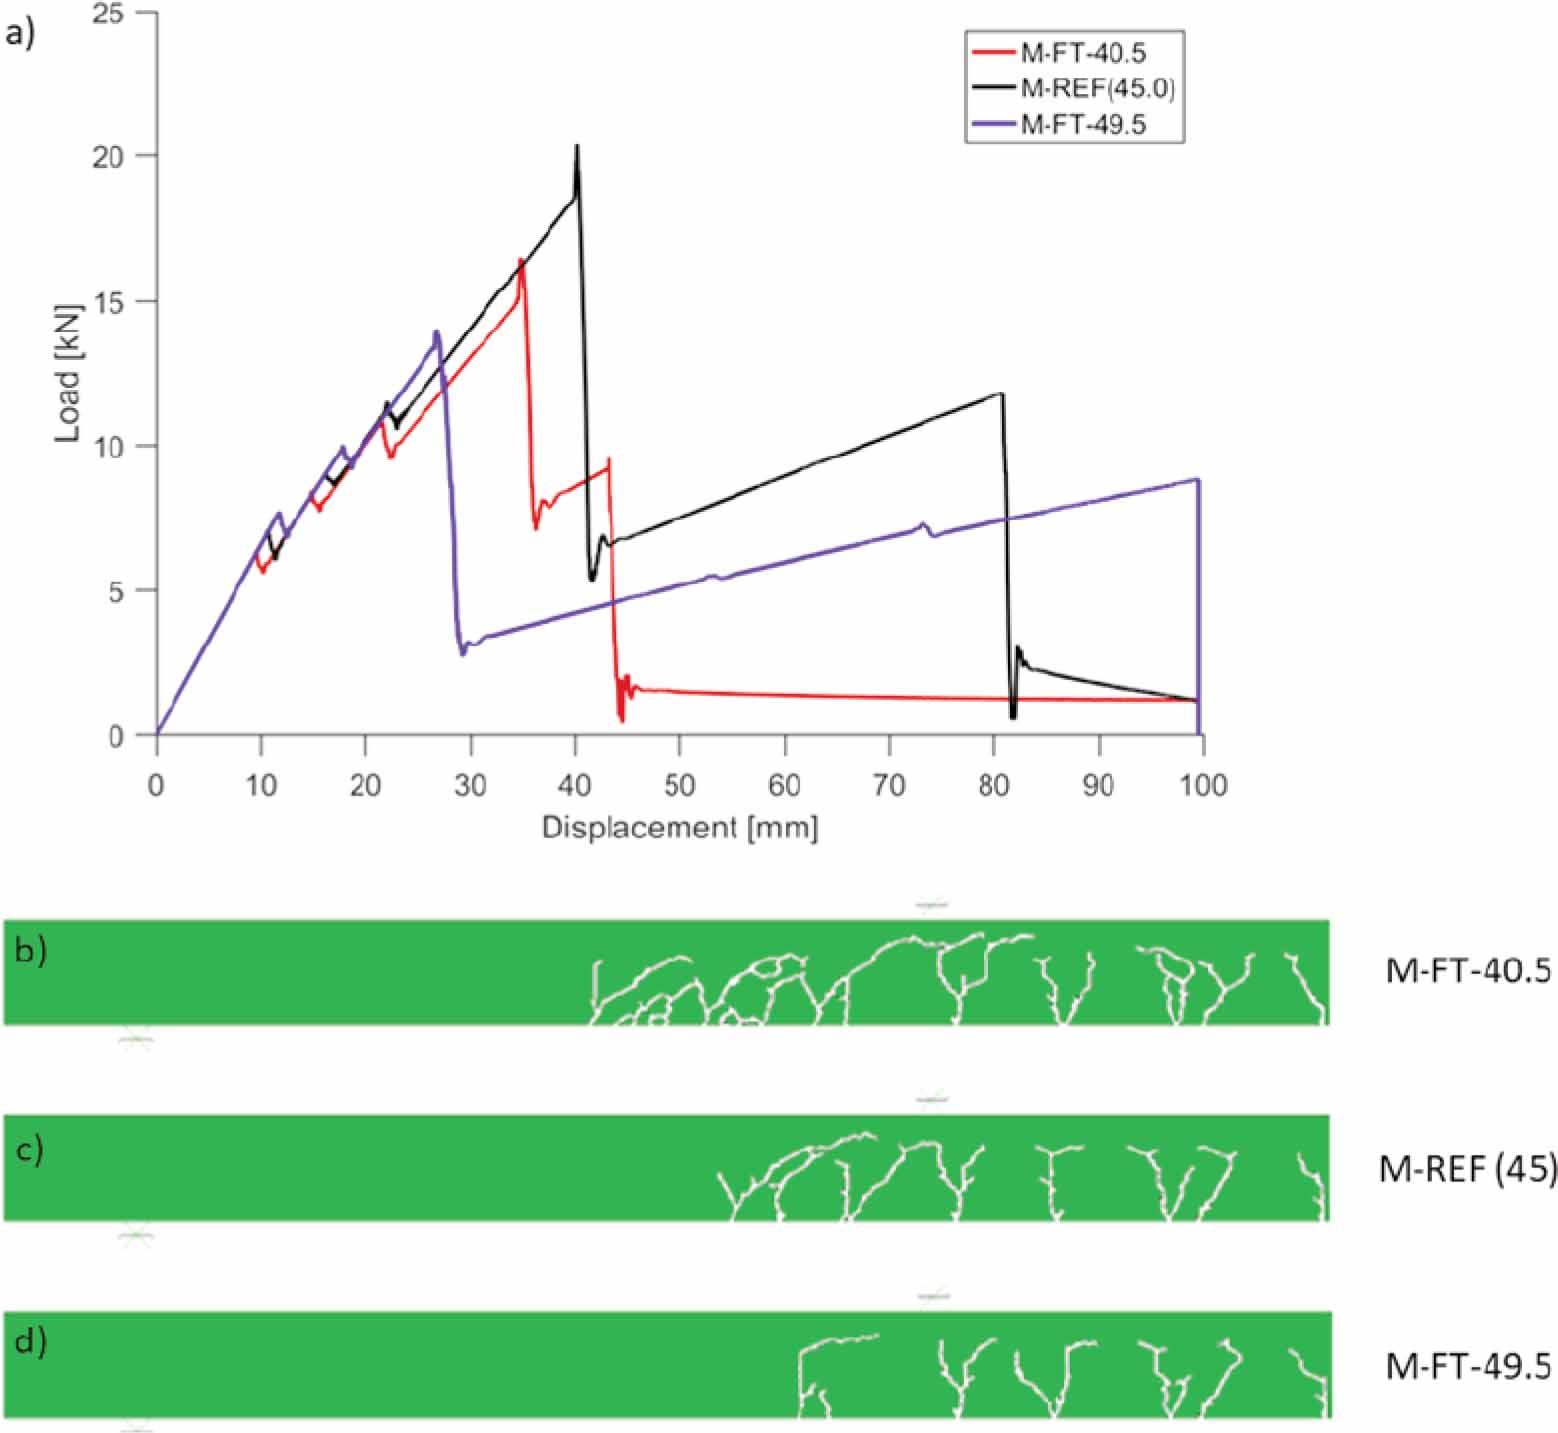
Figure 19.
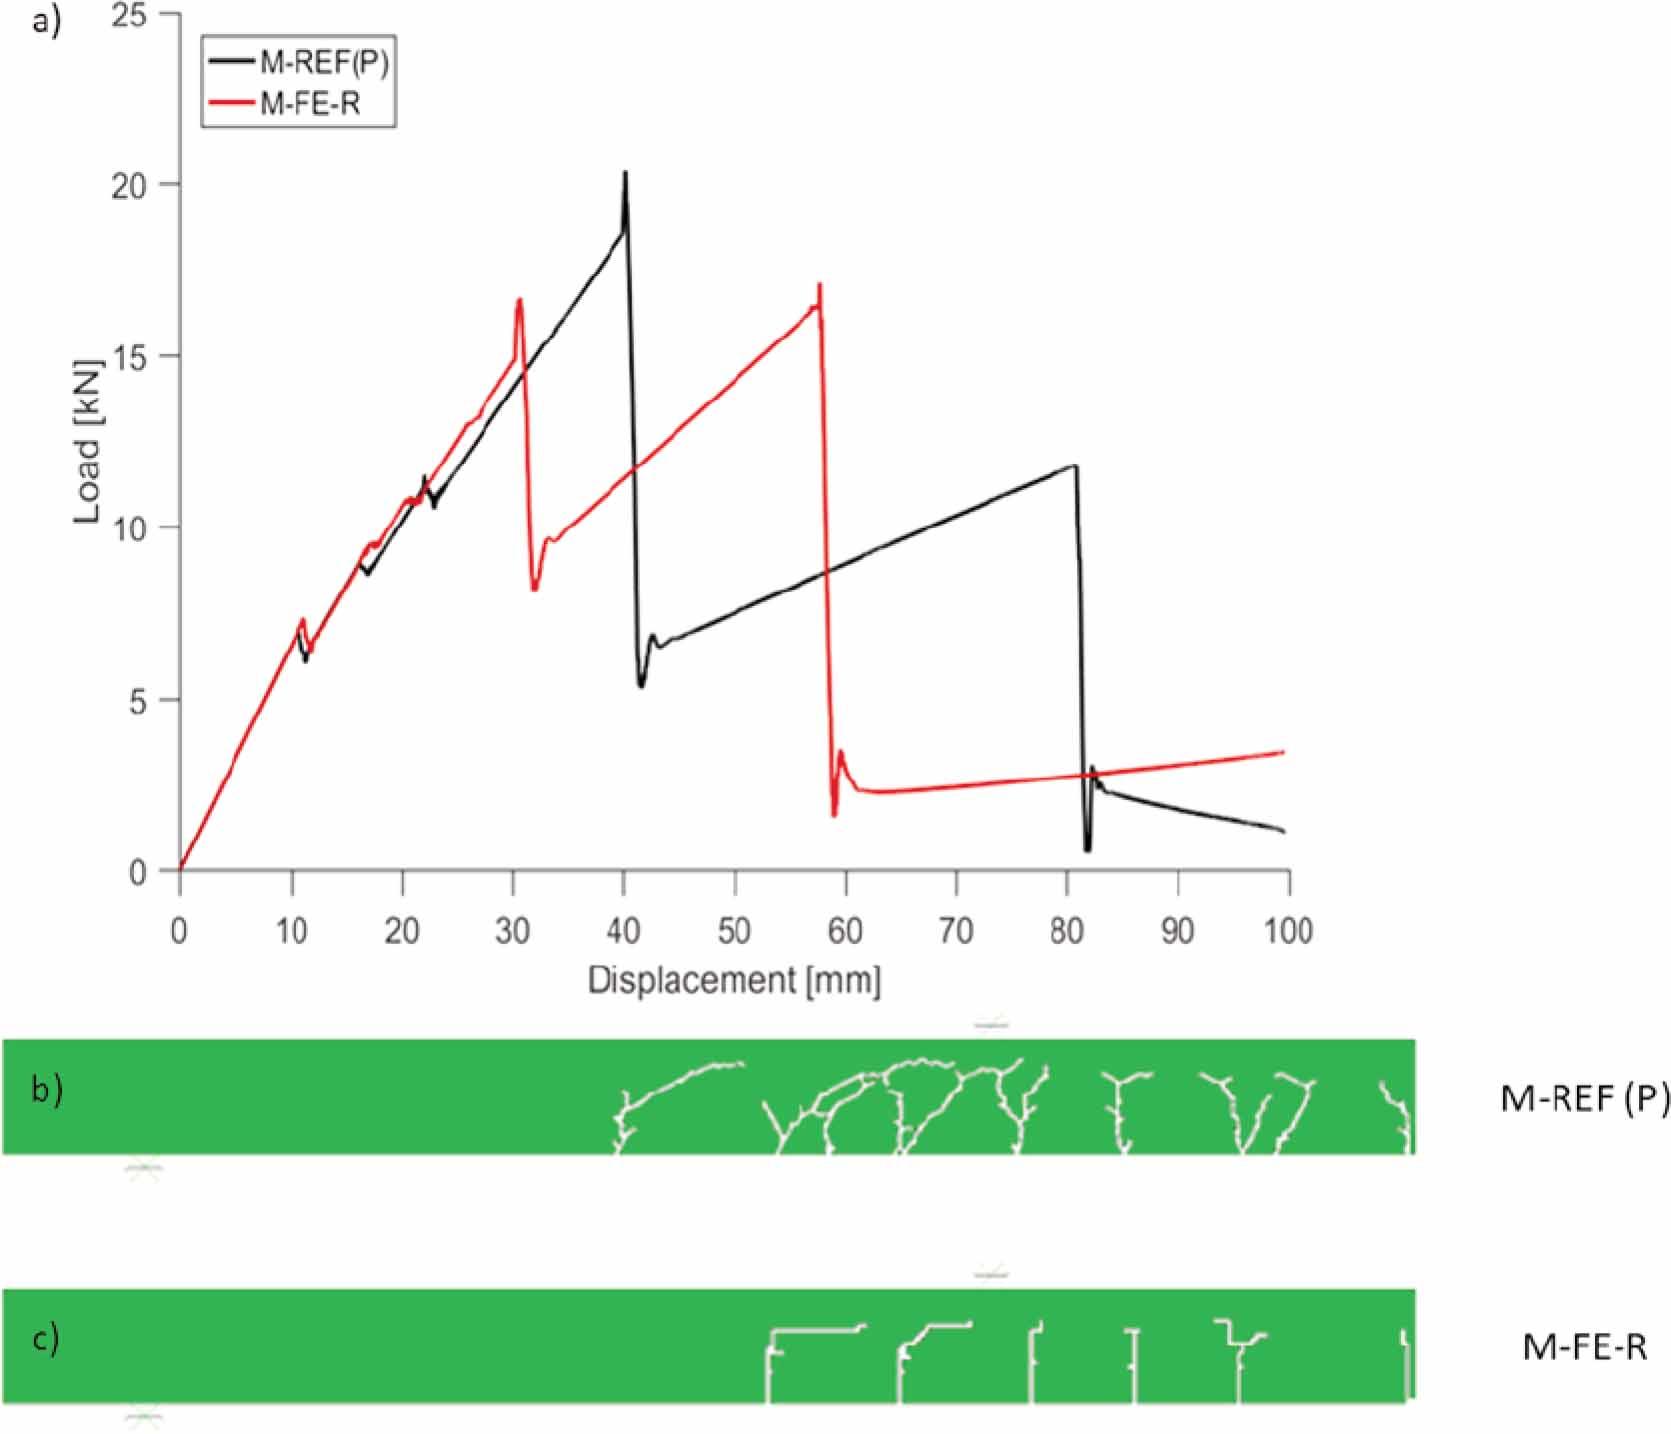
Figure 20.
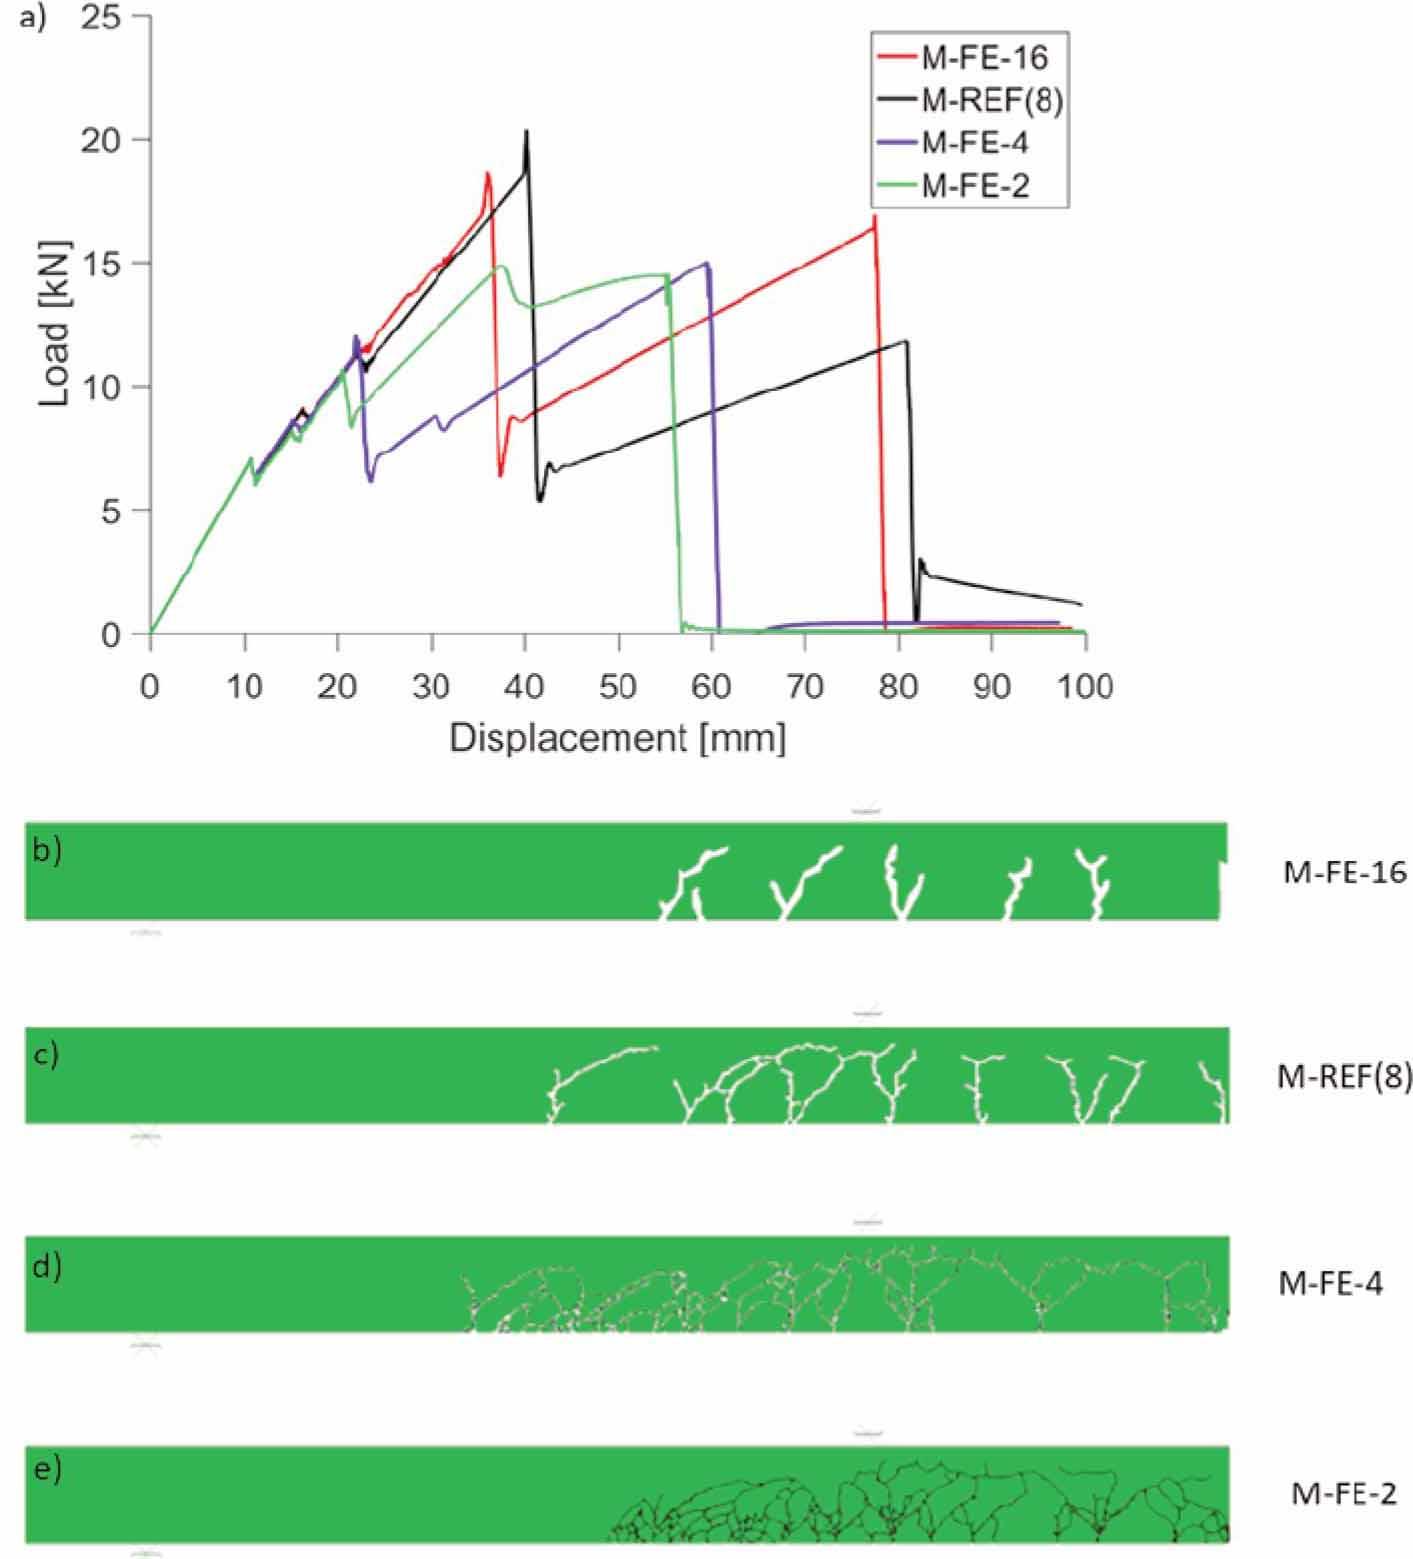
Figure 21.
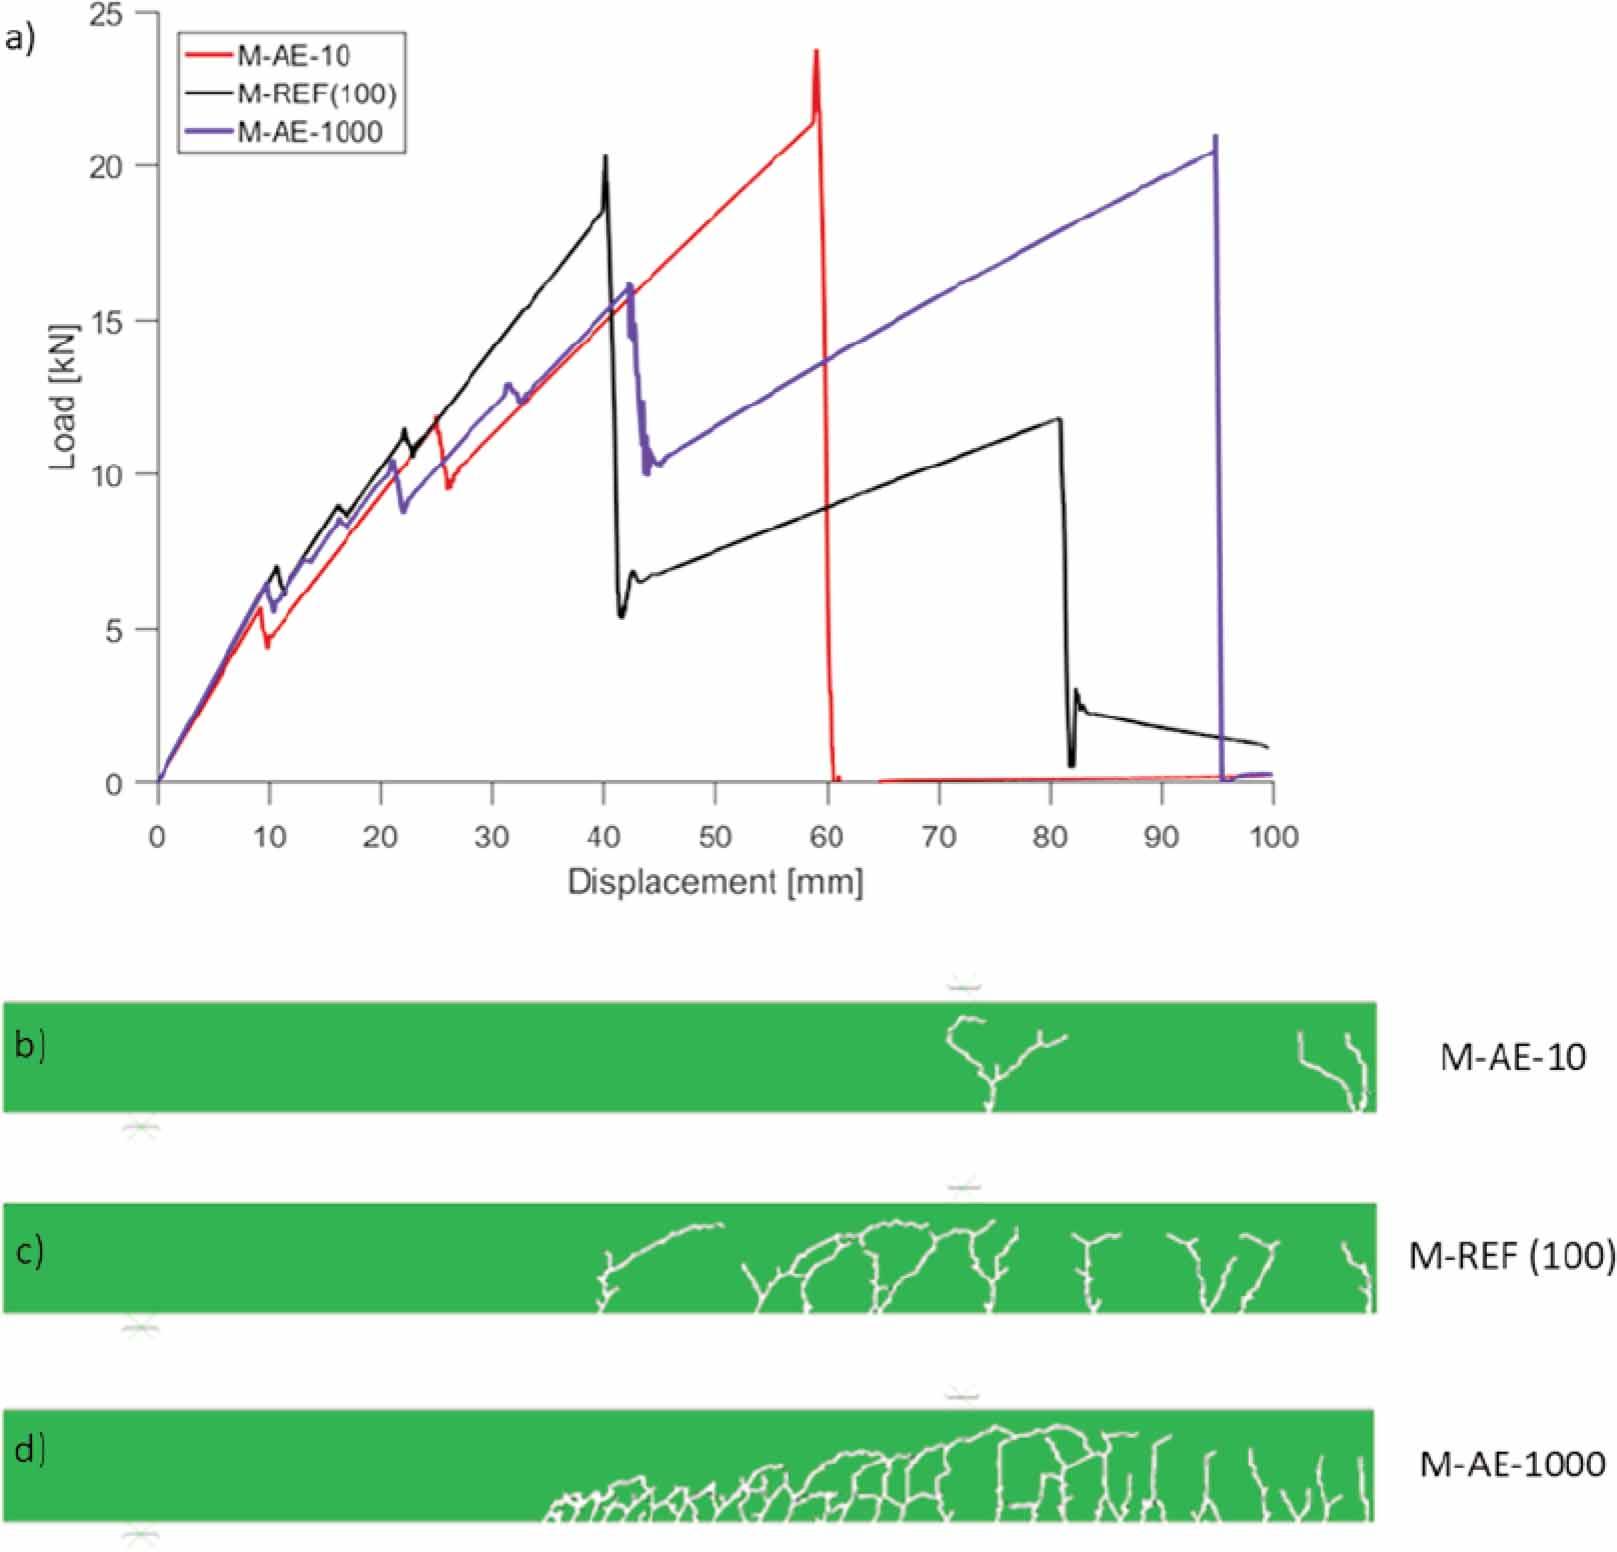
Figure 22.
![Comparison between numerical and experimental [27] loaddisplacement plots for the beam TBCB1_E_AF. Effects of different tensile strength of glass](https://sciendo-parsed.s3.eu-central-1.amazonaws.com/68ed236481e1b93419696e64/j_acee-2025-0039_fig_022.jpg?X-Amz-Algorithm=AWS4-HMAC-SHA256&X-Amz-Content-Sha256=UNSIGNED-PAYLOAD&X-Amz-Credential=AKIA6AP2G7AKOUXAVR44%2F20251209%2Feu-central-1%2Fs3%2Faws4_request&X-Amz-Date=20251209T144609Z&X-Amz-Expires=3600&X-Amz-Signature=825a27c5002b98c95052560a2dc00d6ad697229e2c4cb1cc6b83de828a8ebba0&X-Amz-SignedHeaders=host&x-amz-checksum-mode=ENABLED&x-id=GetObject)
Figure 23.
![Comparison between numerical and experimental [13,14] load-displacement plots for the beam type TBCB2](https://sciendo-parsed.s3.eu-central-1.amazonaws.com/68ed236481e1b93419696e64/j_acee-2025-0039_fig_023.jpg?X-Amz-Algorithm=AWS4-HMAC-SHA256&X-Amz-Content-Sha256=UNSIGNED-PAYLOAD&X-Amz-Credential=AKIA6AP2G7AKOUXAVR44%2F20251209%2Feu-central-1%2Fs3%2Faws4_request&X-Amz-Date=20251209T144609Z&X-Amz-Expires=3600&X-Amz-Signature=dc9257b7a08630f036d62c771a9d01b84f8a07e485bcf883d128c71b14c3bde0&X-Amz-SignedHeaders=host&x-amz-checksum-mode=ENABLED&x-id=GetObject)
Experimental results (mean values and standard deviations) for beam specimens [13,14,26,27,28] and corresponding FE and analytical predictions_ Notation: PBSI – Post-breakage strength index PBSI = 100 × (Finit - Fult) / Fult_, PCDI - Post-cracking ductility index, PCDI = 100 × (uinit - uult) / uult, FE = 100 × (resultFE – resultEXP) / resultEXP, AN = 100 × (resultAN – resultEXP) / resultEXP
| Experiments | Finite Element | Analytical | |||||||||||
|---|---|---|---|---|---|---|---|---|---|---|---|---|---|
| Beam model | Fint [kN] | Fult [kN] | PBSI [%] | PCDI [%] | Kinit [MNm2] | Model | Fint [kN] | Fult [kN] | PBSI [%] | PCDI [%] | Kinit [MNm2] | Fint [kN] | Kinit [MNm2] |
| TGCB1_E_AF | 11.6 (2.8) | 16.4 (2.2) | 51.5 (50) | 91.2 (86.7) | 0.898 (0.042) | E_AF_FE_FT45 | 7.2 | 12.2 | 70.6 | 176.9 | 0.920 | 7.5 | 0.817 |
| ΔFE/ΔAN= | -38.4% | -25.7% | 41.3% | 94.3% | 4.9% | ||||||||
| E_AF_FE_FT66 | 10.5 | 15.6 | 48.2 | 109.7 | 2.5% | 10.9 | -9.0% | ||||||
| ΔFE/ΔAN= | -9.3% | -4.94% | -3.6% | 20.5% | 3.6% | ||||||||
| TGCB1_E_HS | 25.5 (-) | 25.5 (-) | - | - | 0.898 (-) | E_HS_FE_FT45 | 25.5 | 25.5 | - | - | 24.5 | ||
| ΔFE/ΔAN= | 0.1% | 0.1% | -3.9% | ||||||||||
| TGCB1_A_HS | 25.5 (-) | 25.5 (-) | - | - | 0.907 | A_HS_FE_FT45 | 24.6 | 24.6 | - | - | 0.904 | 24.4 | 0.808 |
| ΔFE/ΔAN= | -2.4% | -2.4% | -0.3% | -3.9% | -10.6% | ||||||||
| TGCB1_S_HS | 19.8 (-) | 19.8 (-) | - | - | 0.720 | S_HS_FE_FT45 | 18.3 | 18.3 | - | - | 0.692 | 19.1 | 0.630 |
| ΔFE/ΔAN= | -7.7% | -7.7% | -3.9% | -3.5% | -12.5% | ||||||||
| TGCB2_A_AF_L | 11.1 (1.3) | 28.3 (2.4) | 158 (24.0) | 298 (51.2) | 1.253 () | A_AF_FE_L_ FT45 | 10.3 | 27.0 | 162 | 325.5 | 1.349 | 9.4 | 1.069 |
| ΔFE/ΔAN= | -7.4% | -4.7% | 4.9% | 8.9% | 7.66% | -15.3% | 3.8% | ||||||
| TGCB2_A_AF_S | 13.0 (1.1) | 28.7 (2.3) | 122 (24.0) | 210 (39.0) | 1.237 () | A_AF_FE_SG_FT45 | 10.5 | 21.8 | 108 | 302 | 1.367 | 9.6 | 1.081 |
| ΔFE/ΔAN= | -19.2% | -23.8% | -11.4 | -43.6% | 10.5% | -26.2% | 6.3% | ||||||
| TGCB2_S_AF_L | 8.8 (-) | 20.3 (-) | 131 (-) | 536 (-) | 0.918 (-) | S_AF_FE_SG_ FT45 | 8.2 | 22.8 | 179 | 465 | 1.075 | 7.4 | 0.826 |
| ΔFE/ΔAN= | -6.9% | 12.4% | 36.7% | -13.3% | 17.1% | -15.9% | -10.0% | ||||||
Material properties used in numerical models for timber [27, 42]
| Material | Et,l | Et,r | Et,t | νt, lr | νlt | νrt | Glr | Glt | Grt | ρt | ft |
|---|---|---|---|---|---|---|---|---|---|---|---|
| [MPa] | [MPa] | [MPa] | - | - | - | [MPa] | [MPa] | [MPa] | [kg/m3] | [MPa] | |
| Pine wood | 12 410 | 880 | 880 | 0.44 | 0.40 | 0.52 | 1 090 | 1 090 | 140 | 510 | 34.9 |
| LVL | 11 600 | 750 | 750 | 0.44 | 0.40 | 0.52 | 930 | 930 | 120 | 510 | 50 |
Material properties used in numerical models for adhesives [27]
| Adhesive | ρ [kN/m3] | E [MPa] | ν [-] |
| Silicone | 5 | 3 | 0.49 |
| Acrylate | 5 | 100 | 0.40 |
| Epoxy | 5 | 1 595 | 0.46 |
Overview of TGCB1, manufactured beam type TGCB1, n is the number of specimens produced
| Beam type | Adhesive | Glass type | Length [mm] | Total height [mm] | Glass pane size [mm2] | Glass thickness [mm] | Timber block size [mm2] | Groove size [mm] |
|---|---|---|---|---|---|---|---|---|
| TGCB1 | Epoxy (n=6) | Annealed float | 4800 | 240 | 4800×190 | 8 | 45×60 | 12×20 |
| Epoxy (n=2) Acrylate (n=2) Silicone (n=2) | Heat-strengthened |
Overview of manufactured beams, type TGCB2, n is the number of specimens produced [13,14]
| Beam type | Adhesive | Glass type | Length [mm] | Total height [mm] | Glass pane size [mm2] | Glass thickness [mm] | Timber block size [mm2] | Groove size [mm] |
|---|---|---|---|---|---|---|---|---|
| TGCB1 | (n=1) | Annealed float | 3500 | 240 | 3500×200 | 10 | 45×60 | 13(15)×25 |
Mechanical and geometrical properties of parametric models_ Notation: R = Rectangular, P = Prism
| Variation | FE/model | ft [MPa] | FE size [mm] | FE geometry [-] | Eint [MPa] |
|---|---|---|---|---|---|
| Reference | M-REF | 45.0 | 8 | P | 100 |
| Variation of tensile strength of glass | M-FT-40.5 | 40.5 | 8 | P | 100 |
| M-FT-49.5 | 49.5 | 8 | P | 100 | |
| Variation of FE size | M-FE-R | 45 | 8 | R | 100 |
| Variation of FE geometry | M-FE-16 | 45 | 16 | P | 100 |
| M-FE-4 | 45 | 4 | P | 100 | |
| M-FE-2 | 45 | 2 | P | 100 | |
| Variation of adhesive stiffness | M-AE-10 | 45 | 8 | P | 10 |
| M-AE-1000 | 45 | 8 | P | 1000 |