Current trends in modern architecture focus on minimising the boundaries between the external environment and the interior of a building. This requires a continuous increase in the number of translucent surfaces that allow natural sunlight to enter the building, not only in facades, but also as interior elements. Contact with the outside living environment is also one of the most important psychological aspects [1], and natural sunlight has positive impact on the health and quality of life of people living or working in buildings [2]. For this reason, the possibility of increasingthe translucent surfaces by the use of glass structural components is desirable. In addition, modern trends in architecture are orientated towards high quality of life and low energy consumption, into which modern glass and wood products fit perfectly [3].
Today, timber and glass are widely used in many architectural applications. Solutions such as glass panes bonded to timber frames were known for a long time. However, traditional solutions assume that glass only adhesives the frame, it does not contribute to the loadbearing behaviour, but only transfers wind load to the structural frame. Thus, the glass pane requires a substructure to support external loads. Research on timber-glass composite beams is based on a different assumption, namely, that timber and glass work together to carry external loads. Glass no longer acts as a filling, but actively participates in load transfer. It becomes equivalent to timber, a structural element. Timber is a natural material, environmentally friendly, and perfectly in line with principles of sustainable development. Its high strength-to-weight ratio in combination with its low thermal conductivity makes timber a strong alternative to other construction materials. Additionally, an increased use of timber as a material for structural purposes allows a reduction in CO2 emissions, mitigating climate change in accordance with international agreements.
Despite the undeniably desirable properties of glass, such as translucency, strength, and durability, the material glass itself poses many difficulties in structural considerations [4]. First, it is an extremely brittle material – when overloaded, it breaks immediately into shards within a second. In contrast to, for example, steel, in case of which failure is preceded by large plastic deformation, glass fails with no warning. Second, glass is extremely susceptible to stress concentrations as a result of the inability to redistribute stress by local yielding of the material. Therefore, it is a big challenge to design proper structural connections between glass elements avoiding solutions that do not cause stress peaks. Finally, glass is much weaker in tension than in compression, limiting its scope of application, especially in bending and tension components. A traditional approach to design glass elements takes the above aspects and therefore involves the use of tempered glass. Tempered glass has a considerably higher strength than annealed float glass but breaks into small shards and therefore does not present post-breakage strength [4]. In addition to that, the commonly used approach is to laminate a few panes together to minimise the probability of total glass failure. In case of breakage of one pane, the remaining are designed to carry the load. Finally, current design approaches are based on the use of very high safety factors and the application of sacrificial sheets to the laminate to protect the load-bearing core [4]. In conclusion, conservative approaches are uneconomical and do not fully take advantage of the material glass.
The paper focusses on the combination of glass and timber materials in a way to work in synergistic cooperation. It involves the most important mechanical properties of very different materials: the stiffness and the strength of glass and ductile nature of timber to build modern, safe and durable building components. The concept of timber-glass composite beams involves a single-pane web made of annealed float glass and timber block flanges bonded together with an adhesive; see Fig. 1. Under loading the stress in the glass web increases until it reaches the tensile strength of glass resulting in a brittle failure, however, in does not lead to the total failure of the composite beam. Even if the glass web fails, the glass shards are held in place by the timber flanges, and the beam can still withstand loading. The timber flange with the bond line adhesive connection acts as a bridge: the forces that before failure were carried by the tensile zone of the web are now transferred by the timber flange. Therefore, the concept prevents brittle failure of the beam, provides ductility, and offers a post-breakage strength after initial glass failure (e.g. caused by overloading or vandalism). The post-breakage (residual) strength relates to an increased value of the load at final collapse of a beam in relation to the load at which an initial crack in the web occurs. Ductility, on the other hand, refers to the increase of deformation after the initial failure of the glass web. A schematic representation of timber-glass composite beams and safety concepts is presented in Fig. 1.
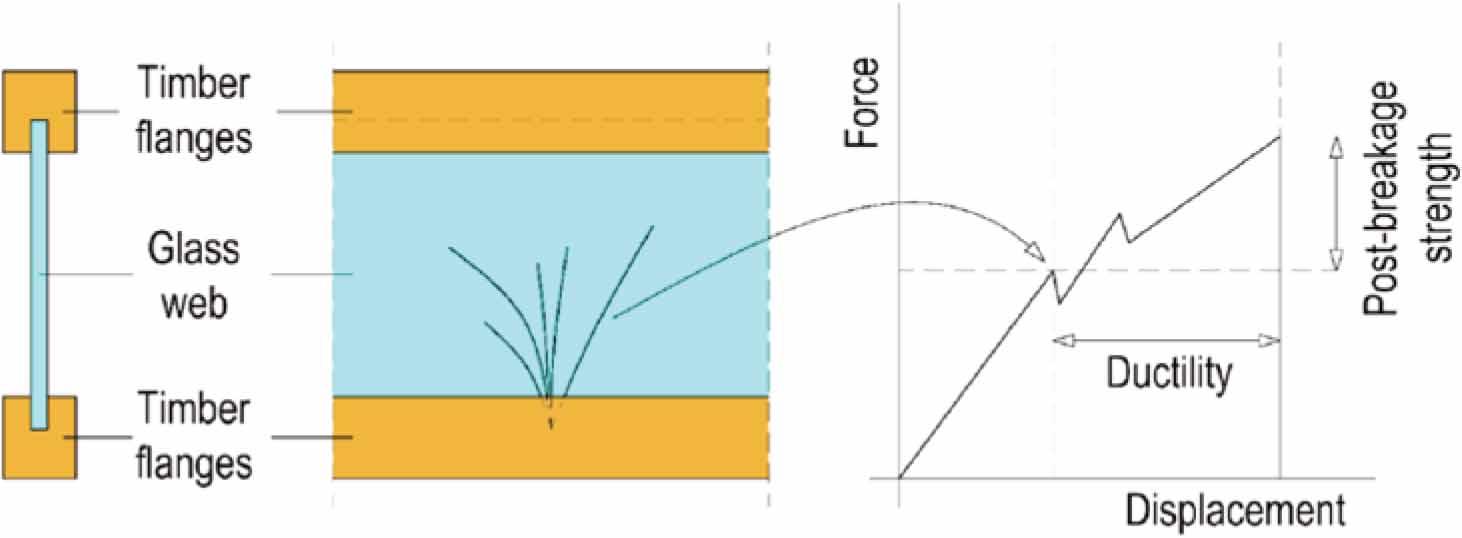
Schematic representation of timber-glass composite beam concept: cross-section of hybrid beam (left), side-view of hybrid beam with cracked glass web (middle), force-displacement diagram showing ductility and post-breakage strength (right)
The current knowledge on the synergetic features of timber-glass composites relates to a few previously conducted research projects within the last 15 years. Early examples of timber-glass composites were presented in the mid-1990s and early 2000s [5,6,7]. More detailed research was done by several researchers [8,9,10,11,12,13,14,15,16].
The concept developed by Kreher was applied to the roof structure of the Palafitte Hotel in Monruz, Switzerland [7,10]. The beams support a light roof and transfer snow and wind load to steel posts hidden inside external walls. Each 6000 mm long and 580 mm deep I-shaped composite beams composed of a single glass pane and timber flanges bonded on both sides of the glass web. The upper flange consisted of two solid timber blocks 100 × 160 mm whereas the lower flange involved two timber blocks 65 × 65 mm. For the web, a 12 mm thick glass pane made of fully tempered glass was used. Due to the lack of postbreakage strength of toughened glass, the upper flanges were designed to resist external loads even in the case of total failure of a glass web. This solution ensured the structural safety of the supporting roof structure. The beams were examined in four-point bending; the maximal load obtained during the test was approximately three times higher than the design load on the roof structure.
Numerical simulation of glass beams, in particular glass fracture, has been investigated before. The first approaches of these investigations used plane-stress methods that required implementation of computational code [17,18,19,20]. The results of more advanced models using the ABAQUS [21] platform and the brittle cracking material model, also applied in the research presented in the paper, were reported in [22,23,24,25].
The article presents a numerical study on the structural behaviour of timber-glass composite beams made of annealed floating glass panes and timber flanges bonded with adhesives of different stiffness. The first part of the paper presents a summary of experimental tests of two types of timber-glass composite beams varying in length, glass thickness, material used for flanges, and type of adhesive used to bond the glass web to the flanges. The campaign involved four-point bending tests to assess the structural behaviour and investigate the influence of the stiffness of the bond line on the global behaviour of the beams under loading. The second part of the paper describes the numerical models developed to simulate the flexural behaviour of timber-glass composite beams. Finite element (FE) models are developed to simulate the elastic (linear) and post-failure flexural behaviour of timber-glass composite beams. A few different types of numerical models, available in ABAQUS [21], were considered for analysis. A smeared crack model is used to simulate the non-linear material behaviour of glass. The others were an analysis based on the standard (Implicit) solution using the XFEM and the Concrete Damaged Plasticity (CDP) model. The objectives of the numerical analyses were to investigate the influence of various parameters such as glass strength, finite element formulation, finite element mesh size, and variation of adhesive stiffness on the results. Finally, experimental and numerical results are compared and discussed in terms of initial bending stiffness, load at first cracking in glass, ultimate load and crack pattern together with global progressive failure.
The present paper is complementary point of view to the loading of the composite beams during static four-point bending including FE models with experiments and an analytical approach to estimate the initial bending stiffness and load at first cracking in the glass.
This section presents a summary of experimental research developed to assess the structural performance of timber-glass composite I-beams in four-point bending. The experimental campaigns were carried out at Linneaus University (LnU) in Växjö, Sweden, within the European WoodWisdom-Net research project “LBTGC – Load bearing timberglass composites” [13]. More detailed information on beam manufacture and details of the experimental setup and tests can be found in [26,27,28].
In total, twelve I-beams from timber-glass composites, denoted TGCB1, with two different glass types and three adhesives were produced and tested in four-point bending, see Table 1. The beams were 240 mm deep and 4800 mm long with a cross section according to the sketch shown in Fig. 2. For the wooden flanges, finger-jointed pine studs were used. For the webs, two types of glass were used: annealed float glass and heat-strengthened glass. Compared to annealed float glass, which breaks into large pieces, the fracture pattern of heat-strengthened glass is more similar to that of tempered glass. All webs were 190 × 4800 mm2 with a thickness of 8 mm. To minimise the influence of edge quality on the glass strength, after traditional cutting to desired dimensions, all edges were polished. For adhesive bonding, three different types of adhesive of different stiffness were used: Sikasil SG-500 (silicone), SikaFast 5221 (acrylate), and 3M DP490 (epoxy).
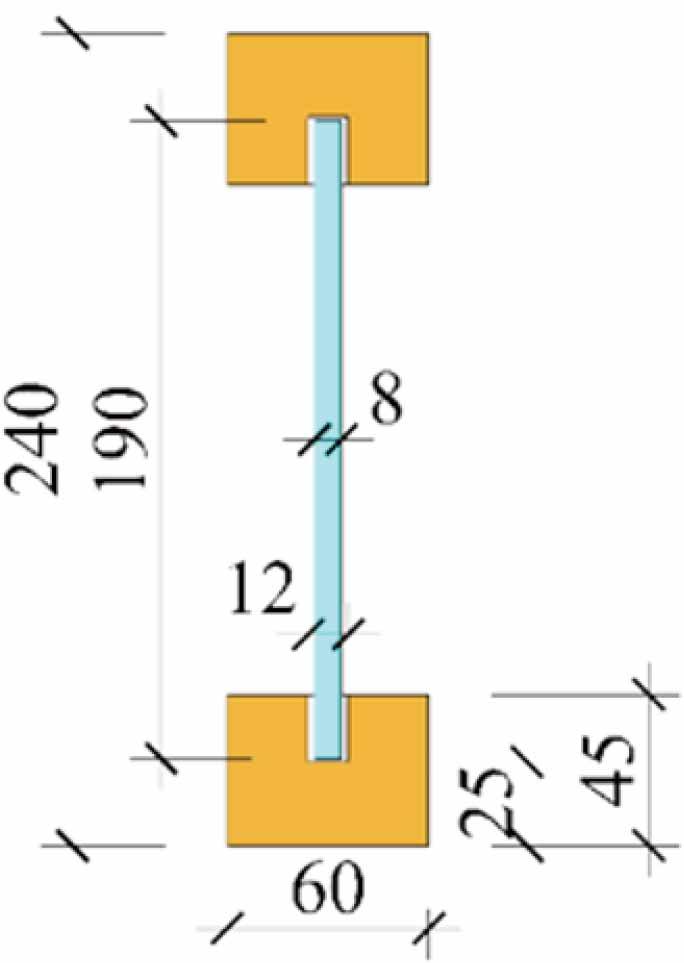
Cross-section of timber-glass composite beams: type TGCB1
Overview of TGCB1, manufactured beam type TGCB1, n is the number of specimens produced
| Beam type | Adhesive | Glass type | Length [mm] | Total height [mm] | Glass pane size [mm2] | Glass thickness [mm] | Timber block size [mm2] | Groove size [mm] |
|---|---|---|---|---|---|---|---|---|
| TGCB1 | Epoxy (n=6) | Annealed float | 4800 | 240 | 4800×190 | 8 | 45×60 | 12×20 |
| Epoxy (n=2) Acrylate (n=2) Silicone (n=2) | Heat-strengthened |
All beams were tested in four-point bending in a custom-made steel frame; see Fig. 3. The loading was displacement-controlled at a rate of 9 mm/min. During all tests, the applied force and vertical displacement were recorded. All beams were tested at an average temperature of 24°C and a relative humidity of 60%.

Four-point bending set-up
Current research is similar to tests performed before at Linnaeus University before [13, 14]. The beams, denoted here as TGCB2, were different in length, and laminated veneer lumber (LVL) was used for the wooden flanges, see Table 2. All beams were 3500 mm in length and 240 mm deep. For some of the beams, the glass had roughly polished edges; for other beams, no special treatment of the glass edges was used. The adhesives used in beam manufacturing were Sikafast 5221 (acrylate) and Sikasil SG-500 (silicone). Two slightly different designs of the flange-to-web joint (13 and 15 mm).
Fig. 4 and Fig. 5 provide the load-displacement diagrams for beams type TGCB1 and TGCB2, respectively, obtained from the four-point bending tests. Both types of beam with the web made of annealed float glass show a multi-stage mechanism of failure during loading. In the first stage, the relationship between the load and vertical mid-span displacement is almost perfectly linear until initial cracking. This is followed by a sudden drop in bending stiffness and an increase of vertical displacement. After the initial failure of the annealed float glass, subsequent cracks occur in the glass, originating from the tensile zone of the beam and propagating upwards. At this stage, the bottom flange acts as a crack bridge which together with a non-cracked compression zone of the web and top flange allows the beam to still carry the load. Despite the failure of the glass web, the beam can still carry load until the final collapse, which was caused by an explosion of the compression zone of the glass web and a failure of the flange working in tension. No significant differences in the initial stiffness of the beams TGCB1 and TGCB2 bonded with adhesives of different stiffness were observed. However, the beam bonded with silicone adhesive had a smaller number of cracks before the failure.
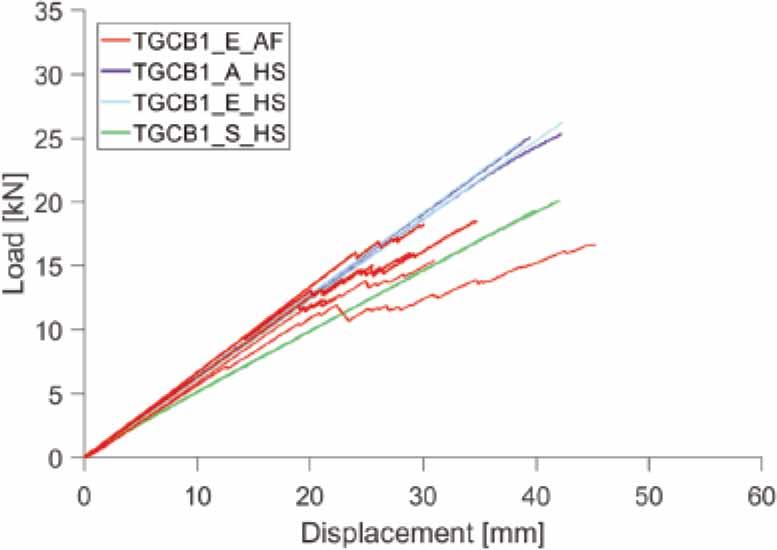

The beams with webs made of heat-strengthened glass (type TGCB1) had a higher load at initial cracking than the beams with webs made of annealed floating glass. However, the failure was brittle without warning. It is unclear whether the failure was caused by glass explosion with high residual stress or tensile failure of the timber flanges.
Table 6 summarises the main results obtained from the flexural tests on the timber-glass composite beams TGCB1 and TGCB2 in terms of load at first cracking of glass Fint, ultimate load Fult and initial bending stiffness (in elastic stage) Kint. The table also provides the value of post-breakage strength index PBSI which refers to an increased value of the load at final collapse of a beam Fult in relation to the load at which an initial crack in the glass web occurs Fint. In addition, it provides the value of post-cracking ductility index PCDI which is defined as a ratio between the displacement at the moment of the appearance of the first crack uint and the displacement at the final failure uult. Initial cracking in glass for both beam types occurred at approximately the same loading; however, beams TGCB2 showed a value of PBSI of 150% whereas in the case of beams TGCB1, the value was only 50%. It is not clear whether the difference was caused by the different (stronger) material used for the flanges or the influence of the less stiff bond line connection between the glass web and the timber flanges. The same observation was made with respect to PCDI, beams TGCB2 showed an average value of PCDI approximately four times higher in comparison to beams TGCB1.
The numerical analysis of engineering problems using FEM can be carried out in two possible approaches: implicit and explicit. The former is mainly used for static and quasi-static cases. The second, on the other hand, is used for dynamic problems but also in quasi-static analyses. This division is mainly due to the time required to obtain the final result. However, this does not mean that such an affiliation is invariable.
For the implicit method, the equilibrium equations of external and internal forces must be satisfied at each step of the solution of the task (Newton-Raphson method). The explicit method does not have to satisfy the equilibrium, which does not mean that its results are inaccurate. Any deviation from equilibrium can be minimised by reducing the incremental step size.
This is an element that distinguishes the two approaches. Implicit is stable because it uses iterations between increments to reach equilibrium, but this leads to increased computational time. Explicit takes into account the kinematic state from the previous increment without an iterative solution, an explicit offset.
With this in mind, an informed choice of solution method using FEM should be made. If one wants a reliable description of the stress state of the analysed area, then one should turn towards the implicit method. An analysis of the case of an abrupt change in loading of a structural element, taking into account non-linear material characteristics and contact elements between its parts, suggests the use of the explicit method. Of course, there are some issues that can be simulated using either approach with satisfactory results.
The numerical models are focused on simulating the flexural behaviour of the timber-glass composite beams tested in current and previous studies [13,14,27,28,26]. A simplified approach, including the implementation of cracks (FE cuts) in the tensile zone of the glass in places where the maximum stress reached 45 MPa, was presented in [13]. Although this approach was hand operated, the methodology presented in the paper is fully automatic and involves an advanced material model for brittle glass failure.
The section is divided into two parts. In the first part,a parametric study is carried out in order to investigate the influence of various parameters such as variation of tensile strength of glass, FE formulation, FE mesh size, and variation of adhesive stiffness on the results. On the basis of the findings from the parametric studies, the optimum model parameters were established and final numerical models were investigated. The second part aims to compare experimental and numerical results.
Numerical investigations were also divided into different paths. All analyses were carried out in the ABAQUS programme. At the beginning, the ABAQUS/Explicit solver was used which provides a brittle cracking model which is suitable for modelling of tensile cracking in brittle materials. In the method, the finite element equations are formulated as dynamic and thus can be solved directly, without iterations. In all the cases presented, the solution is determined by the constant size of the time increment t and depends on the length of the characteristic element and dilatational wave speed. In contrast to the explicit finite method, in the standard implicit approach, a solution for each increment involves iterations until a convergence criterion is satisfied.
Due to symmetries of the specimens, only ¼ beams were taken into account with appropriate boundary conditions simulating a four-point bending test; see Fig. 6 and Fig. 7. All calculations were run in displacement control including non-linear effects of large deformations. The displacement was increased to 100 mm using a smooth amplitude function. The value corresponds to 1/38 and 1/43 of the total span for the beams TGCB1 and TGCB3, respectively. The load introduction points and supports were modelled using rigid 50 mm long surfaces ensuring distribution of forces to a larger number of elements. All components were modelled using 3D solid elements with reduced integration and a large strain formulation. The main reason for using the 3D model is the need to model a reliable glass-wood bond through the adhesive elements. For flanges and bond connections 8-node linear brick elements (C3D8R) were used. For the web, two types of elements were used: 8-node linear brick elements (C3D8R) and 6-node linear triangular prism elements (C3D6). In all models, 5 mm and 2 mm element size was applied for the flanges and adhesive connection, respectively. The mesh size of the web varied between 16 and 2 mm.
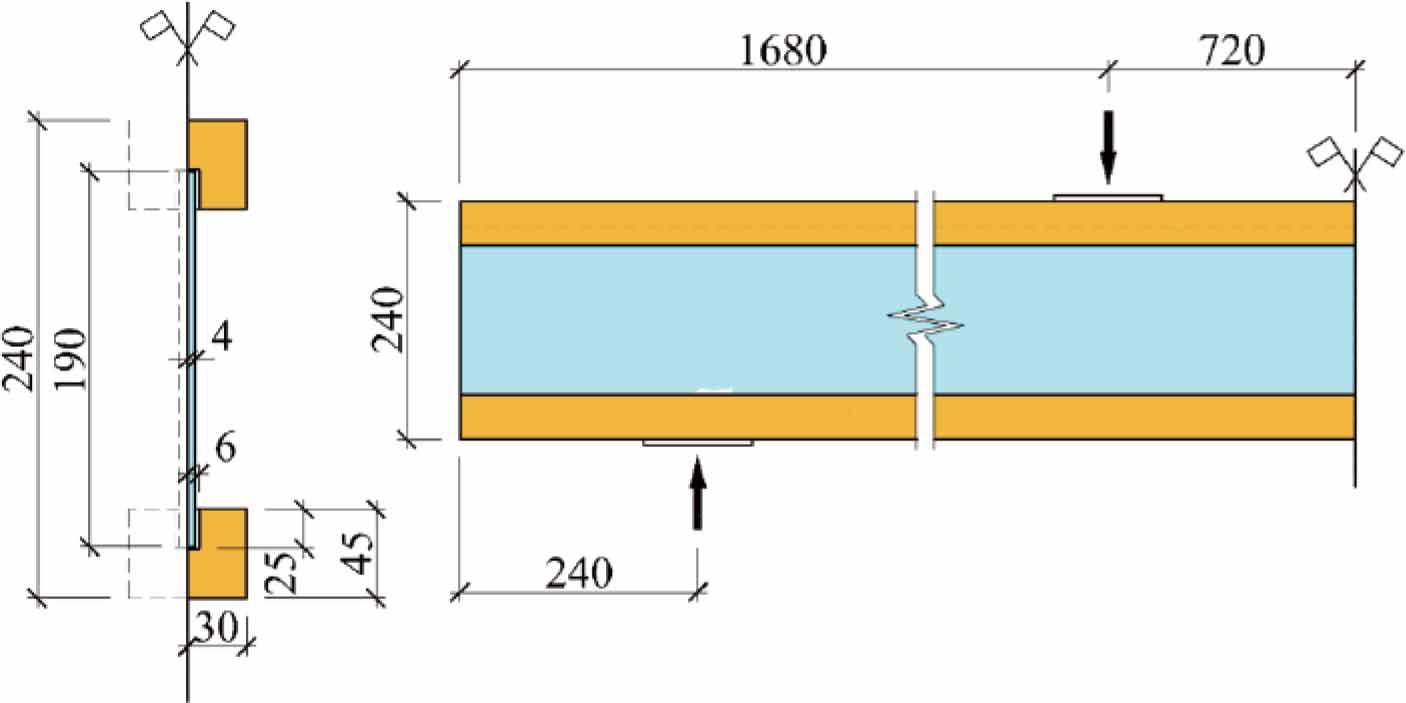
Cross-section, loading and boundary conditions for numerical model of beam type TGCB1
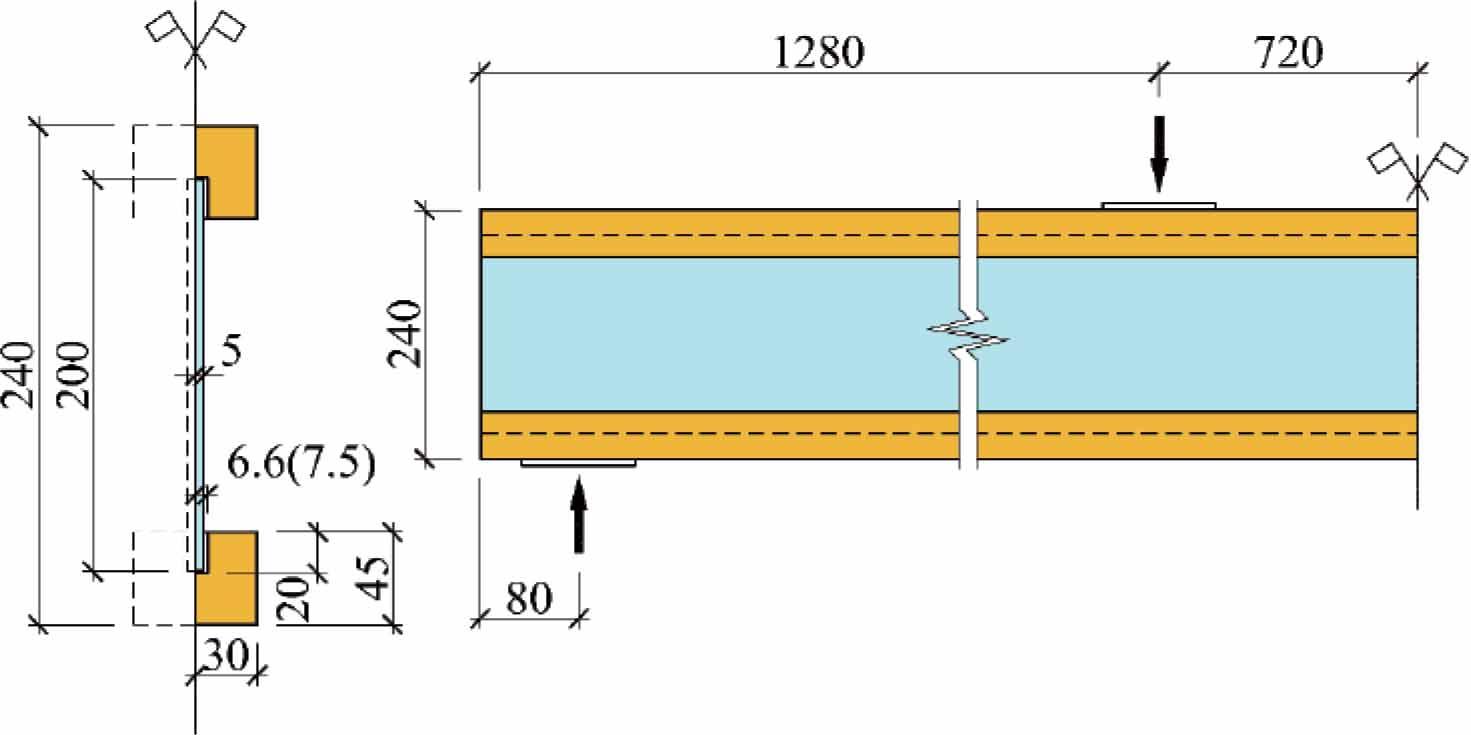
Cross-section, loading and boundary conditions for numerical model of beam type TGCB2
The mechanical characterisation of all materials was based on references from the past literature as well as nominal reference values available in the standards.
For annealed glass, according to the product standard [29], the nominal tensile strength ft,glass = 45 MPa was considered in the analyses. A homogeneous linear elastic, isotropic material was used with Eglass = 70 GPa and νglass = 0.23 for the modulus of elasticity and Poisson’s ratio, respectively. The values of ft,glass and Eglass are consistent with the results of an experimental study on monolithic glass beams tested in standing position, presented in [27]. A brittle cracking model [21] which provides capabilities for modelling the behaviour of brittle materials (e.g., ceramics, brittle rocks, concrete, glass, etc.) in which tensile cracking is dominant. The model assumes that the compressive behaviour is always linear elastic, and the model must be used with linear elastic material only. ABAQUS/Explicit uses a smeared crack model to represent the discontinuous brittle behaviour in the material. Constitutive calculations are performed independently at each material point in the finite element model. The existence of discontinuities (cracks) enters these computations in such a way that the cracks affect the strain and material stiffness associated with the material point.
A simple criterion is used to detect the initiation of the crack. A crack starts to form when the maximum principal tensile stress exceeds the tensile strength of the brittle material. Subsequent cracks may form in another material point independently. Once a crack occurs at a point, it remains throughout the rest of calculations. However, it may close and reopen along the normal direction of the crack surface. When the stress at a material point becomes compressive, the crack can close completely. In the brittle cracking model, the crack criterion makes use of Hillerborg’s fracture energy proposal [30]. Hillerborg defined the energy required to open a unit area of the crack in Mode I

Crack criterion in Mode I and post-failure stress-fracture energy curve
The definition of the characteristic length associated with a material point is required to implement the stress-displacement concept in a finite element model. The characteristic length is based on the element geometry; usually, it is a length of a line across the element.
Within the brittle cracking model, crack initiation is based on Mode I fracture only, while post-cracking behaviour includes Mode I and Mode II. Mode II shear behaviour is based on the observation that shear behaviour depends on the magnitude of crack opening, that is, the shear modulus decreases with crack opening. The ABAQUS/Explicit provides a shear retention model, in which post-cracked shear stiffness is formulated as a function of opening strain throughout the crack [21]. In the model, the relationship is formulated by expressing the post-cracking shear modulus Gcrack, as a fraction of the uncracked shear modulus:
Computations where elements can no longer carry stress may lead to excessive distortion of the elements and subsequent premature termination of the simulation. Therefore, the brittle failure criterion is provided within the brittle cracking model [21]. When the local direct cracking displacement components at a material point reach a defined value, the element is removed from the mesh; therefore, brittle failure criterion must be used with care. The main consequence is that the elements are removed from the mesh until the end of the calculations.
To perform a quasi-static analysis and avoid the influence of inertial forces on mechanical response using the ABAQUS/Explicit, which is a dynamic analysis solver, special care must be taken when setting the analysis step time period. Incorrect step time period of explicit analysis can result in unrealistic dynamic effects [31]. Kutt et al. [32] recommend that the ratio of step time period and natural period of the structure should be greater than one.
In addition, Chung et al. [33] suggest that dynamic effects in the model can be neglected and the quasistatic response can be ensured by keeping the ratio of kinetic energy to internal strain energy at <5% during the time period. In such a way the external work done by the load is balanced mostly by the internal energy of the whole structure, as in the case of a static analysis. In this approach, based on the principle of conservation of energy, the kinetic energy is an indicator of the quasi-static response. Limitation of the kinetic energy is usually archived by adjusting the step time period and controlling the plots of the kinetic and internal energy before any results are accepted. In the analyses, the optimum step time period was obtained after several trials.
The extended finite element method (XFEM) is a method available in the ABAQUS/Standard solver. The main problem with modelling and analysing an object with damages is continuous remeshing of the area around the propagating crack. XFEM allows to analyse discontinues in material easier and more accurate. Application of an additional discontinuous field allows modelling and propagation crack regardless of mesh. It is possible by adding additional degrees of freedom to already existing nodes, thus new crack tip and segments are appearing during propagation. In this way, no remeshing is required. This method was first applied by Belytschko and Black in 1999 [34]. However, modelling of the discontinuous field by enrichment of shape function is based on the partition of unity method, which was proposed by Melenk and Babuska in 1996 [35].
The displacement vector function with the partition of unity enrichment, used in the numerical analyses, is the following:
In the second type of numerical analysis, by using the extended finite element method in ABAQUS/Standard solver, the same material parameters for glass were used. For mechanical material properties damage for Traction Separation Laws with Maxps Damage was applied. It means that damage would initiate, when the maximal principal stress exceeds the given value (in the XFEM analysis taken as ft,glass = 45 MPa.
To determine material degradation after the evolution of damage initiation, the damage should be chosen. For those numerical analyses, the energy damage evolution was used. The value of fracture energy, which is required for failure after the initiation of damage, was assumed to be the same, as in the Explicit solver. The damage model, used in ABAQUS program, is presented in the Fig. 9. The area under the curve in the traction separation graph presents the fracture energy. In analyses using the standard method, a value of Gf = 3 J/m2 was assumed [27]. The damage response, when the crack appears to the moment of a completely failed state, is presented by a straight line because the linear softening was used in numerical analyses. In this model damage is defined by the scalar damage parameter D. When D equals zero, then there is no damage and with D equals 1, the failure is completed.

Traction-separation Law as damage definition
A Concrete Damage Plasticity (CDP) material model was adopted during the numerical analyses using the implicit approach. The concrete damage plasticity model was formulated by [36] and modified by [37]. A proposal to adapt the model for masonry structures was proposed by [38] and used by [39] in tasks of dynamic analysis of masonry structures. We can also find attempts to apply this model in describing the work of glass, for example in [40] or [41], however the last citied authors used the model in the ABAQUS/Explicit solver. They explained their choice by avoiding snap-back instabilities, especially for beams with a more brittle behaviour.
CDP combines two approaches, namely incremental plasticity theory with continual failure mechanics, and this characterises plastic failure mechanics. The model introduces the concept of effective stresses into the constitutive equations of plasticity theory. With this coupling, it is possible to take into account the effect of incremental material failure on the response of the model in successive load-unload cycles. When considering CDP in terms of plasticity theory, it should be noted that it is an extension of the classical Drucker-Prager model with a noncircular deviator section of the plasticity surface. Further features of this material model are the non-associative flow law and the nonlinear isotropic amplification of the two-mechanism type.
In terms of continual failure mechanics, CDP is characterised by bidispersive isotropic material degradation, described by two material degradation variables: dt and dc, in tension and compression respectively. These can reach values in the interval <0,1>, where 0 indicates no degradation and 1 indicates complete failure. The variables, determined from independent material failure functions, can be related to each other, i.e. one variable magnitude can affect the other after a change in the sign of the stress. The functions themselves are created from cyclic testing of the material, which requires obtaining a hysteresis loop.
Using the CDP model for glass, a maximum tensile stress value of ft = 45 MPa was assumed with a fracture energy of Gf = 3 J/m2 (in Abaqus’ Concrete Tension Stiffening, type GFI). The degradation results from the crack displacement described directly by Equation (2).
The material properties for the Pine wood and LVL are input assuming orthotropy however, the elastic modulus and Poisson’s ratios pertaining to the two axes normal to the grain direction are equalised, thus Et,l ≠ Et,r = Et,t and νt,lr ≠ νt,lt = νt,rt. The elastic properties of the individual materials involved in the analyses are summarised in Table 3. The strength of Pine wood was determined in previous studies [27], while the strength of LVL has been taken from the literature [42].
For adhesives, according to an earlier experimental material characterization [27], an isotropic material with elastic characterization curve was used. Table 4 summarises the mechanical properties of the adhesives involved in the numerical studies.
Material properties used in numerical models for adhesives [27]
| Adhesive | ρ [kN/m3] | E [MPa] | ν [-] |
| Silicone | 5 | 3 | 0.49 |
| Acrylate | 5 | 100 | 0.40 |
| Epoxy | 5 | 1 595 | 0.46 |
This section focusses on a simple analytical tool to investigate the structural response of hybrid timberglass beams in terms of initial stiffness and stresses in the components. When considering a composite beam, in which materials with different stiffness are combined, a key element is the shear stiffness of the connecting media. It has a significant influence on the overall stiffness and strain distribution through the cross-section and therefore on the load-bearing capacity of the composite beam. In terms of different flexibility of joints, an upper and lower extremes can be distinguished: (i) a lower bound, the stiffness of the connecting media is negligible and the components act separately (non-composite action), (ii) an upper bound - the stiffness of the connecting media is infinite (rigid connection) and the components act together (full composite action). Regarding loaded timber-glass composite beams, a slip between the components always occurs and thus a partial composite action has to be considered. The following section presents a simplified method to determine the effective bending stiffness and the load at first cracking in glass of an I-shaped timber-glass composite beam with elastic connections between components.
An analytical model of an I-shaped timber-glass composite beam presented in Fig. 10 composed of two flanges and a web, combined with adhesive bond connections, is considered. Although the notation system relates to an asymmetric cross-section, in the following considerations, a symmetrical cross-section is assumed.
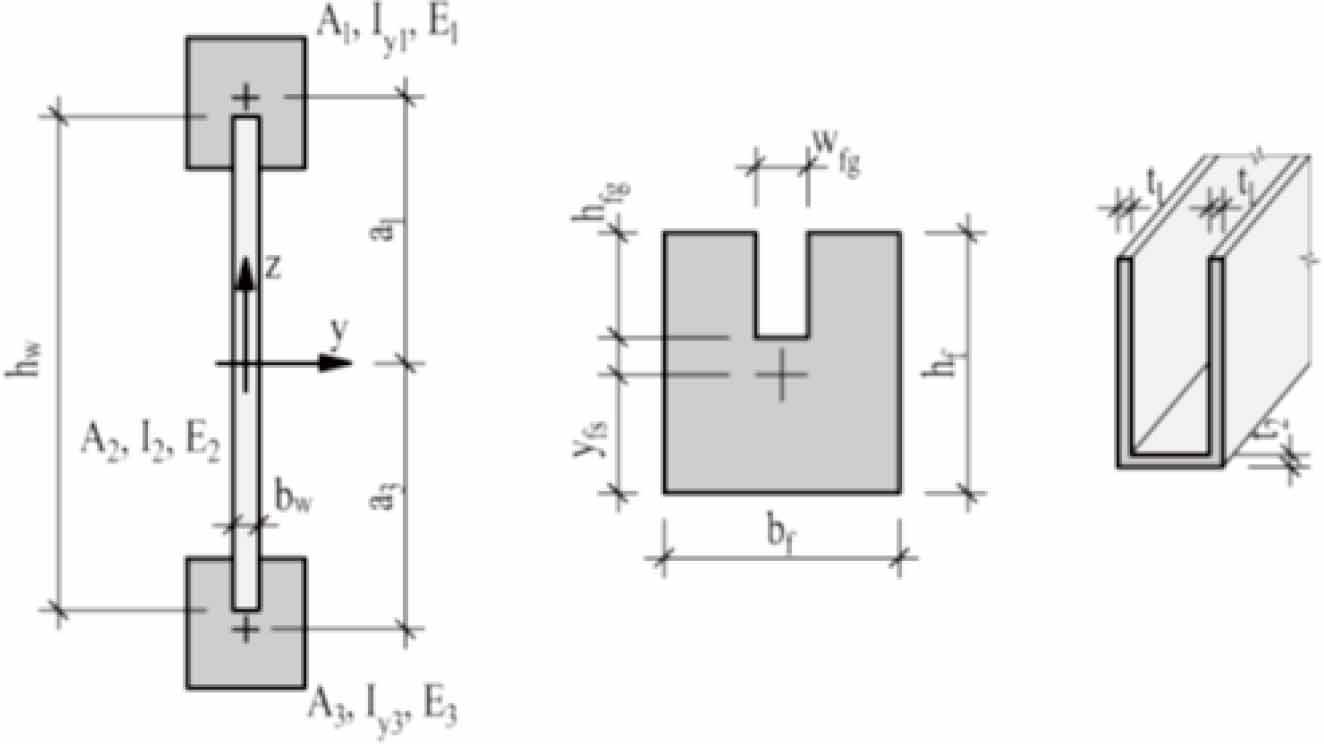
Notation system for the cross-section (left), timber flange (center) and bond connection (right).
In case of a very stiff connection between the web and flanges, there is no slip between components under loading. Therefore, the beam presents fully composite action and to determine the moment of inertia of the cross-section the parallel axis theorem can be used. Another case relates to a situation where there is no connection between the web and the flanges or the stiffness of the connection is negligible. The connection cannot take any shear stress and the components act separately. The moment of a inertia in the case of non-composite action comes down to a sum of the properties of the components.
The structural behaviour of timber-glass composite beams combined with adhesive bond connections cannot be classified in any situations presented before. To determine the effective stiffness of such a component, a partial composite action must be considered. The approach with a gamma-factor used in timber engineering; see PN-EN 1995-1-1 [43] was applied in the work. The gamma-factor reduces the second component of the parallel axis theorem contribution of bending stiffness, depending on the stiffness of the connecting media:
The connection efficiency factor was introduced by Möhler in 1956 [44]. A derivation of the gamma-factor can be found in [45]. It is expressed as:
The factor γ depends on the properties of the flanges E and A1, the length of the beam L, and the stiffness of the connections Kk. According to [43] the gamma-method applies to composite beams with mechanical connections. Based on dimensions of the bond line connection presented in Fig. 10 a formula to determine Kk is proposed:
The general formula to determine the effective bending stiffness of a composite beam for the cross-section built with several components with different stiffness can be expressed:
The following formulas are used to determine the stress in the components:
Flange (centroid)
Flange (outer edge)
Web (edge)
This section presents results of the parametric studies and the results from numerical models compared to the experiments. A basic division relating to the numerical analyses associated with the Implicit (Standard) and Explicit methods was adopted. This approach is intended to show the different response of the numerical model, and thus adopt one of them for further parametric analysis.
Numerical models were created to reflect the geometry of the laboratory test of the TGCB1 type bent beam. In it, the adhesive material that connects the timber to the glass, namely Silicone (S), Acrylate (A), Epoxy (E) as modified. The effectiveness of the Implicit method was carried out by comparing the numerical solution with laboratory tests. Therefore, a fixed fini element side size of 5 mm was assumed and the material model used for the glass web was modified: elastic, XFEM, CDP.
Solving numerical tasks using the Implicit method does not entail satisfying the equilibrium equations at each load increment point. Unfortunately, this can lead to local instability, especially when using nonlinear material work with consideration of possible degradation. The effect of this is to reduce the load increment to a limit value at which the calculation procedure is terminated. Often, without reaching the assumed value of the specified displacement.
Let us consider two different approaches to the occurrence of a crack in the glass sheet of a hybrid beam: geometric (XFEM) and discrete (CDP). For this purpose, a common numerical model was built with a regular finite element mesh with the elements of the timber chords and the glass web connected by glue (three versions S, A, E). To validate the model, a linear-elastic working range of each material was introduced each time, which corresponds to the actual parameters of the TGCB1 hybrid beam under test. The XFEM and CDP methods lead to different characteristics with respect to the laboratory test response. This is due to the way the equations are solved, in which the possible change (reduction) in section stiffness resulting from geometric damage (green scratch map on Fig. 11–13) or discrete damage (areas of red elements in the blue map on Fig. 11–13). The appearance and growth of the glass degradation area in the numerical model do not occur abruptly, but depend on the load increment. This distinguishes the numerical results from the laboratory results.

Plot of the change in load-displacement of the TGCB1 beam (silicone adhesive) as a function of the glass web material model used, together with locations of probable damage from Implicit analysis
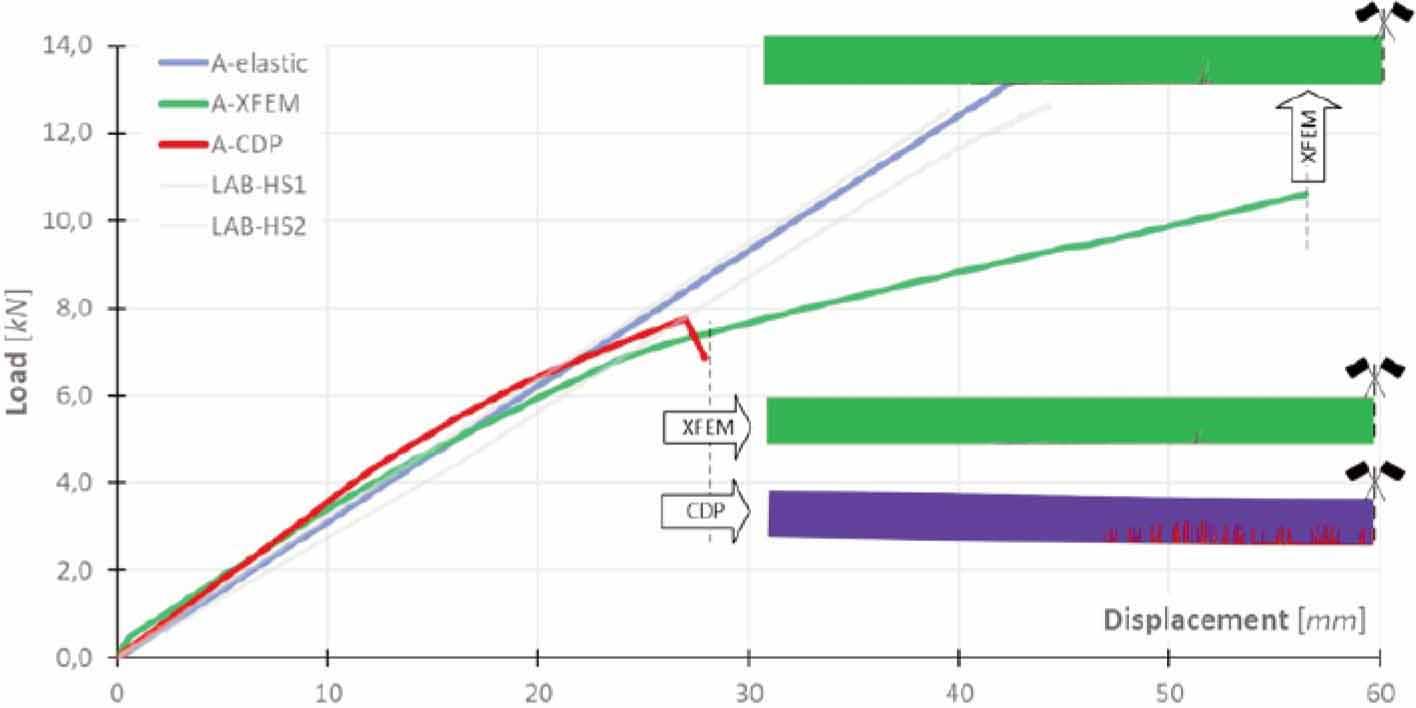
Plot of the change in load-displacement of the TGCB1 beam (acrylate adhesive) as a function of the glass web material model used, together with locations of probable damage from Implicit analysis

Plot of the change in load-displacement of the TGCB1 beam (epoxy adhesive) as a function of the glass web material model used, together with locations of probable damage from Implicit analysis
This trend was obtained in the load-displacement (L-D) waveform of the TGCB1 beam model with silicone adhesive, as illustrated in Fig.11. The linearelastic glass model fits the waveforms determined from the laboratory test shown in Fig. 4. Changing the glass material model to the CDP approach results in a non-linear L-D waveform resulting from the decreasing stiffness of the beam cross-section. Note at this point that the glass degradation map is distributed fairly evenly (red) without a single characteristic crack that can be distinguished in the XFEM model solution. At a displacement of 30 mm, the CDP model terminated the calculation as a result of the lack of convergence of the solution at this point; a comparison of the degradation image of the two models analysed was made. A local failure of the XFEM model can be observed. The load value at this point is lower than the laboratory values, and the LD course is continuous despite the occurrence of cracks, which is due to the adopted calculation standard method. The use of the XFEM model allowed the application of a load corresponding to that obtained in the laboratory test, but the displacement response is much higher, although the damage pattern is similar to the real one.
Changing the adhesive of the timber-glass joint to acrylate did not qualitatively change the response of the numerical models in the standard solution method (compare with Fig. 12). However, a change related to the course of the L-D relationship is perceptible, namely that, over a longer distance, the numerical runs coincide with the laboratory ones. Before reaching the displacement value of 30 mm, the CDP model stopped the calculation process after a clear decrease in the force value. However, this is not a discontinuous characteristic, which is noticeable in the damage image. The potential scratch area covers a significant part of the lower surface of the glass web. At this level of displacement, the XFEM model is characterised by local damage, which leads to a change in the slope of the L-D run. The further increase in the load led to the propagation of the already existing scratch. At this stage, it can be concluded that increasing the stiffness of the adhesive material results in a more complete integration of the hybrid timber-glass beam.
A third method of adhesive connecting the timber flange and the glass web in the form of epoxy was also analysed, which has the highest Young’s modulus value of the fasteners used. In this case, no change in the slope of the L-D relationship was observed during loading and only the appearance of scratches in the CDP and XFEM models, together with the subsequent discontinuation of the calculations due to the lack of convergence of the solution within the Implicit method. The force and displacement values of both numerical models correspond to those obtained under laboratory conditions. However, the failure does not change compared to the previously used adhesive cases (compare S for Fig. 11 and A for Fig. 12).
The observed load-displacement relationship does not fully capture the nature of the operation of a hybrid beam subjected to bending. This is due to the existence of independent timber and glass elements, which are joined by an adhesive layer. To understand the nature of this work, a different form of presentation of the results was adopted.
The results of the numerical analyses (CDP and XFEM) carried out as Implicit method and the laboratory results of the bending tests of the TGCB1 beams presented in Figs.11–13 were taken as a starting point. According to Equation (12), the value of the flexural stiffness [MNm2] resulting from the applied load and the corresponding displacement was calculated in each case. To make a qualitative comparison, the principle of determining the displacement value as a percentage was adopted. This means that each solution obtained is presented in relation to the maximum displacement value of the analysis. This approach allows us to compare the results of analyses that have been discontinued as a result of the numerical solution not converging.
M – bending moment
L – axial span
f – vertical displacement
Finally, graphs were obtained in which the change in stiffnes value was determined in relation to the percentage displacement of a given solution. Laboratory results were further averaged to produce a single relationship. Therefore, the waveforms presented should be treated qualitatively rather than quantitatively.
It is clear that the flexural stiffness of the beam changes during loading, but regardless of the material of the timber-glass combination in the hybrid beam, it can be seen (Fig.14–16) that the numerical (XFEM and CDP) and laboratory (dashed line) results are different. The latter represents the averaged value (Avg) of the case results. The adoption of silicone adhesive as highlighted an initial sharp (1 MNm2) decrease in the averaged stiffness of the beam in the initial interval (up to about 2%) of the beam displacement (Fig.14). Subsequently, an increase in the stiffness value and its stabilisation from 30% of the failure displacement can be observed. The numerical solutions, where the stiffness value is nonincreasing, show a different character. Initially, up to about 20% of the maximum displacement, the flexural stiffness values are higher than the laboratory average (range 0.8-1.0 MNm2). Thereafter, they show a non-linear decrease in stiffness values, with the numerical solutions reaching about 50% of the laboratory stiffness during maximum displacement.

Plot of change in stiffness of TGCB1 beam to percentage of displacement using Silicone as adhesive
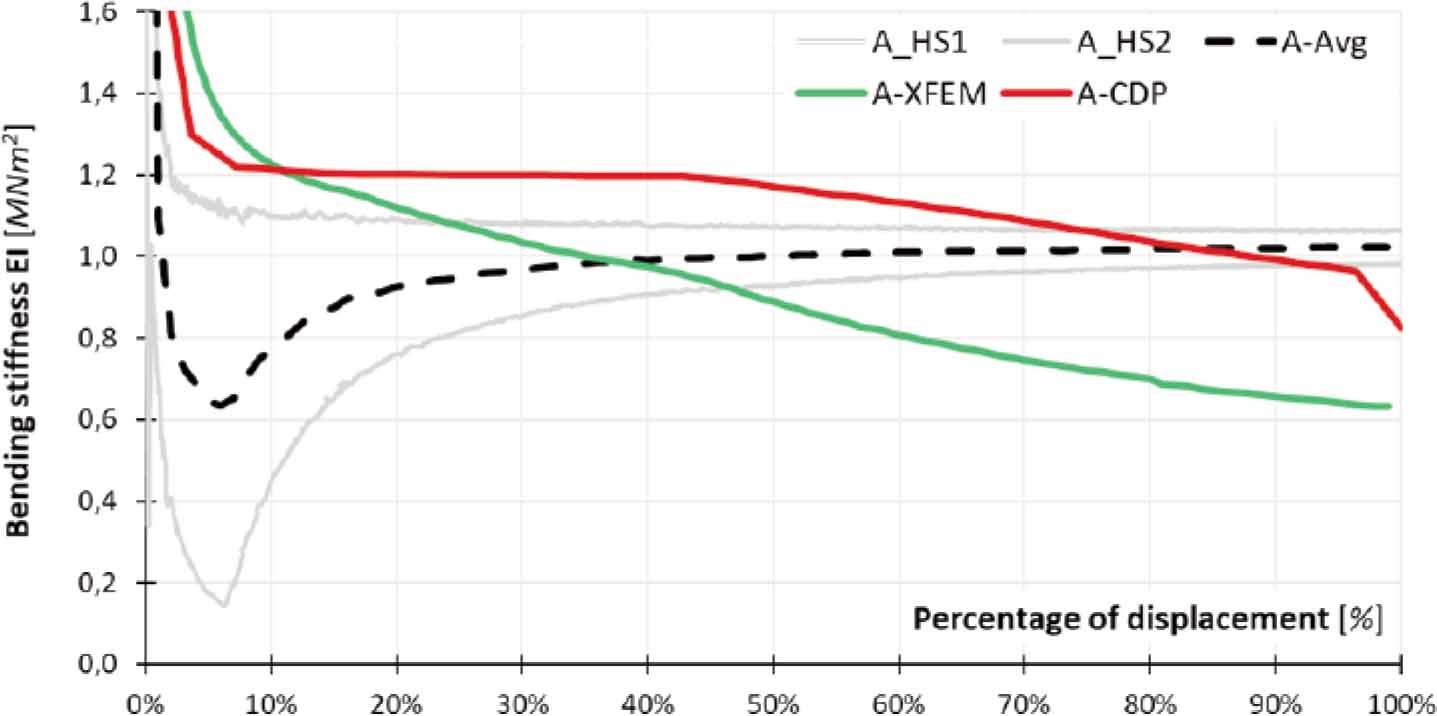
Plot of change in stiffness of TGCB1 beam to percentage of displacement when using Acrylate as adhesive
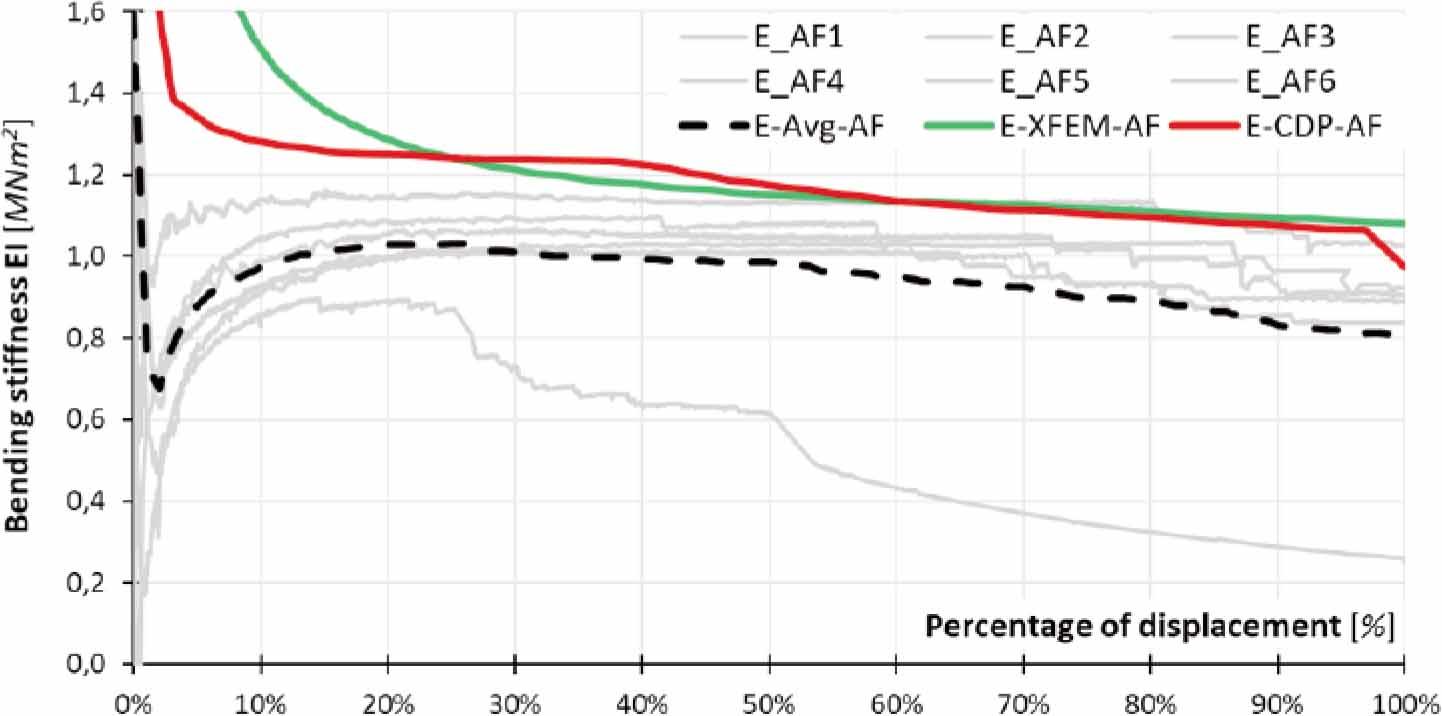
Plot of change in stiffness of TGCB1 beam to percentage of displacement when using Epoxy as adhesive
A similar effect of an initial decrease in the average flexural stiffness value is observed with the use of acrylic as an adhesive in the laboratory hybrid beam up to approximately 5% of the failure displacement (Fig. 15). Furthermore, an increase in the stiffness value and its stabilisation (at 1 MNm2) can be observed from 40% of the displacement. The numerical solutions of this model present stiffness values that initially decrease rapidly, but there is no local increase. The results of the analysis with the glass model described by the CDP show a stabilisation of the stiffness value in the range 10-50% of the maximum displacement, which remains constantly higher than the average laboratory value. The application of XFEM modelling to the glass did not result in the aforementioned stabilisation but a steady decrease, which can be interpreted as a steadily progressing propagation of the geometric crack in the glass web model. With a value of approximately 20% of the maximum displacement, the flexural stiffness obtained from this model reaches values less than the laboratory average. Finally (at maximum displacement), the stiffness values obtained from the numerical solutions are 20-40% lower than the laboratory mean stiffness value.
The third modification was the use of epoxy as an adhesive in the TGCB1 beam. Again, an initial decrease in the average flexural stiffness value is observed to be approximately 5% of the failure displacement (Fig.16). Furthermore, an increase in the stiffness value at 1 MNm2 (20% of the failure displacement) and a gradual decrease to a final value of 0.8 MNm2 can be observed. At this stage, the difference in the progressive failure characteristics of HS and AF glass sheets can be seen. The first type (HS) is characterised by rapid destruction when maximum displacements are reached. On the other hand, it is characterised by a progressive accumulation of damage to the glass from 20% of the destructive displacement, which is illustrated by a decrease in the average flexural stiffness value of the hybrid beam. The numerical solutions show satisfactory convergence with the laboratory solution above 20% of the maximum displacement. The results of the analysis with the glass model described by CDP and XFEM are approximately 20% higher in this range and at no point is the stiffness value lower than the laboratory average. It can be assumed that the laboratory and numerical solutions follow a parallel course in terms of stiffness to that described above for the Implicit numerical model.
Regardless of the adhesive material used, a trend toward an initial sharp decrease in the stiffness value of the hybrid laboratory beam and a subsequent increase can be observed. This is to be explained by the effect of the individual elements of the timber flanges and the glass web that assemble. At this time, any imperfections in the actual beam resulting from the assembly process are compensated for. After this process (approximately 20% of the failure load), the average flexural stiffness of the beam reaches a peak value. Such a course is difficult to find in numerical models, irrespective of the material model used. The stiffness value takes on nonincreasing values. This means that the numerical model is already idealised at the development stage - the individual nodes of the finite element mesh are preadjusted to each other, i.e. with increasing load, depending on the material model used, we will observe a decrease in the value of beam stiffness resulting from damage generation and propagation.
An additional problem in simulating the failure mechanism is its increment when calculated using the Implicit method. As could be seen from the earlier diagrams, the scratching of the glass sheet is rapid, which cannot be reproduced with either the CDP model or the XFEM approach. The application of the concrete damage plasticity model to glass is also questionable due to the characteristics and design of the model itself. The presented solution is only related to a monotonic loading process, and the parameters used cannot be taken into account in a cyclic loading process for which the CDP model is predestined. The degradation functions independently for compression and tension are created in a cyclic loading and unloading process with measurement of the change in Young's modulus. Such tests are not feasible over a wide range as a result of the brittleness of the glass. Another limitation is the allowable tensile to compressive stress ratio (Kc) of 0.5-1.0. In the case of glass, this ratio is less than that required by the CDP model. A numerical model built on the basis of XFEM, where the geometric crack formation results from the fracture energy of the glass, is a more reliable approach, but lacks the ability to take into account the violent nature of the actual fracture, which is due to the Standard method.
An overview of parametric models discussed in this work is summarized in Table 5. Parametric studies were performed with the beam type TGCB1. First, the structural effects of tensile strength of glass fg,t (within the limit ±10%) have been investigated. Secondly, parametric studies have been focused on the variation of FE size, including elements with the size of 16, 8, 4 and 2 mm. Furthermore, the geometry of the FE was varied between rectangular and prism with triangular base elements because of the sensitivity of the smeared crack model to the shape of the element. Finally, the structural effects of the Ea stiffness of the adhesive used for boding the glass pane to the timber block have been investigated. Ea was set equal to 1, 10 and 1000 MPa to cover all ranges of adhesive stiffness.
Mechanical and geometrical properties of parametric models. Notation: R = Rectangular, P = Prism
| Variation | FE/model | ft [MPa] | FE size [mm] | FE geometry [-] | Eint [MPa] |
|---|---|---|---|---|---|
| Reference | M-REF | 45.0 | 8 | P | 100 |
| Variation of tensile strength of glass | M-FT-40.5 | 40.5 | 8 | P | 100 |
| M-FT-49.5 | 49.5 | 8 | P | 100 | |
| Variation of FE size | M-FE-R | 45 | 8 | R | 100 |
| Variation of FE geometry | M-FE-16 | 45 | 16 | P | 100 |
| M-FE-4 | 45 | 4 | P | 100 | |
| M-FE-2 | 45 | 2 | P | 100 | |
| Variation of adhesive stiffness | M-AE-10 | 45 | 8 | P | 10 |
| M-AE-1000 | 45 | 8 | P | 1000 |
The fracture energy of glass Gf vary between 3 and 8 J/m2 in the literature [4, 46]. However, it was concluded in the previous exploratory studies by Bedon [40] that the structural response of glass beams with varying glass fracture energy within these values is insignificant. Therefore, the value of Gf = 3 J/m2 was established in the analyses. For clarity, a constant Poisson ratio (ν= 0.46) for adhesive with varying Ea was assumed. All remaining geometrical and material parameters as for beam type TGCB1.
The main objective of the parameter studies was to investigate effects of variation of model parameters to the structural response of glass web, therefore no additional damage models were assigned to timber and adhesives.
Fig. 17a presents a full load-displacement plot of the structural response of the reference model M-REF, which represents the behaviour of all parametric models. The response shown in Fig. 17a can be characterised by three particular phases: (i) the elastic stage (A) and (ii) the cracked stage (B) followed by collapse (C). In phase (A) the reference model presents perfect linear-elastic behaviour. When the stress in the glass exceeds the value of fg,t, first cracking occurs in the glass web. Cracks originate from the tensile beam zone and propagate upward (see Fig. 17b). A clear drop in load can be noticed (A1). At this stage, the bottom flange acts as a crack bridge which together with a non-cracked compression zone of the web and top flange allows the beam to still carry the load. Point (A1) begins phase (B) during which the existing cracks develop and new cracks form in other parts of the glass web (B1). These cracks are usually located between the load introduction points. At approximately halfway through the phase (B), a sudden drop of load can be noticed (B2), which is caused by the appearance of multiple cracks formed in the tensile zone towards the supports (B2). After this, the load increases again, however, it reaches only approximately a half of the value at the point (B2) before the collapse (C); see Fig. 17e.
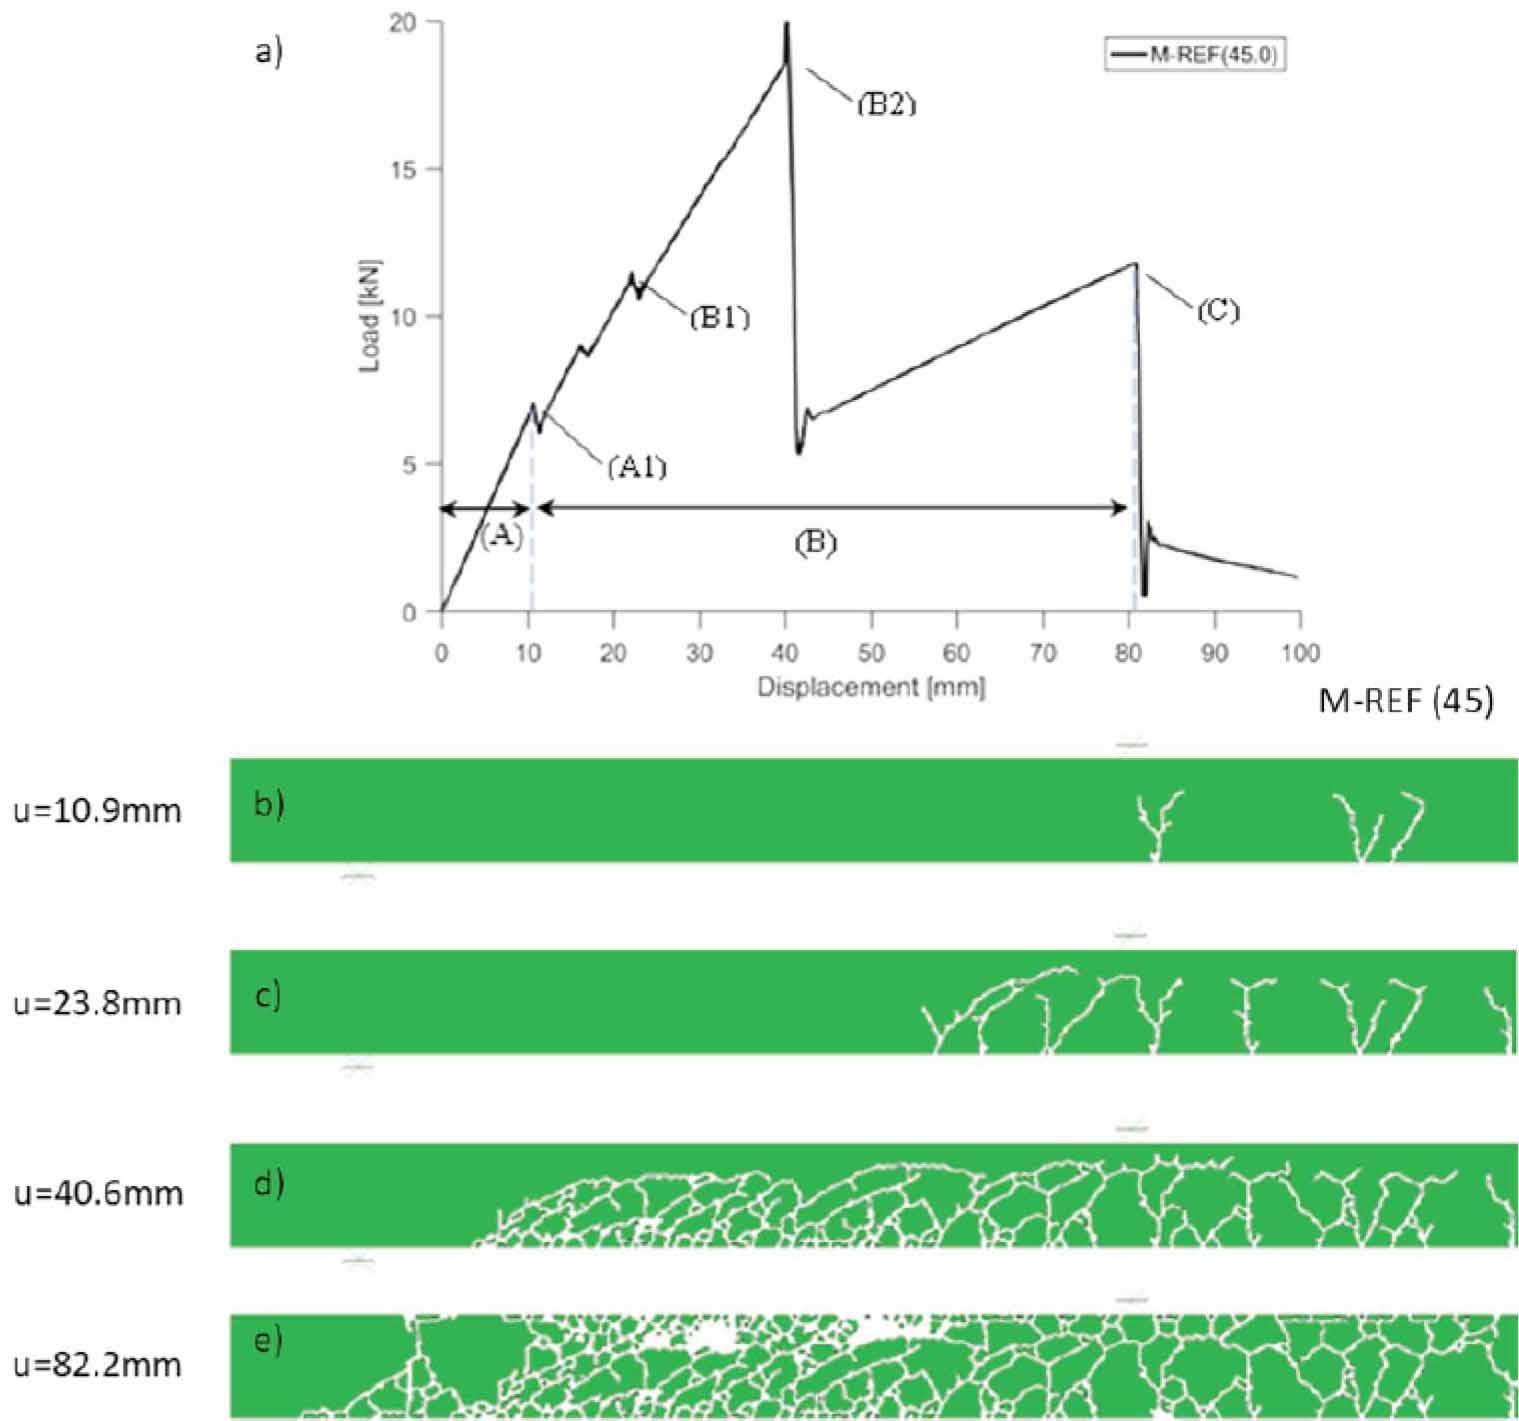
Progressive failure of reference model. Load-displacement plot (a), comparison of crack patterns in glass web at different failure stages and displacements (b-d). Note symmetry of model at right vertical edge
A comparison of the results obtained from models M-REF, M-FT-40.5 and M-FT-49.5 with different alues of the tensile strengths of glass ft (±10%) is shown in Fig. 18. In terms of the load-displacement plots, the variation of ft clearly affects the value of the load at first cracking Fini and ultimate deflection, see Fig. 18a. An increase of ft causes an increase of Fini and also allows for greater deformation before the collapse. However, no dependence was found between the variation of ft and the ultimate Fult load. Regarding the cracking pattern, a decrease of ft results in larger number of cracks at the same displacement, see Fig. 18b–d.
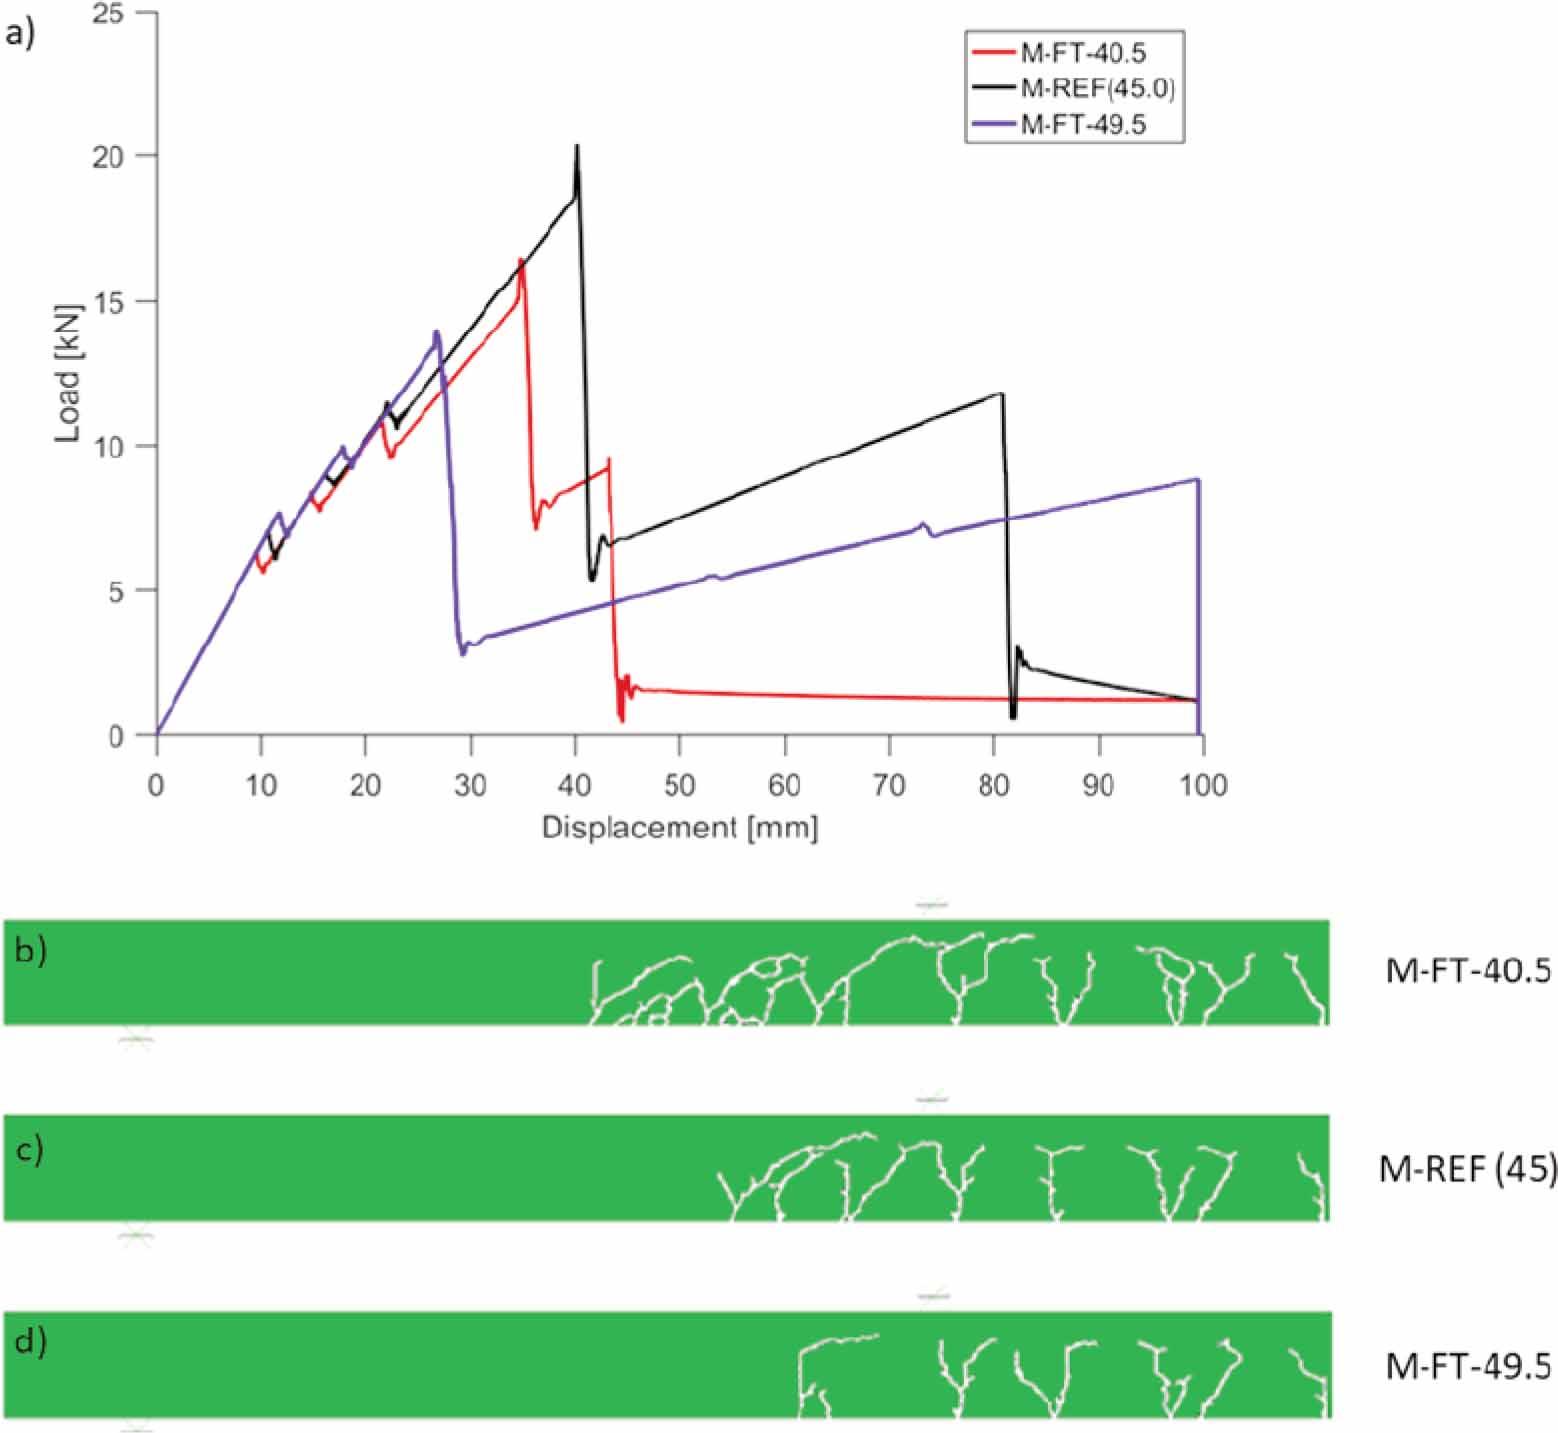
Effects of tensile strength of glass. Comparison of load-displacement plots (a), comparison of crack patterns in glass web at displacement of ≈ 23.8 mm (b-d). Note symmetry of numerical model at right vertical edge
Fig. 19 compares the numerical results obtained from the M-REF and M-FE-R in terms of different FE geometry. In terms of load-displacement plots models with brick (rectangular) elements show a relatively limited number of cracks, while models with prism elements demonstrate more extensive cracking; see Fig. 19(b, c). Moreover, the models with prism elements show the presence of diagonal cracks.
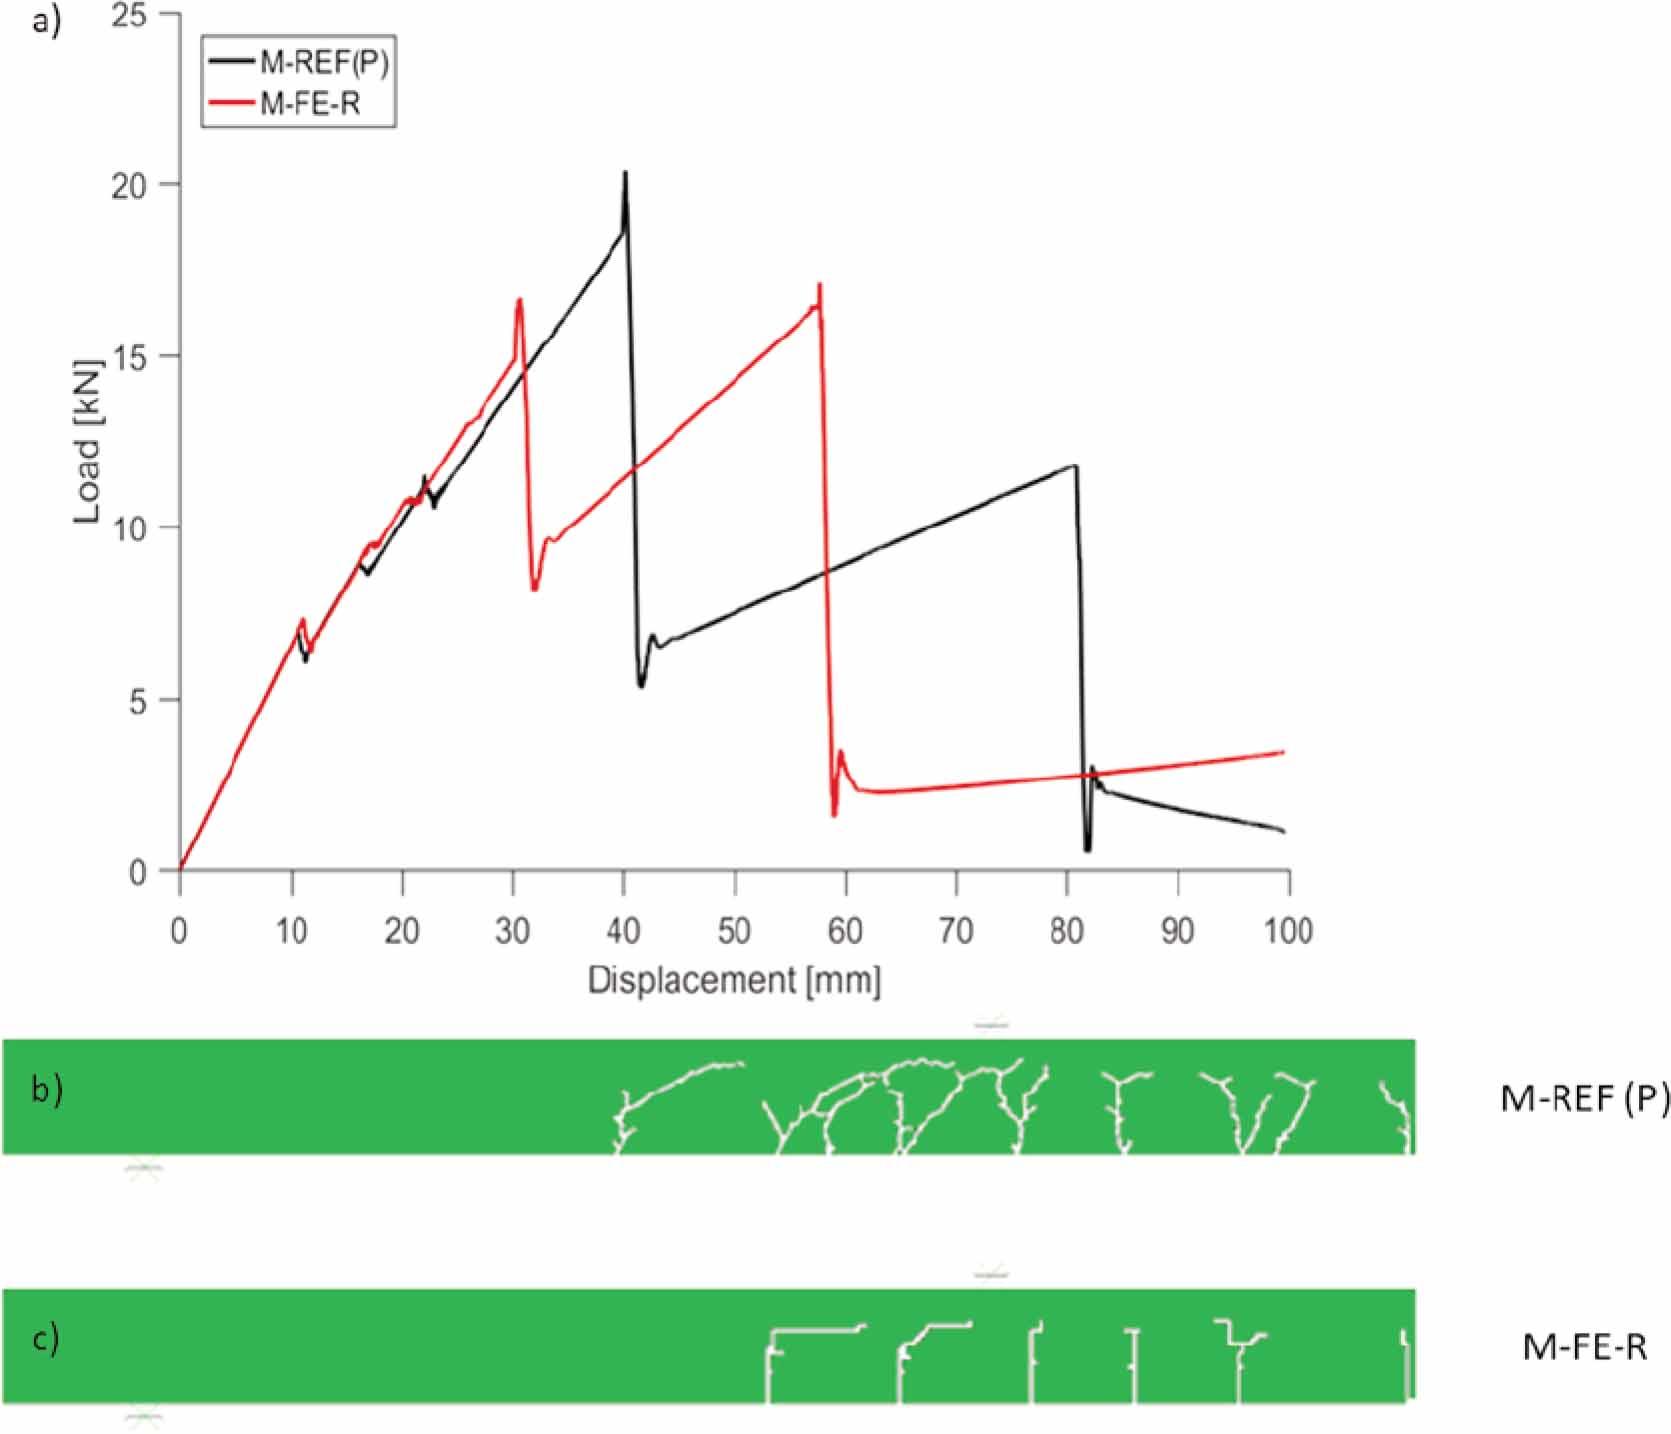
Effects of FE geometry. Comparison of load-displacement plots (a), comparison of crack patterns in glass web at displacement of ≈ 23.8 mm (b, c). Note symmetry of numerical model at right vertical edge
A comparison of the results obtained from models M-REF, M-FE-16, M-FE-4 and M-FE-2 with different size of finite elements is shown in Fig. 20. Mesh refinement, regarding reduction of the size of elements, significantly alters the numerical results. Models with a coarse mesh (16 mm) show a relatively limited number of cracks when compared to the models with finer mesh (2 mm), see Fig. 20(b–e). It can be explained by the fact that the higher the number of FE the more cracks may originate in the model. Regarding load-displacement curves the structural behaviour of models is similar until the deformation of approximately 20 mm, when multiple cracks form at the tensile zone from the load introduction points towards the supports. This was described as point (B1) in Fig. 17a. Further behaviour is strictly dependent on the FE size. It was found that the models with finer mesh shows point (B1) earlier compared to the models with coarse mesh. Moreover, models with coarse mesh allow for grater deformation before collapse in comparison to the models with fine mesh. Regarding the cracking pattern, the models with fine mesh are shown in Fig. 20(b–e).
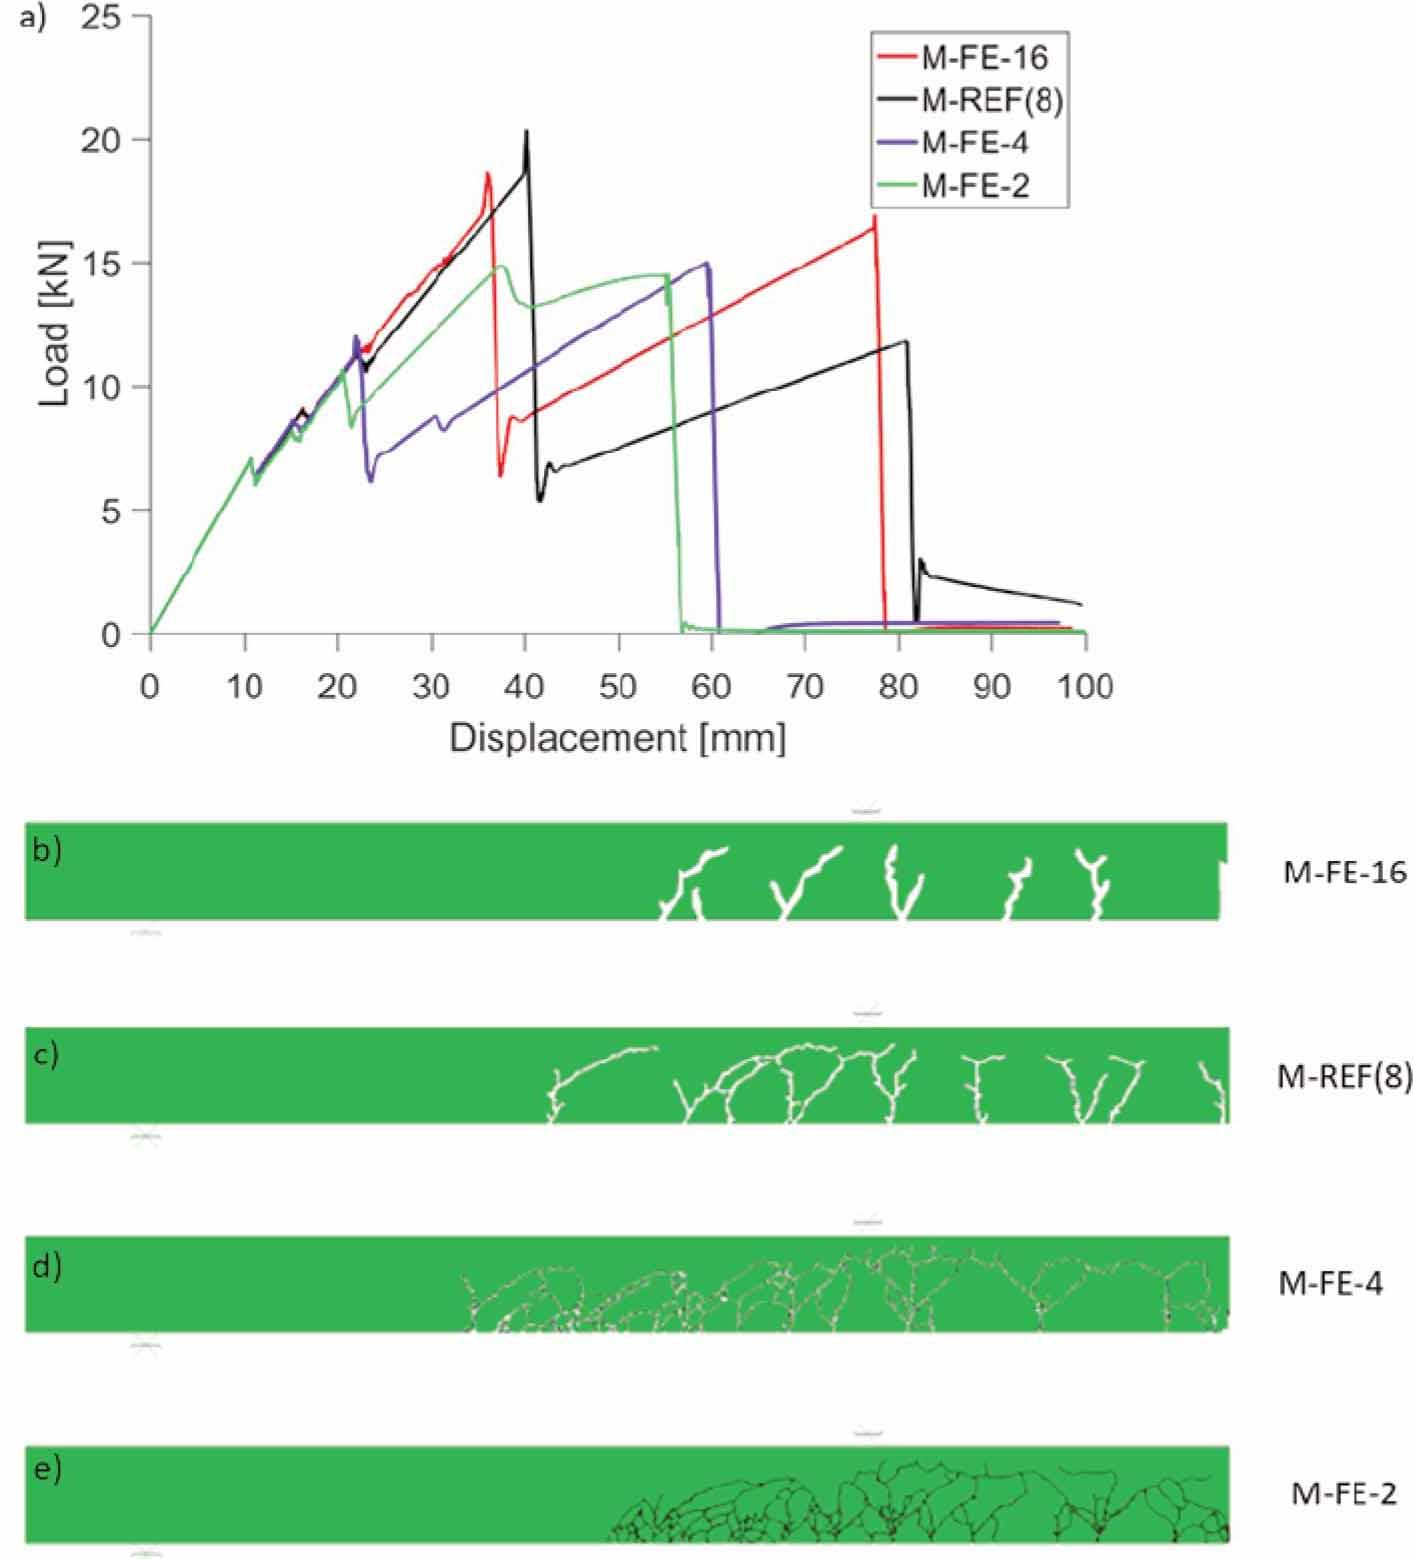
Effects of FE size. Comparison of load-displacement plots (a), comparison of crack patterns in glass web at displacement of ≈ 23.8 mm (b-e). Note symmetry of numerical model at right vertical edge
Fig. 21 compares the numerical results obtained from models M-REF, M-AE-10 and M-AE-1000 with varying stiffness of adhesive. In terms of load-displacement plots, an increase of modulus of elasticity of adhesive results in an increase of load at first cracking (caused by increased effective stiffness of the composite beam) and allows for larger deflections before collapse. In terms of crack pattern, an increase of modulus of elasticity of adhesive results in larger number of cracks. This change also affects the distance between cracks.
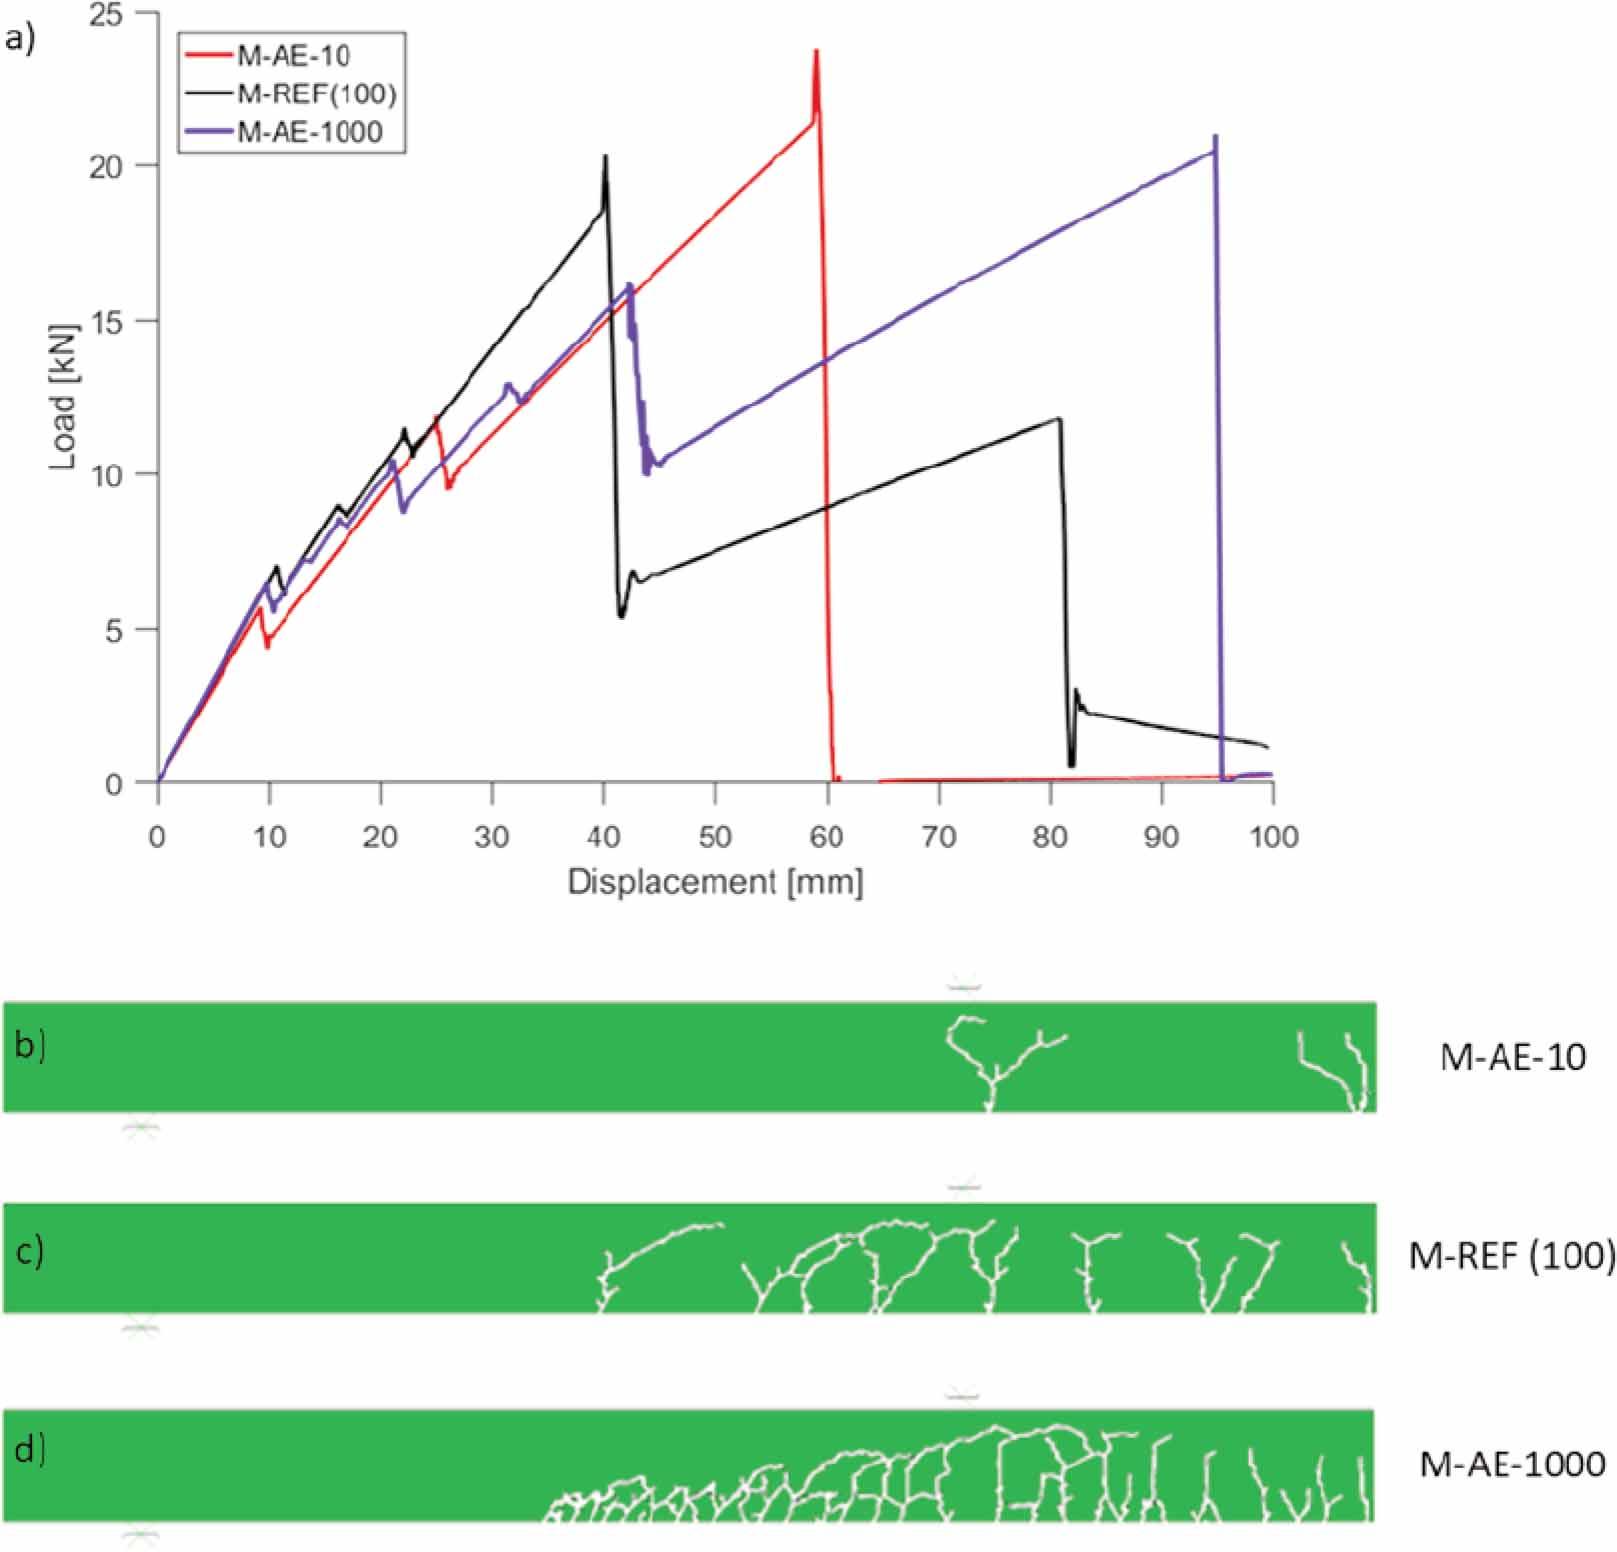
Effects of adhesive stiffness. Comparison of load-displacement plots (a), comparison of crack patterns in glass web at displacement of ≈ 23.8 mm (b-d). Note symmetry of numerical model at right vertical edge
This section presents a comparison between numerical and experimental results, see Fig. 22 and Fig. 23 and Table 6. In addition, it shows predicted values of initial stiffness and load level at first cracking in glass based on the analytical models presented before, see Table 6. Markers shown in Fig. 22 and Fig. 23 indicate collapse of the numerical model (failure of timber flange working in tension).
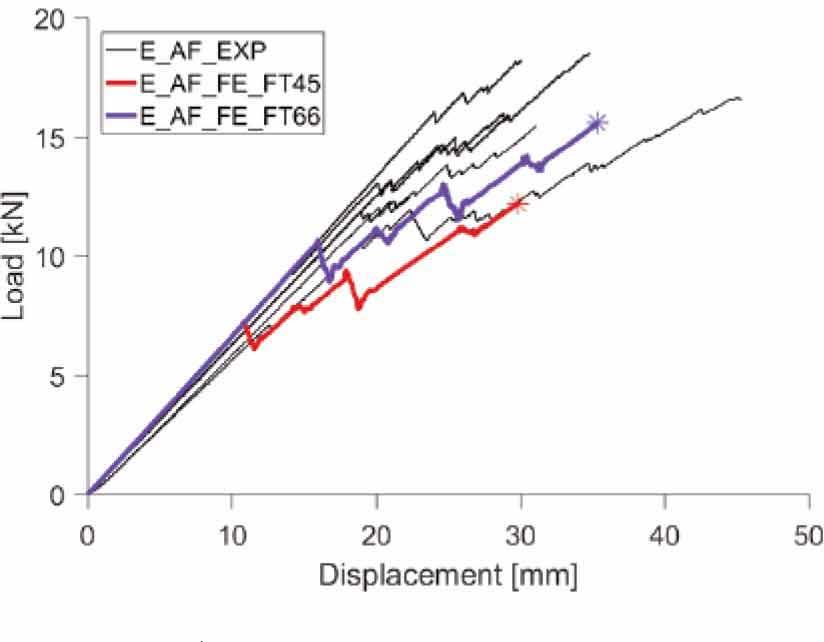
Comparison between numerical and experimental [27] loaddisplacement plots for the beam TBCB1_E_AF. Effects of different tensile strength of glass

Experimental results (mean values and standard deviations) for beam specimens [13,14,26,27,28] and corresponding FE and analytical predictions. Notation: PBSI – Post-breakage strength index PBSI = 100 × (Finit - Fult) / Fult., PCDI - Post-cracking ductility index, PCDI = 100 × (uinit - uult) / uult, FE = 100 × (resultFE – resultEXP) / resultEXP, AN = 100 × (resultAN – resultEXP) / resultEXP
| Experiments | Finite Element | Analytical | |||||||||||
|---|---|---|---|---|---|---|---|---|---|---|---|---|---|
| Beam model | Fint [kN] | Fult [kN] | PBSI [%] | PCDI [%] | Kinit [MNm2] | Model | Fint [kN] | Fult [kN] | PBSI [%] | PCDI [%] | Kinit [MNm2] | Fint [kN] | Kinit [MNm2] |
| TGCB1_E_AF | 11.6 (2.8) | 16.4 (2.2) | 51.5 (50) | 91.2 (86.7) | 0.898 (0.042) | E_AF_FE_FT45 | 7.2 | 12.2 | 70.6 | 176.9 | 0.920 | 7.5 | 0.817 |
| ΔFE/ΔAN= | -38.4% | -25.7% | 41.3% | 94.3% | 4.9% | ||||||||
| E_AF_FE_FT66 | 10.5 | 15.6 | 48.2 | 109.7 | 2.5% | 10.9 | -9.0% | ||||||
| ΔFE/ΔAN= | -9.3% | -4.94% | -3.6% | 20.5% | 3.6% | ||||||||
| TGCB1_E_HS | 25.5 (-) | 25.5 (-) | - | - | 0.898 (-) | E_HS_FE_FT45 | 25.5 | 25.5 | - | - | 24.5 | ||
| ΔFE/ΔAN= | 0.1% | 0.1% | -3.9% | ||||||||||
| TGCB1_A_HS | 25.5 (-) | 25.5 (-) | - | - | 0.907 | A_HS_FE_FT45 | 24.6 | 24.6 | - | - | 0.904 | 24.4 | 0.808 |
| ΔFE/ΔAN= | -2.4% | -2.4% | -0.3% | -3.9% | -10.6% | ||||||||
| TGCB1_S_HS | 19.8 (-) | 19.8 (-) | - | - | 0.720 | S_HS_FE_FT45 | 18.3 | 18.3 | - | - | 0.692 | 19.1 | 0.630 |
| ΔFE/ΔAN= | -7.7% | -7.7% | -3.9% | -3.5% | -12.5% | ||||||||
| TGCB2_A_AF_L | 11.1 (1.3) | 28.3 (2.4) | 158 (24.0) | 298 (51.2) | 1.253 () | A_AF_FE_L_ FT45 | 10.3 | 27.0 | 162 | 325.5 | 1.349 | 9.4 | 1.069 |
| ΔFE/ΔAN= | -7.4% | -4.7% | 4.9% | 8.9% | 7.66% | -15.3% | 3.8% | ||||||
| TGCB2_A_AF_S | 13.0 (1.1) | 28.7 (2.3) | 122 (24.0) | 210 (39.0) | 1.237 () | A_AF_FE_SG_FT45 | 10.5 | 21.8 | 108 | 302 | 1.367 | 9.6 | 1.081 |
| ΔFE/ΔAN= | -19.2% | -23.8% | -11.4 | -43.6% | 10.5% | -26.2% | 6.3% | ||||||
| TGCB2_S_AF_L | 8.8 (-) | 20.3 (-) | 131 (-) | 536 (-) | 0.918 (-) | S_AF_FE_SG_ FT45 | 8.2 | 22.8 | 179 | 465 | 1.075 | 7.4 | 0.826 |
| ΔFE/ΔAN= | -6.9% | 12.4% | 36.7% | -13.3% | 17.1% | -15.9% | -10.0% | ||||||
A comparison between numerical and experimental load-displacement plots for the beam TBCB1_E_AF is presented in Fig. 22. Numerical models simulate with fair accuracy the initial stiffness and progressive failure of the beam, however, the model E_AF_FE_FT45 with nominal tensile strength of glass ft = 45 MPa underestimates the value of load at initial cracking and ultimate load by approximately 38% and 26%, respectively. It is caused by the fact that in reality the strength of glass is higher. Based on previous studies [27], it was concluded that the average strength of glass was 66.6 MPa, which has been calculated based on the readings of the strain gauges mounted to the glass during the experimental campaign. The structural response of model E_AF_FE_FT66 with corrected tensile strength of glass (ft = 66.6 MPa) is shows much better in agreement with the experiments. In terms of the load at initial cracking of glass and ultimate failure, the difference was approximately -9% and -5%, respectively. Very good agreement has been achieved regarding initial stiffness; the numerical models overestimate experiments by 2.5%.
Numerical studies with web made of heat-strengthened glass were performed only in terms of initial stiffness and load at first cracking. The behaviour of the beams observed in the experiments was explosive and no post-breakage strength was achieved. The results for the beams with heat-strengthened glass are presented in Table 6. Fairly good agreement was achieved, in terms of initial cracking of glass it was observed that better agreement was achieved for the beams with stiff adhesives (epoxy acrylate) in comparison to the beams with silicone bond like connection.
A comparison between numerical and experimental load-displacement plots for the beam type TBCB2 is presented in Fig. 23. The numerical models show fairly good agreement with experiments regarding initial cracking load, initial stiffness, and ultimate load.
A clear difference in the behaviour of beams bonded with stiff and soft adhesive can be noticed. The model with silicone adhesive.
Table 6 presents the results of the analytical modelcompared with the results of the experiments. In terms of initial bending stiffness, the predicted values present not more than 12% error. The predicted load value at initial cracking is strictly dependent on the assumed value of the glass tensile strength.
In this paper, the structural behaviour of timber-glass composite beams made of glass panes and timber flanges bonded with adhesives of different stiffness has been investigated numerically based on the basis of earlier experimental investigations. A range of parametric studies have been conducted to investigate the influence of various model parameters such as variation of glass strength, FE geometry, FE size and variation of adhesive stiffness on the structural response. Then, a full three-dimensional finite element model has been developed in the numerical analysis of two types of beams varying in length, glass thickness, material used for flanges, and type of adhesive used to bond the glass web to the flanges.
Numerical analyses were also carried out considering the Implicit method using the XFEM approach and the Concrete Damage Plasticity (CDP) material model. In the case of the latter, poor suitability was found in modelling the behaviour of the glass sheet of the flexed beam. Using the results obtained, the actual and numerical variation of the initial stiffness of the composite beam with different adhesive stiffnesses was captured.
It is important to note a fundamental problem with the representation of the brittle fracture nature of glass for the Standard method. This is due to the procedural need for continuity during the calculation. Therefore, sudden changes in the glass structure (load spikes) are not recorded, and increasing degradation (in XFEM and CDP) causes instabilities resulting in discontinued calculations. Often, this process is preceded by numerous iterations, resulting in long calculation times. In addition, the large disparity between the compressive and tensile strengths of the glass disfavours the use of the CDP model in cyclic loading analysis situations.
Experimental investigations prove the structural concept of timber-glass composite beams. The specimens present an average value of 100% of post-breakage strength index which refers to the increased value of the load at final collapse in relation to the load at first cracking in glass. The beams also show an average value of 150% of the post-crack ductility index defined as the increase of deformation after initial cracking.
The initial bending stiffness and load-bearing capacity of timber-glass composite beams are highly influenced by the stiffness of the bond line adhesive connection; it was observed that the beams bonded with stiff adhesives present higher bending stiffness and load-bearing capacity.
Numerical analyses performed confirm the ability to model the behaviour of the timber-glass composite beams under static loading, and Abaqus/Explicit solver and Brittle cracking material model offer a suitable technique for simulating cracking of glass.
The analytical model proposed in the thesis confirms that the modified gamma method included in PN-EN 1995-1-1 can be successfully adapted to determine the stiffness of initial bending stiffness and a load at initial cracking of glass with fair accuracy.