
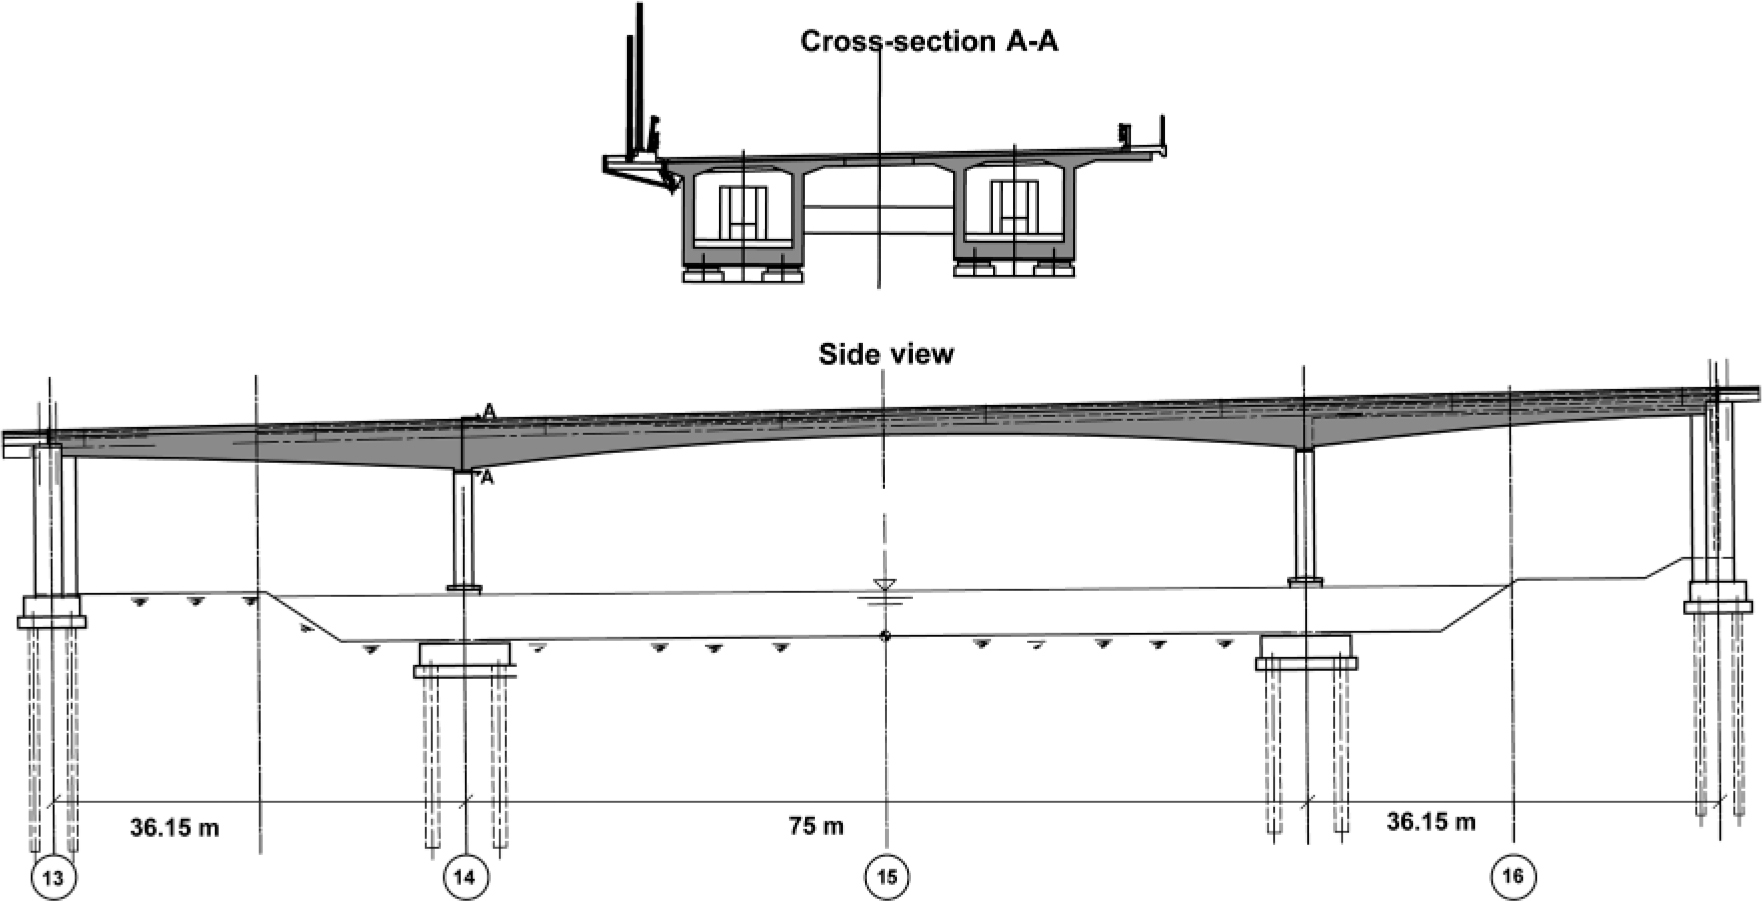
Figure 1.
Side view and cross-section of Soroksári bridge
Table 1.
Characteristics of the feedforward neural network
| Category | Details |
|---|---|
| Input Features | Displacement and strains on longitudinal direction. |
| Target Outputs | Crack width data (top and bottom extreme fibres), strains (on the transverse direction), stresses (on the transverse and longitudinal directions), and displacements (on the transverse and vertical directions). |
| Preprocessing | – Zero values replaced with non-zero means or 1e-3. – Min-Max Normalisation (range [0, 1]). |
| Data Split | – Training: 60% – Validation: 20% – Test: 20% |
| Network Architecture | – Input Layer: the same size as input features. – Hidden Layers: – Layer 1: 128 neurons, ReLU, L2 regularization (1e-4). – Layer 1: 64 neurons, ReLU, L2 regularization (1e-4). – Layer 2: 32 neurons, ReLU, L2 regularization (1e-4). – Output Layer: Linear activation for regression tasks. |
| Optimization | – Optimizer: Adam. – Learning Rate: 1e-4. |
| Loss Function | Mean Squared Error (MSE). |
| Metrics | Mean Absolute Error (MAE). |
| Training Parameters | – Batch Size: 32. – Epochs: 100 with Early Stopping (patience = 5). |
| Regularization | – L2 Regularization (1e-4). – Dropout (20%) to prevent overfitting. |
| Evaluation | Final test performance: MSE and MAE metrics. |
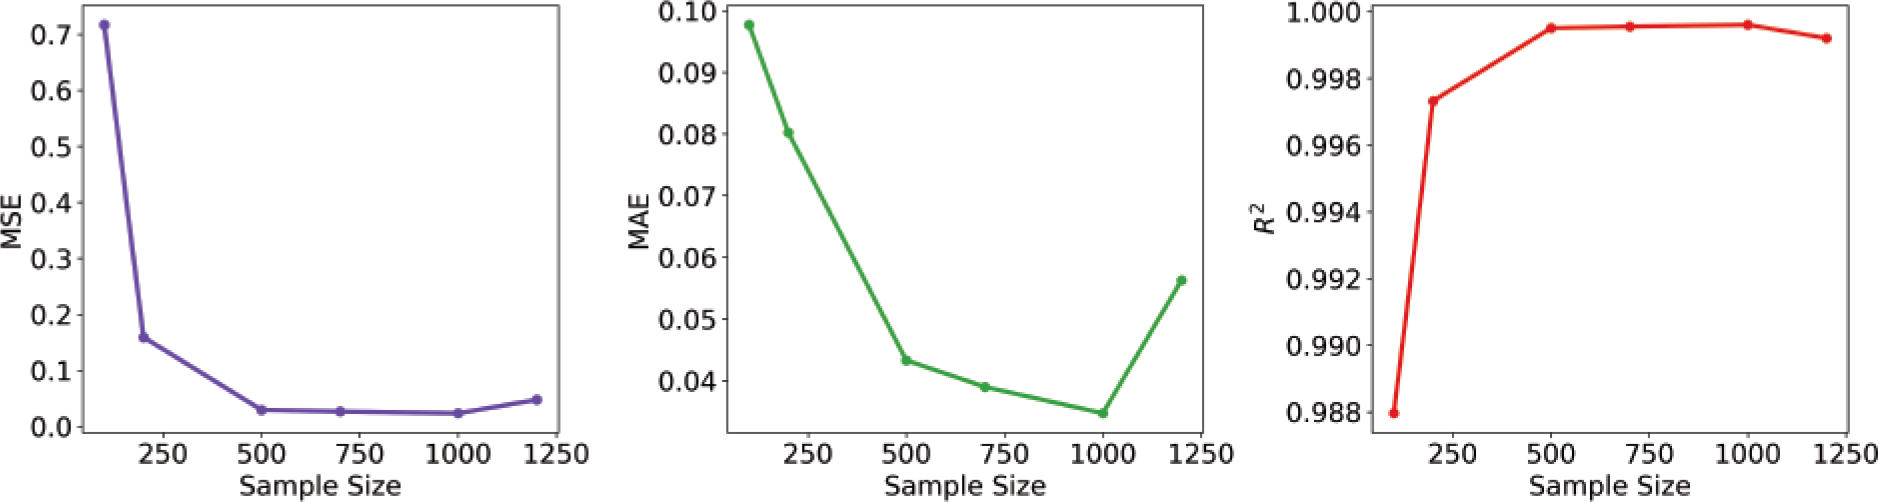
Figure 2.
Effect of sample size on FNN performance metric: mean square error (MSE), mean absolute error (MAE) and coefficient of determination (R2)
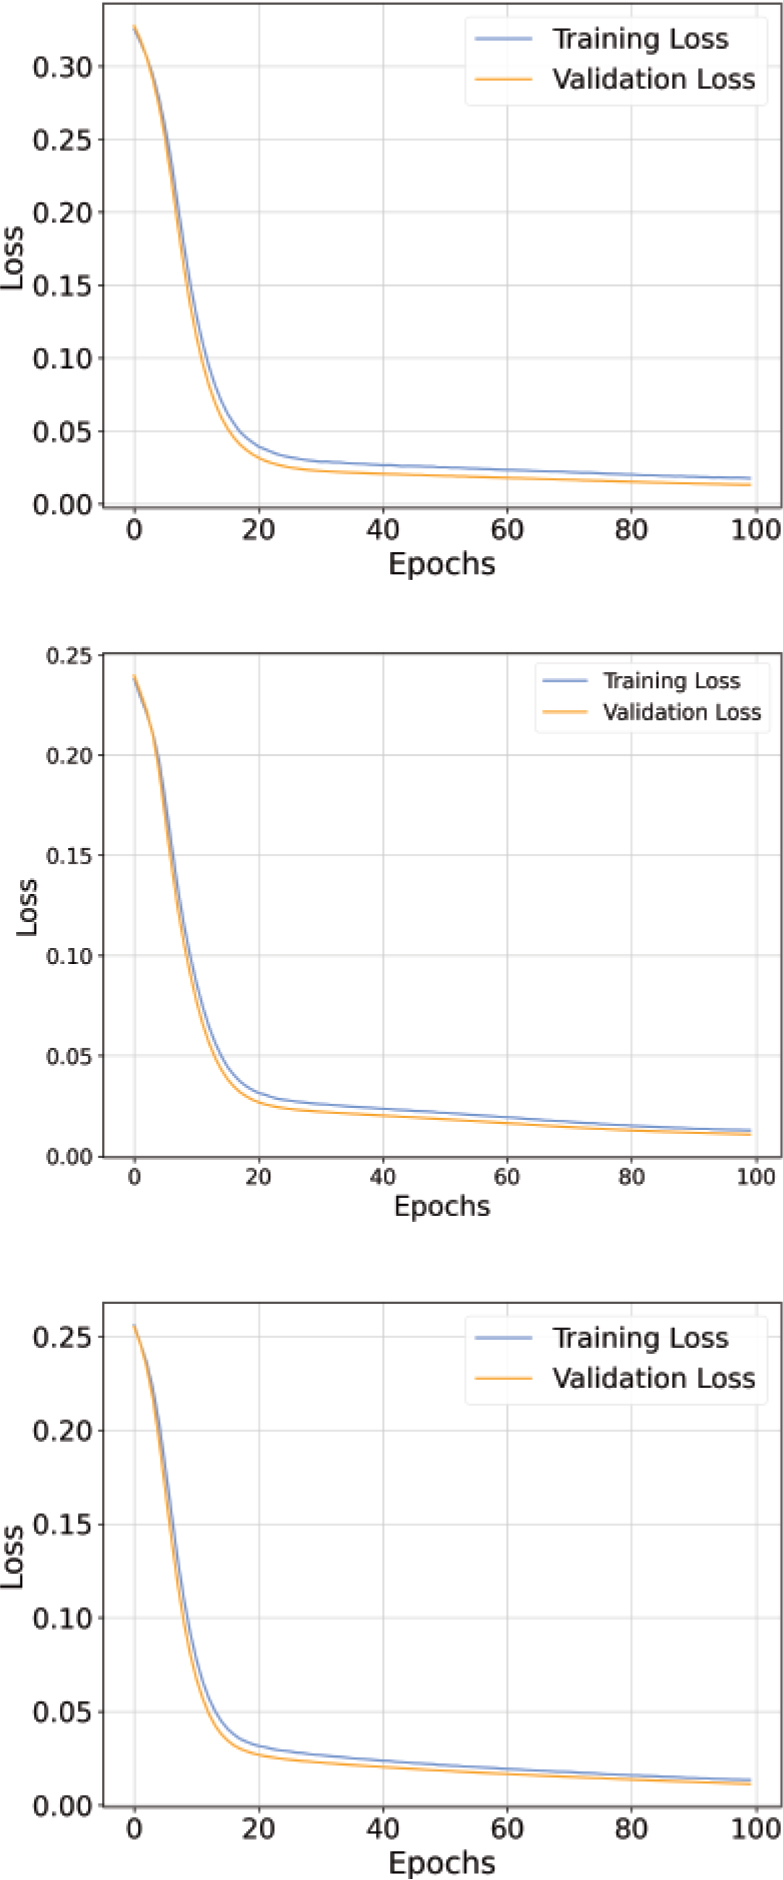
Figure 3.
Training and validation loss for the ANN model for; 17 locations (A), 25 locations (B), and 40 locations (C)
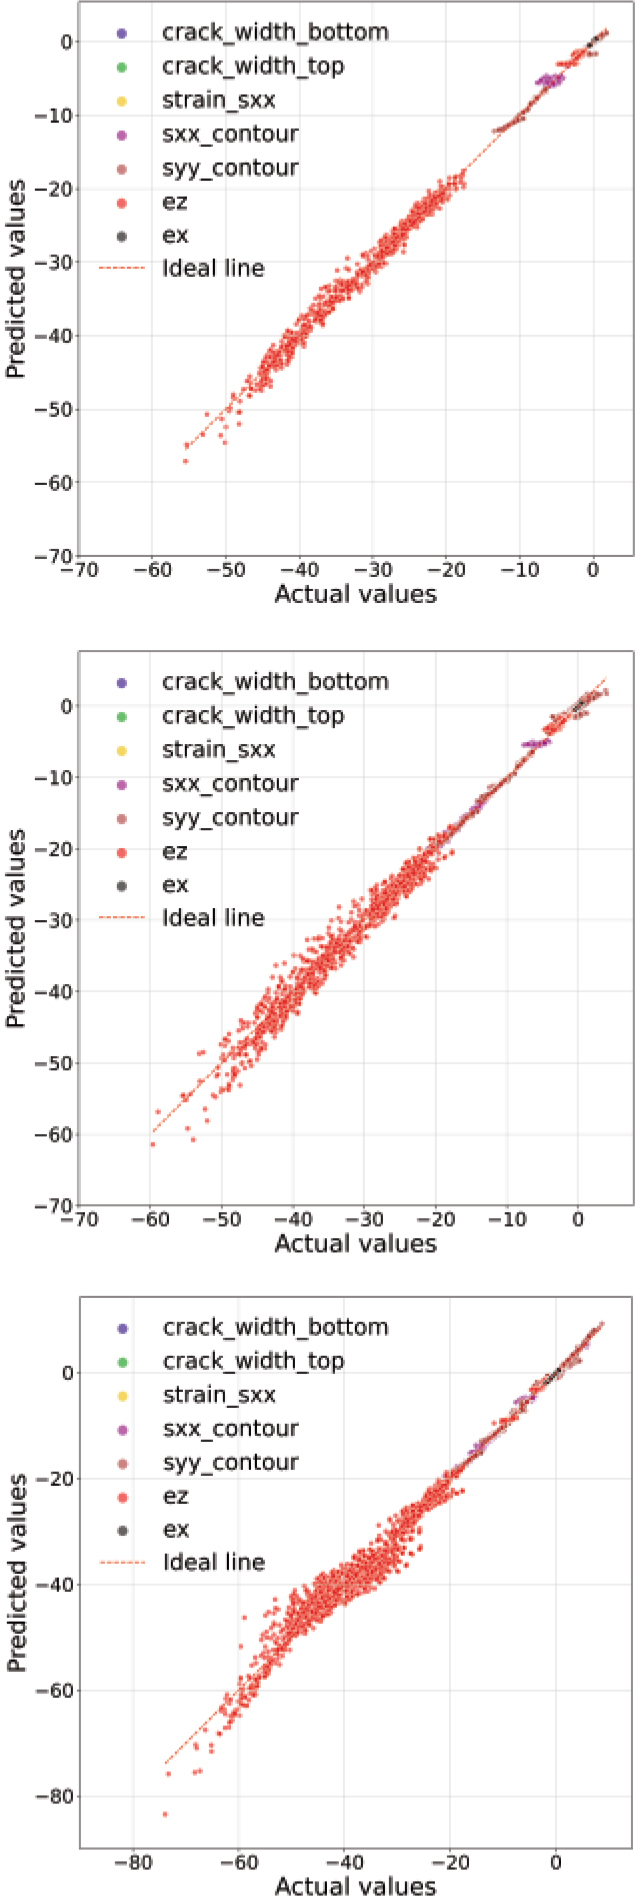
Figure 4.
Predicted vs. and actual values for the FNN model for; 17 locations (A), 25 locations (B), and 40 locations (C)
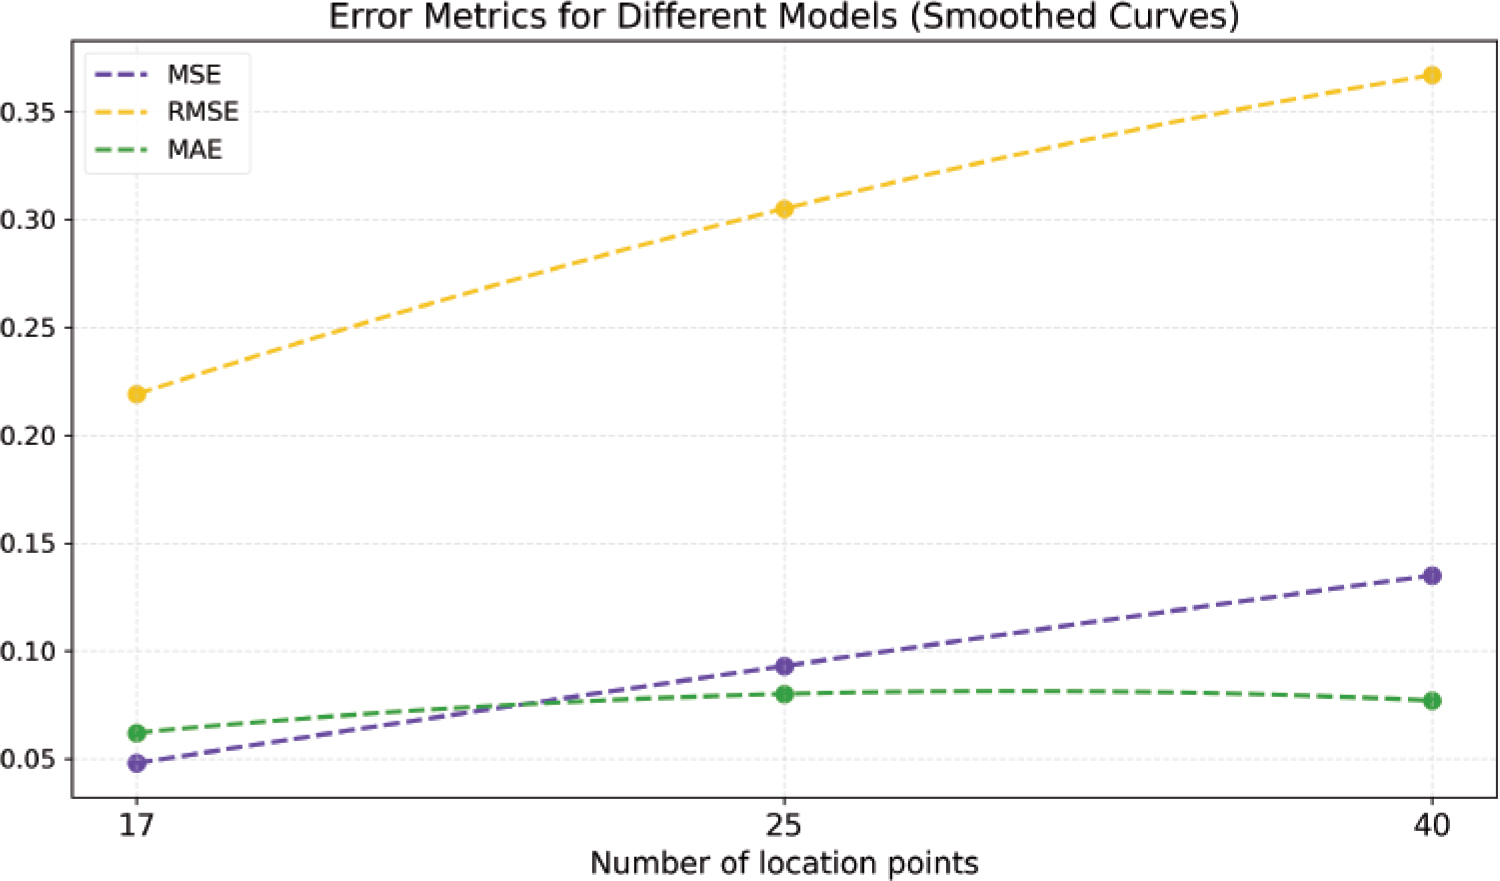
Figure 5.
Normalised metrics comparison across model versions
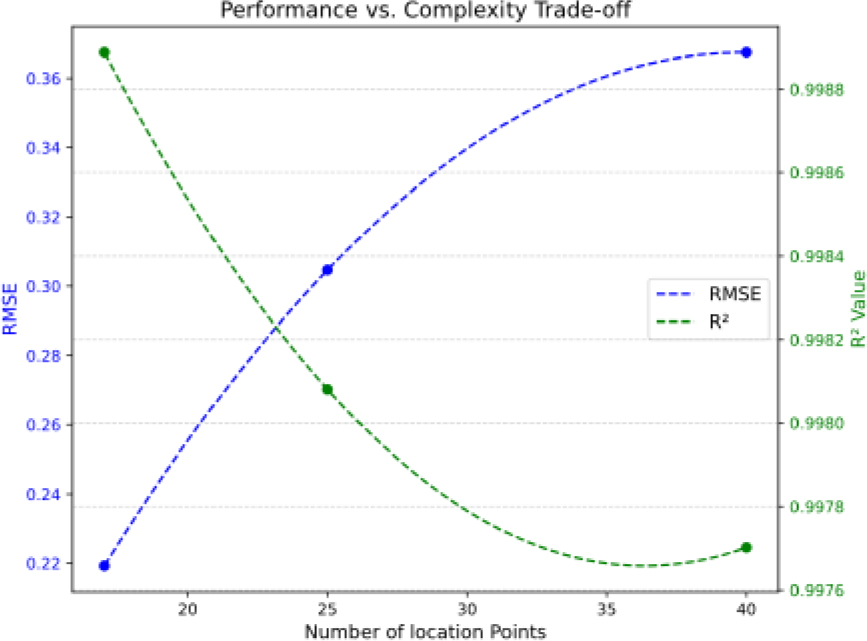
Figure 6.
Performance vs. complexity trade-off
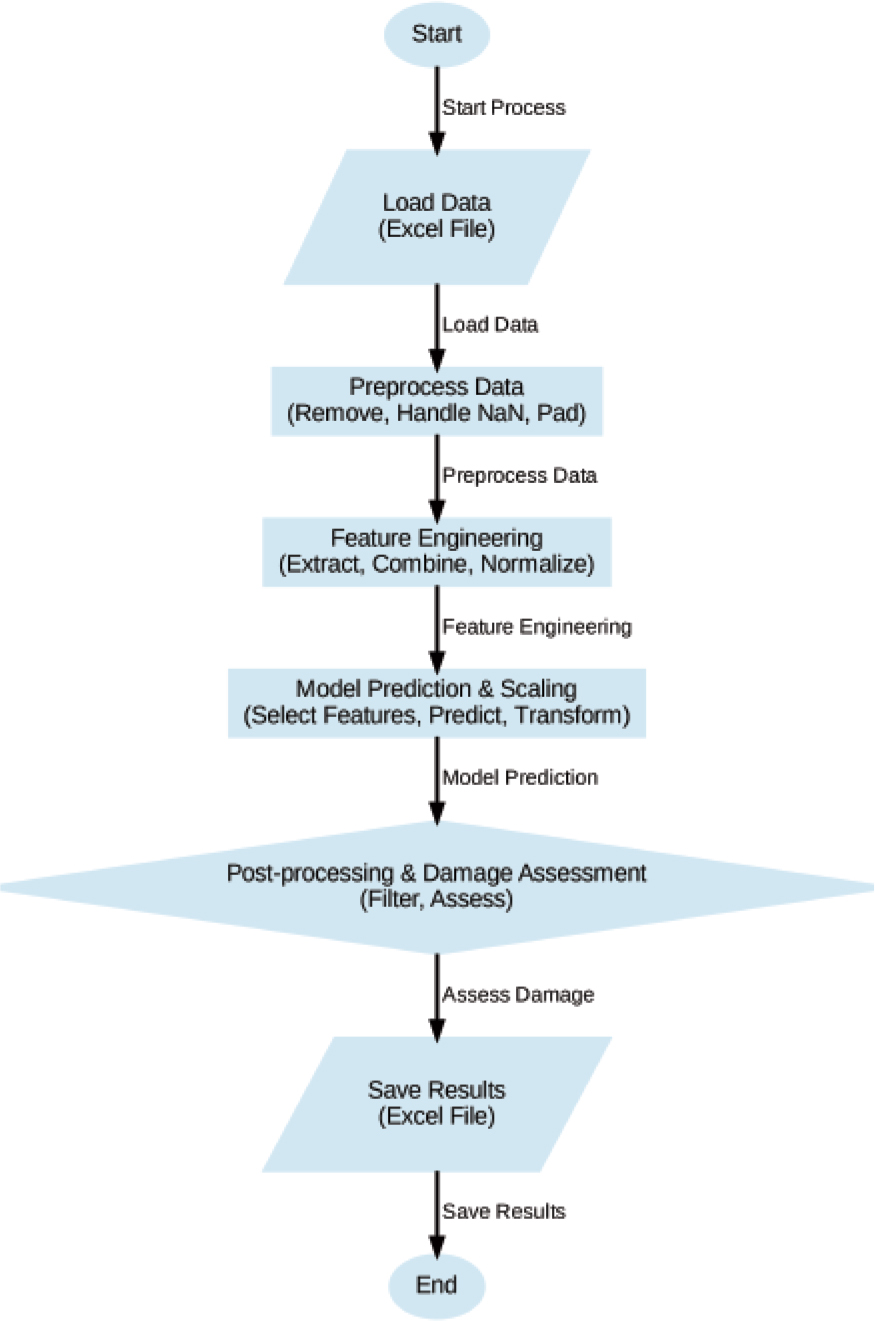
Figure 7.
Code steps for forecasting structural features
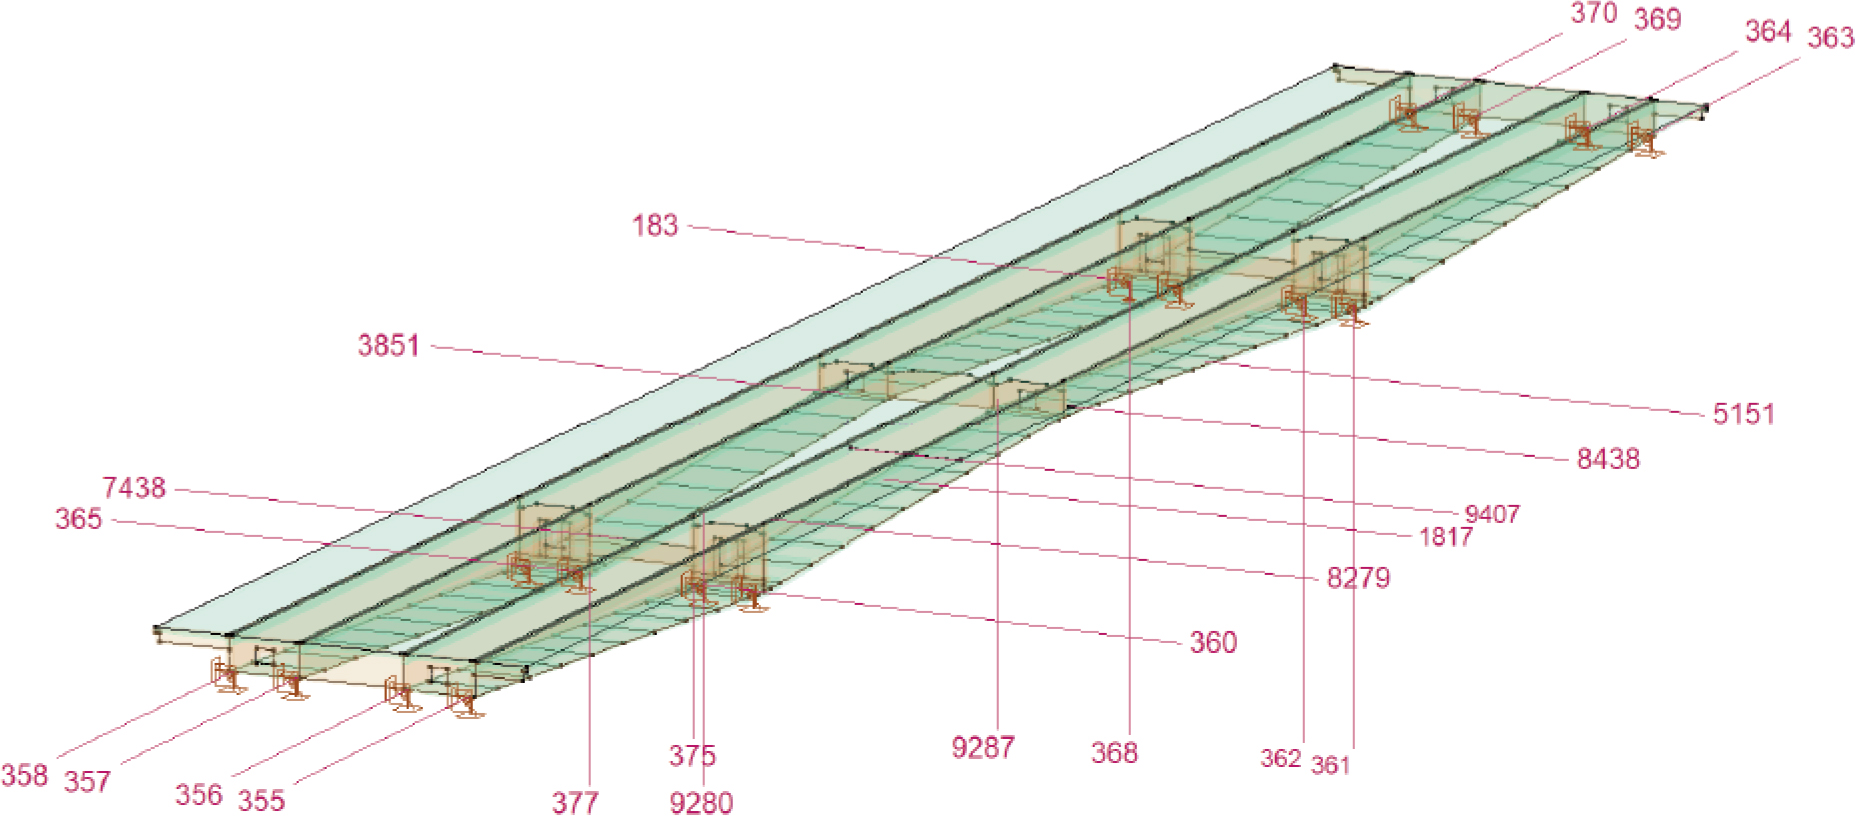
Figure 8.
Locations for making predictions on Soroksári bridge
Table 2.
Selected nodes
| Node | Type of sensor | Location |
|---|---|---|
| 183 | × | Bottom of the left box girder at support 15/1 |
| 355 | Displacement | at support 13/4 |
| 356 | Displacement | at support 13/3 |
| 357 | Displacement | at support 13/2 |
| 358 | Displacement | at support 13/1 |
| 360 | × | at support 14/3 |
| 361 | Displacement | at support 15/4 |
| 362 | Displacement | at support 15/3 |
| 363 | Displacement | at support 16/4 |
| 364 | Displacement | at support 16/3 |
| 365 | × | at support 14/2 |
| 368 | × | at support 15/1 |
| 369 | Displacement | at support 16/2 |
| 370 | Displacement | at support 16/1 |
| 375 | × | Bottom slab of the box girder near Support 14/3 |
| 377 | × | Bottom slab of the box girder near support 14/2 |
| 1817 | Strain | Bottom slab of the right-side box girder in the first quarter of the bridge |
| 3851 | × | Bottom of the transverse wall at the middle cross-section on the left-side box girder |
| 5151 | Strain | Bottom slab of the right-side box girder in the third quarter of the bridge |
| 7438 | × | Middle top of the transverse wall at Pier 14 |
| 8279 | Strain | Top slab in the right-side box girder near Pier 14 (right side) |
| 8438 | Strain | Right-side internal wall of the right box girder at the middle cross-section of the bridge |
| 9280 | Strain | Top slab of the right-side box girder at Pier 14 (left side) |
| 9287 | Strain | Left-side internal wall of the right box girder at the middle cross-section of the bridge |
| 9407 | Strain | Top slab of the right-side box girder in the second quarter of the bridge |
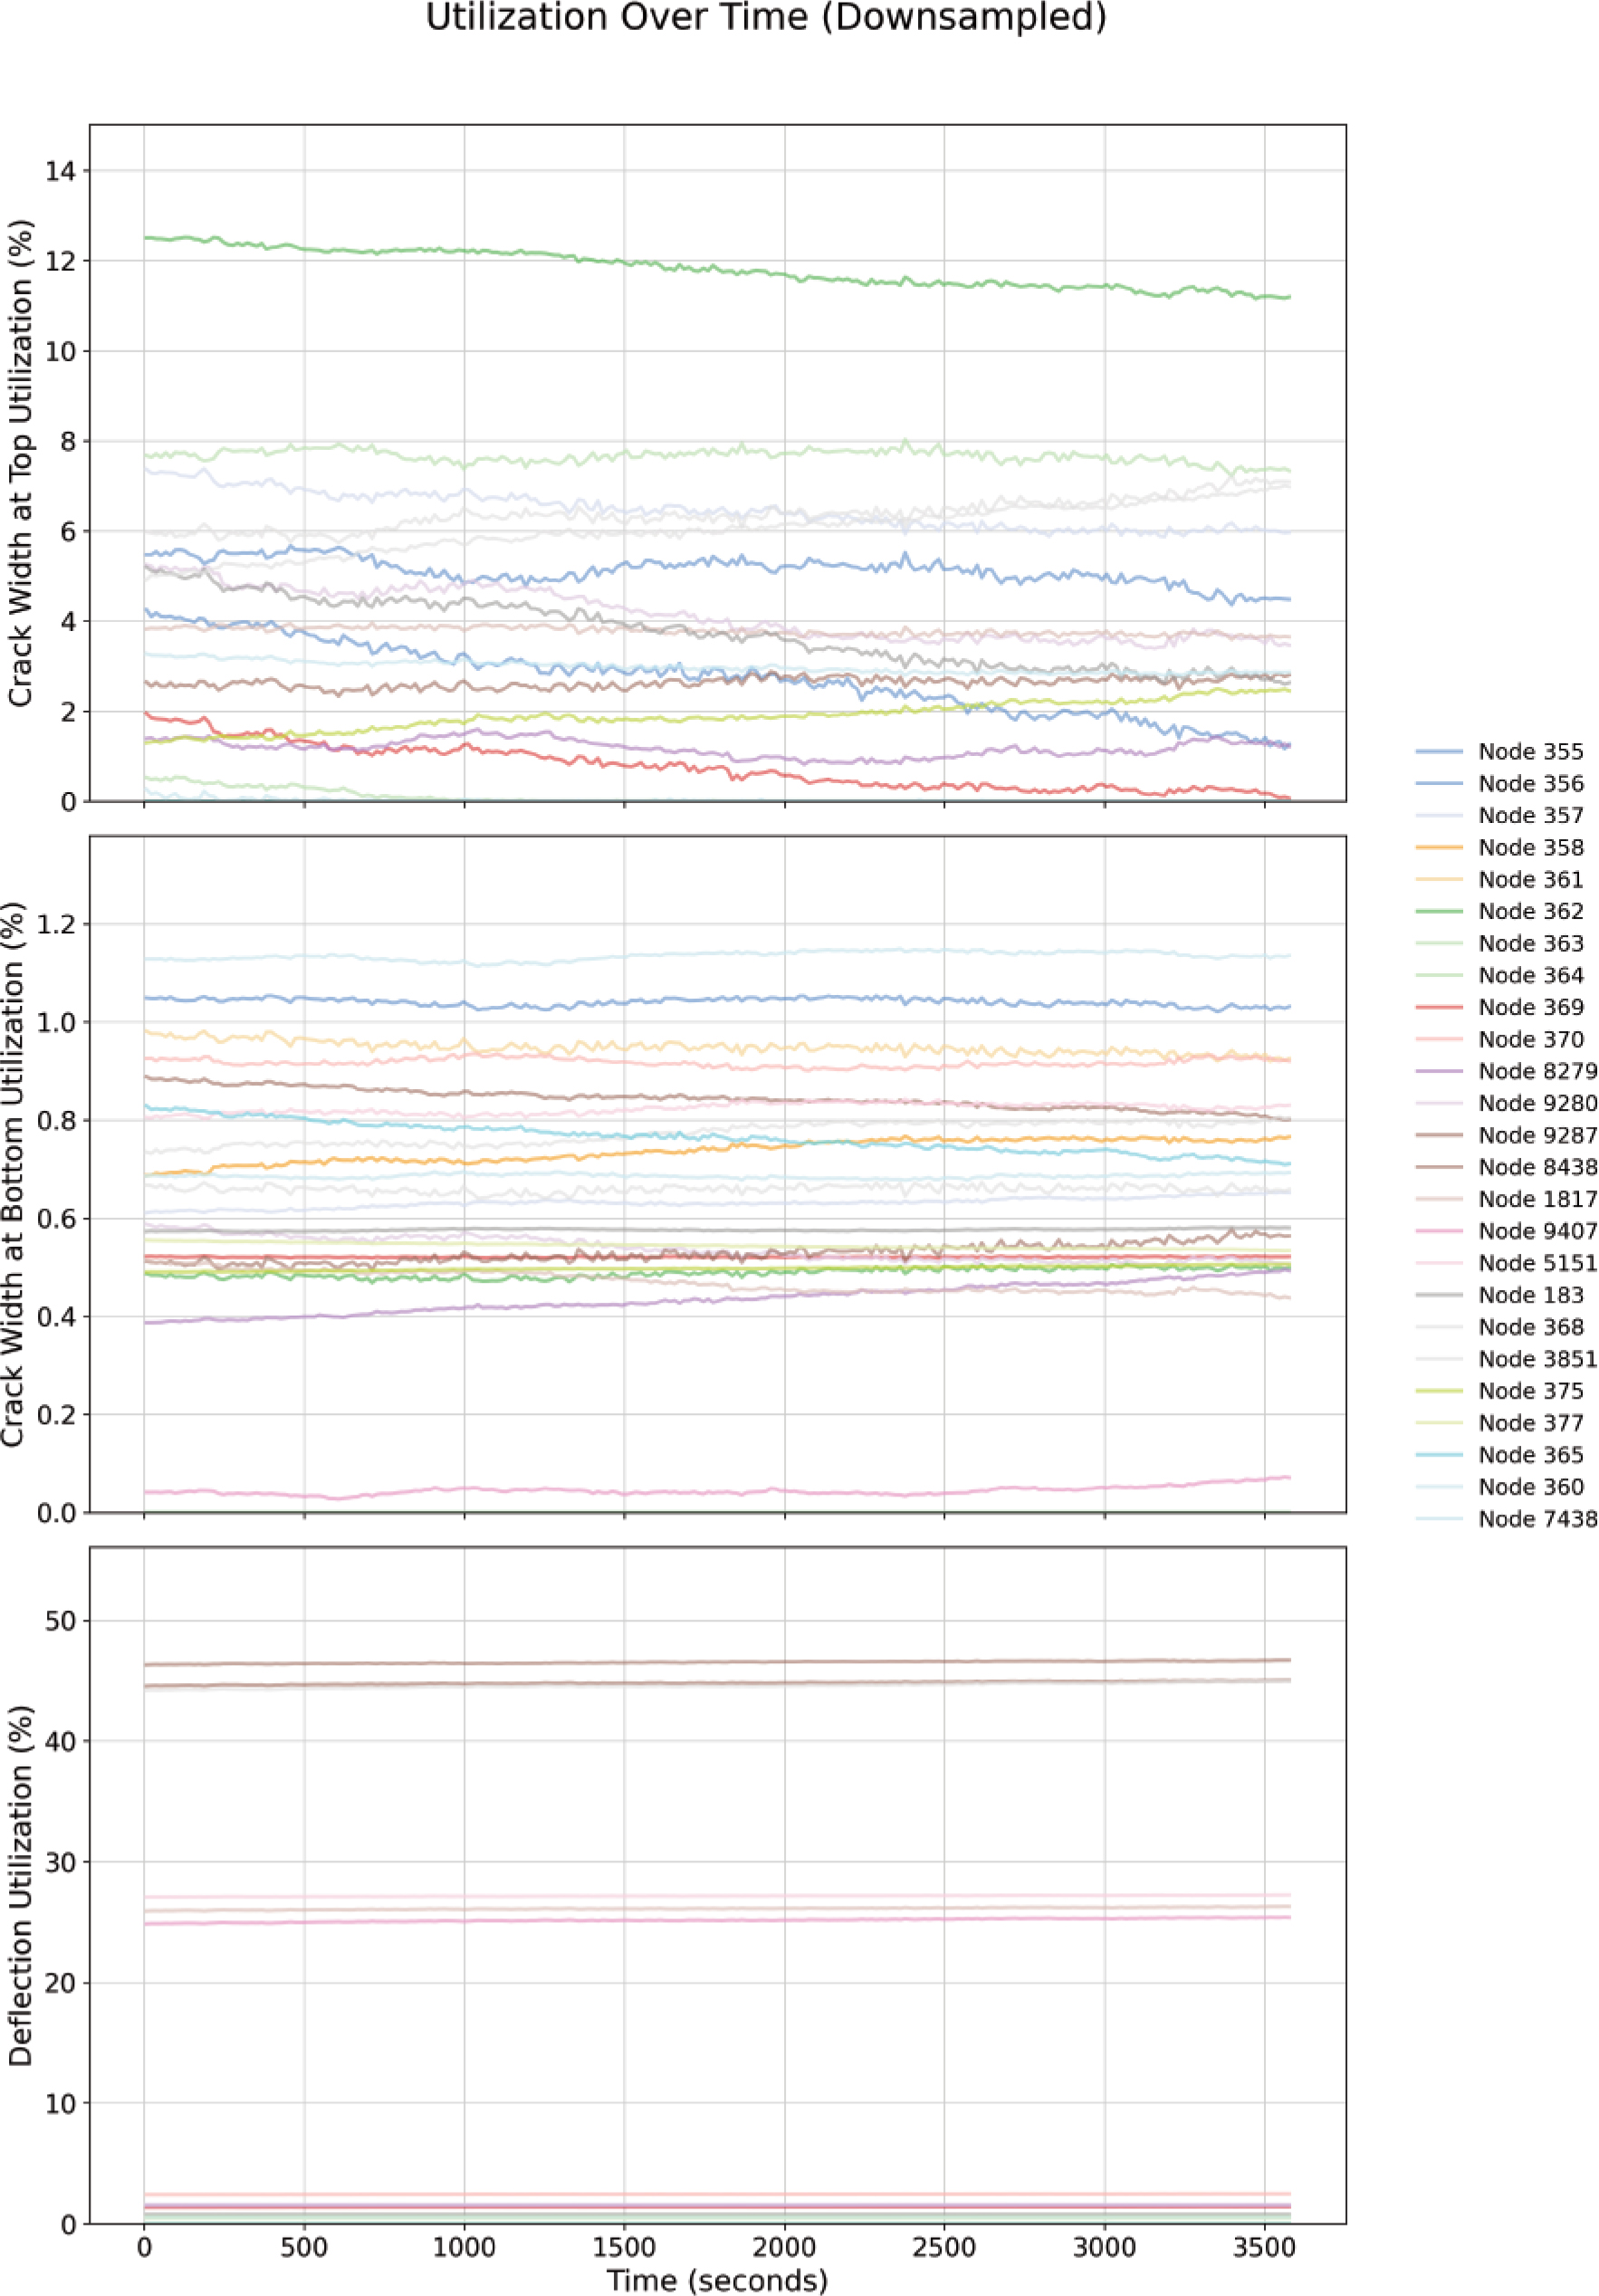
Figure 9.
Top crack width utilisations (A), bottom crack width utilisations (B) and deflection utilisations (C).