
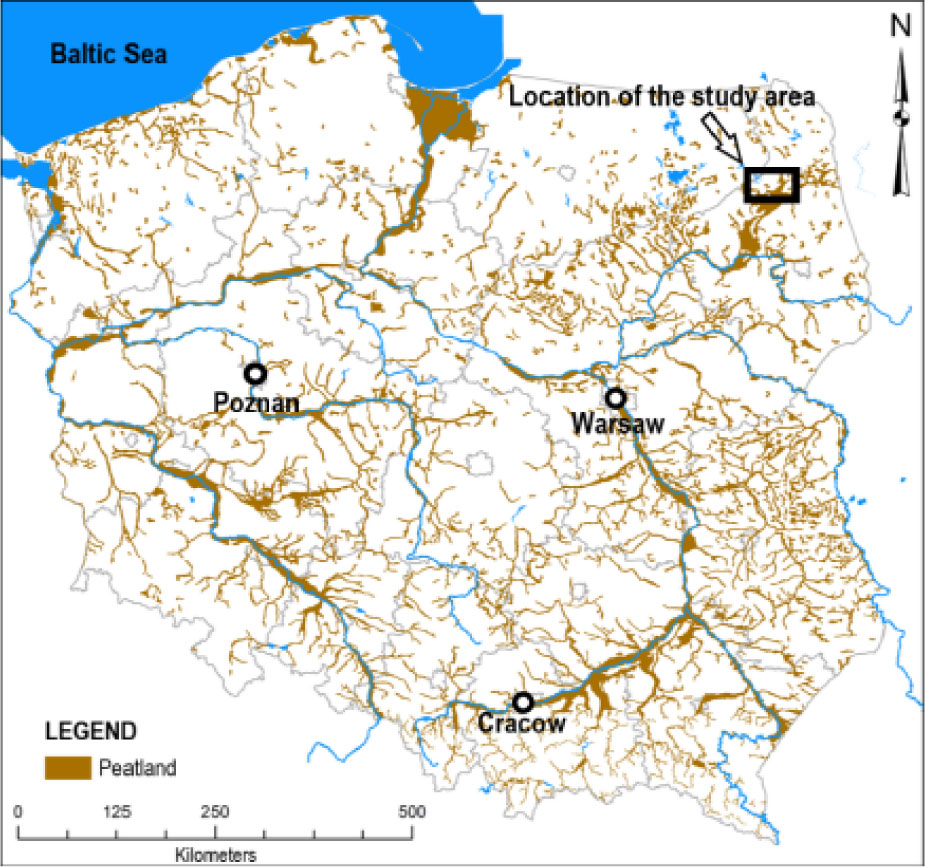
Figure 1.
Location of the study area (based on [16])
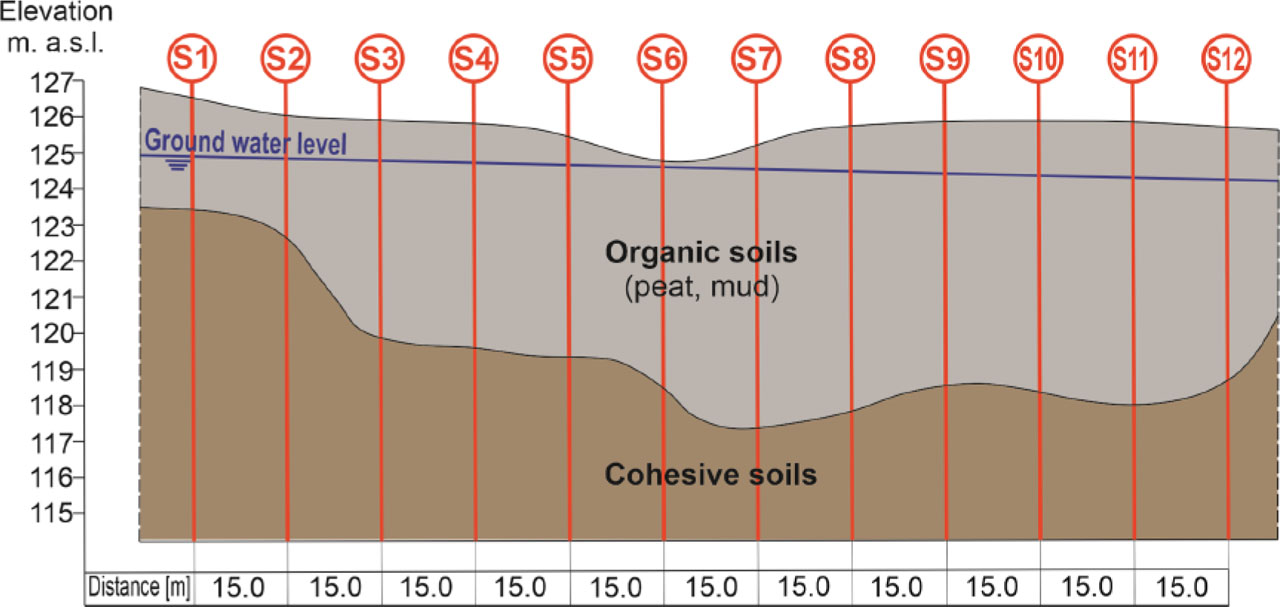
Figure 2.
The geotechnical cross-section of the analyzed subsoil and CPTU test locations
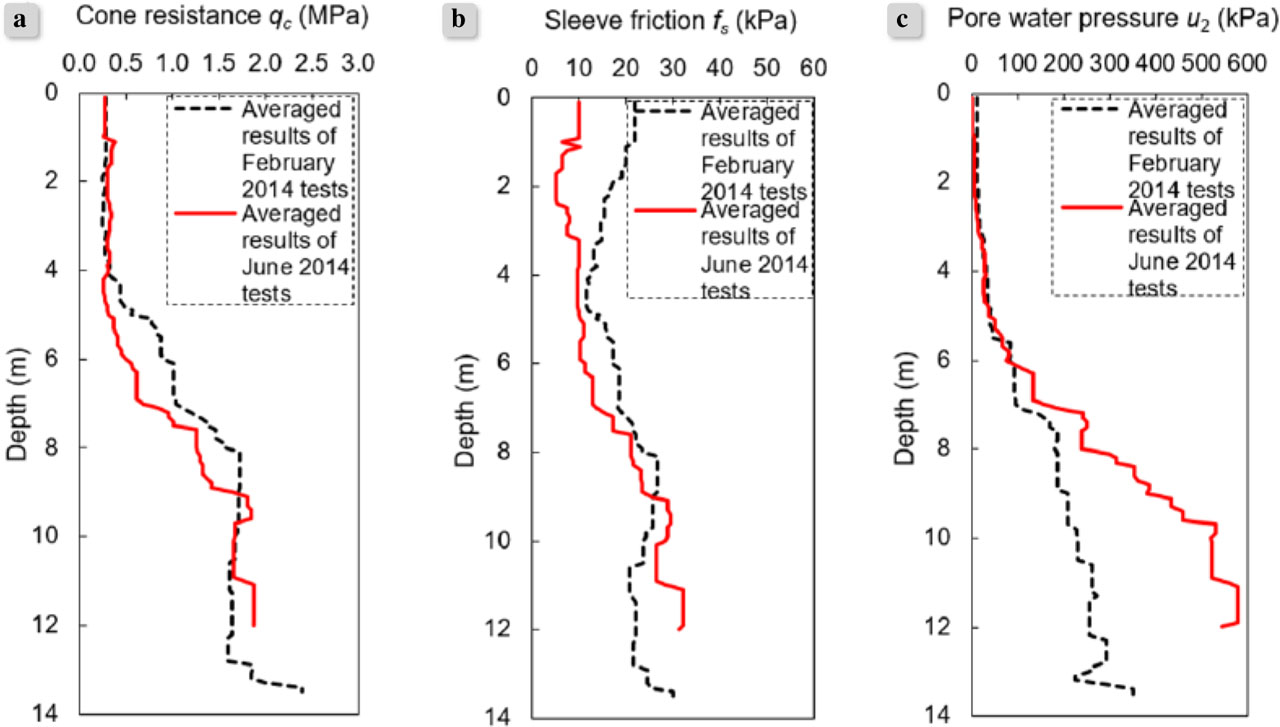
Figure 3.
Averaged measurements of (a) cone resistance; (b) sleeve friction; (c) pore water pressure
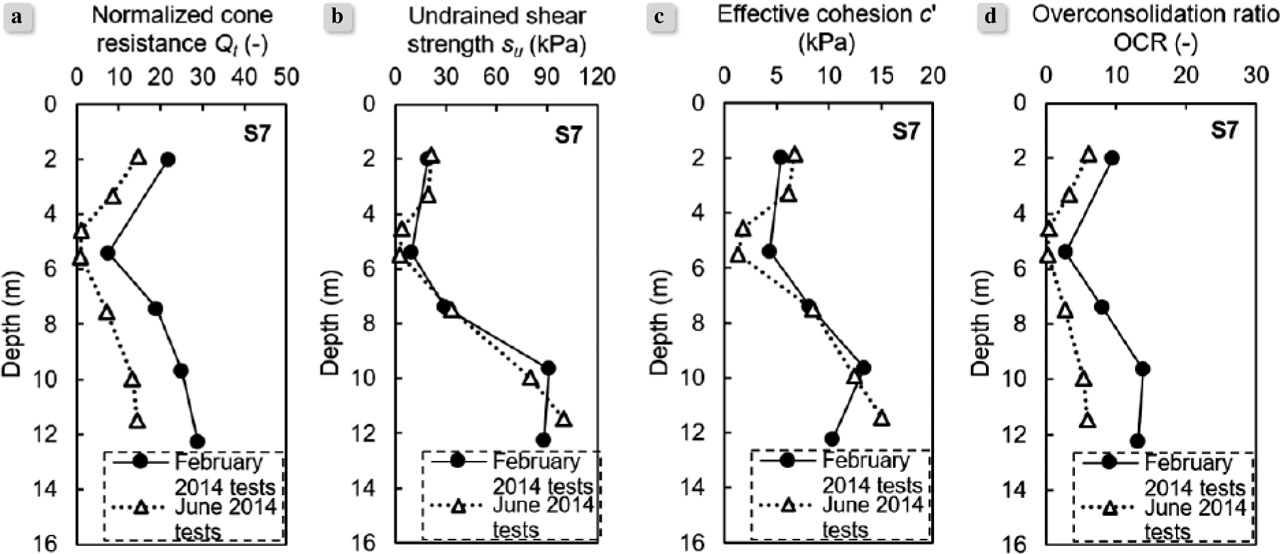
Figure 4.
Values of (a) normalized cone resistance; (b) undrained shear strength; (c) effective cohesion; (d) overconsolidation ratio in location S7
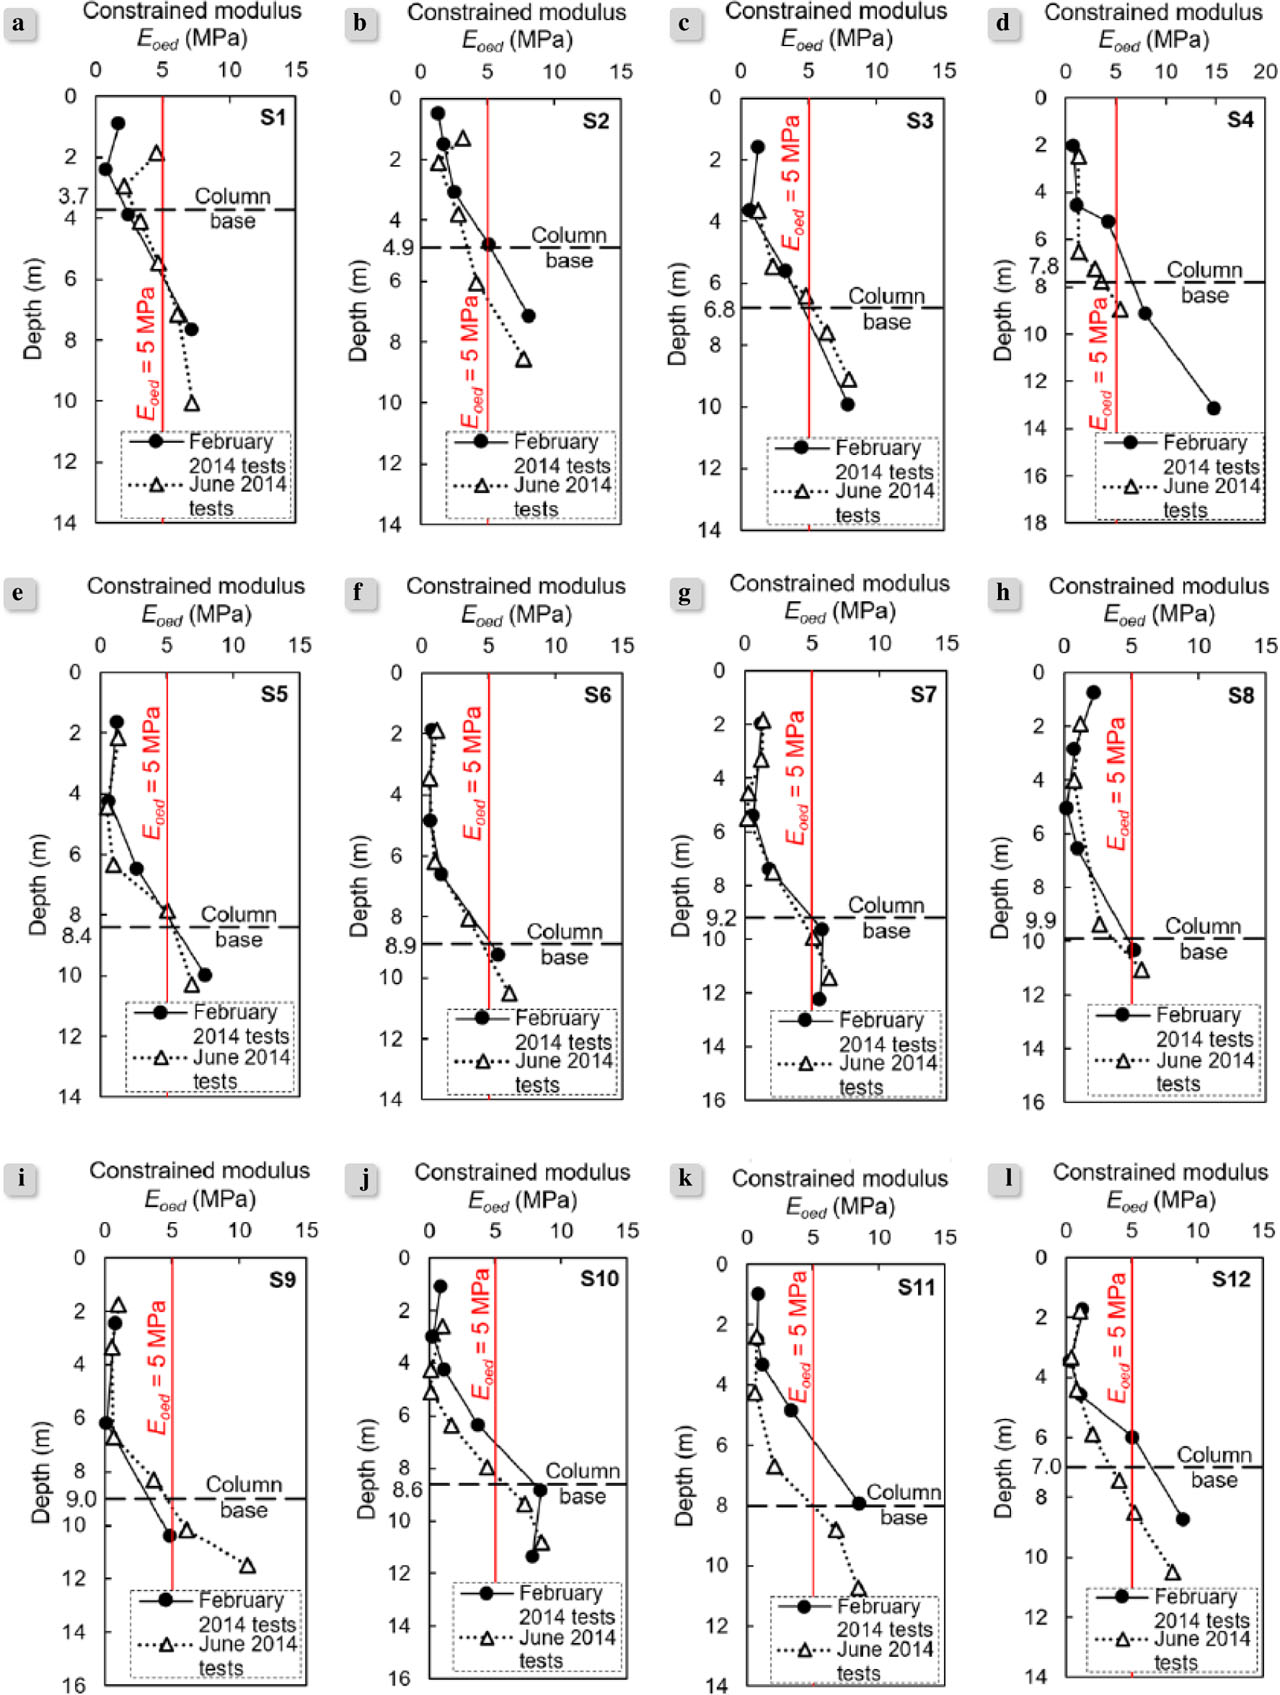
Figure 5.
The values of the constrained modulus Eoed estimated at test points (a) – (l) S1 – S12
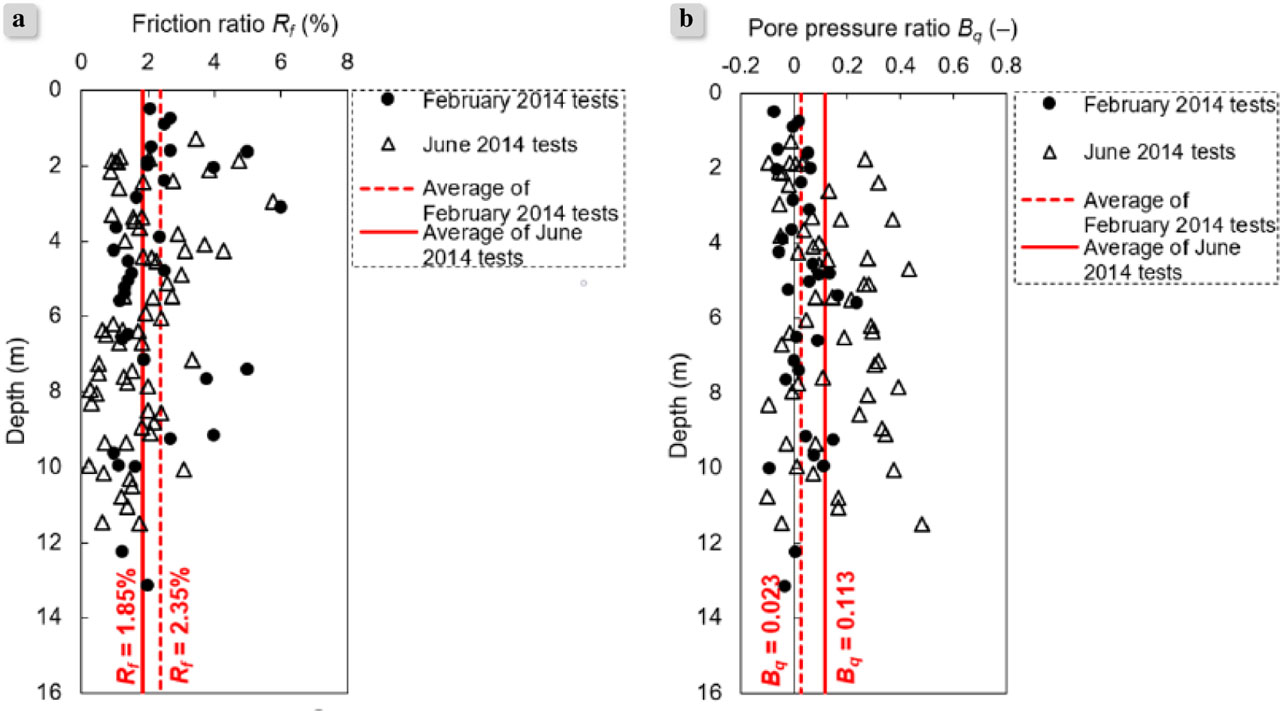
Figure 6.
Dependence of (a) friction ratio Rf; (b) pore pressure ratio Bq on depth at locations S1–S12
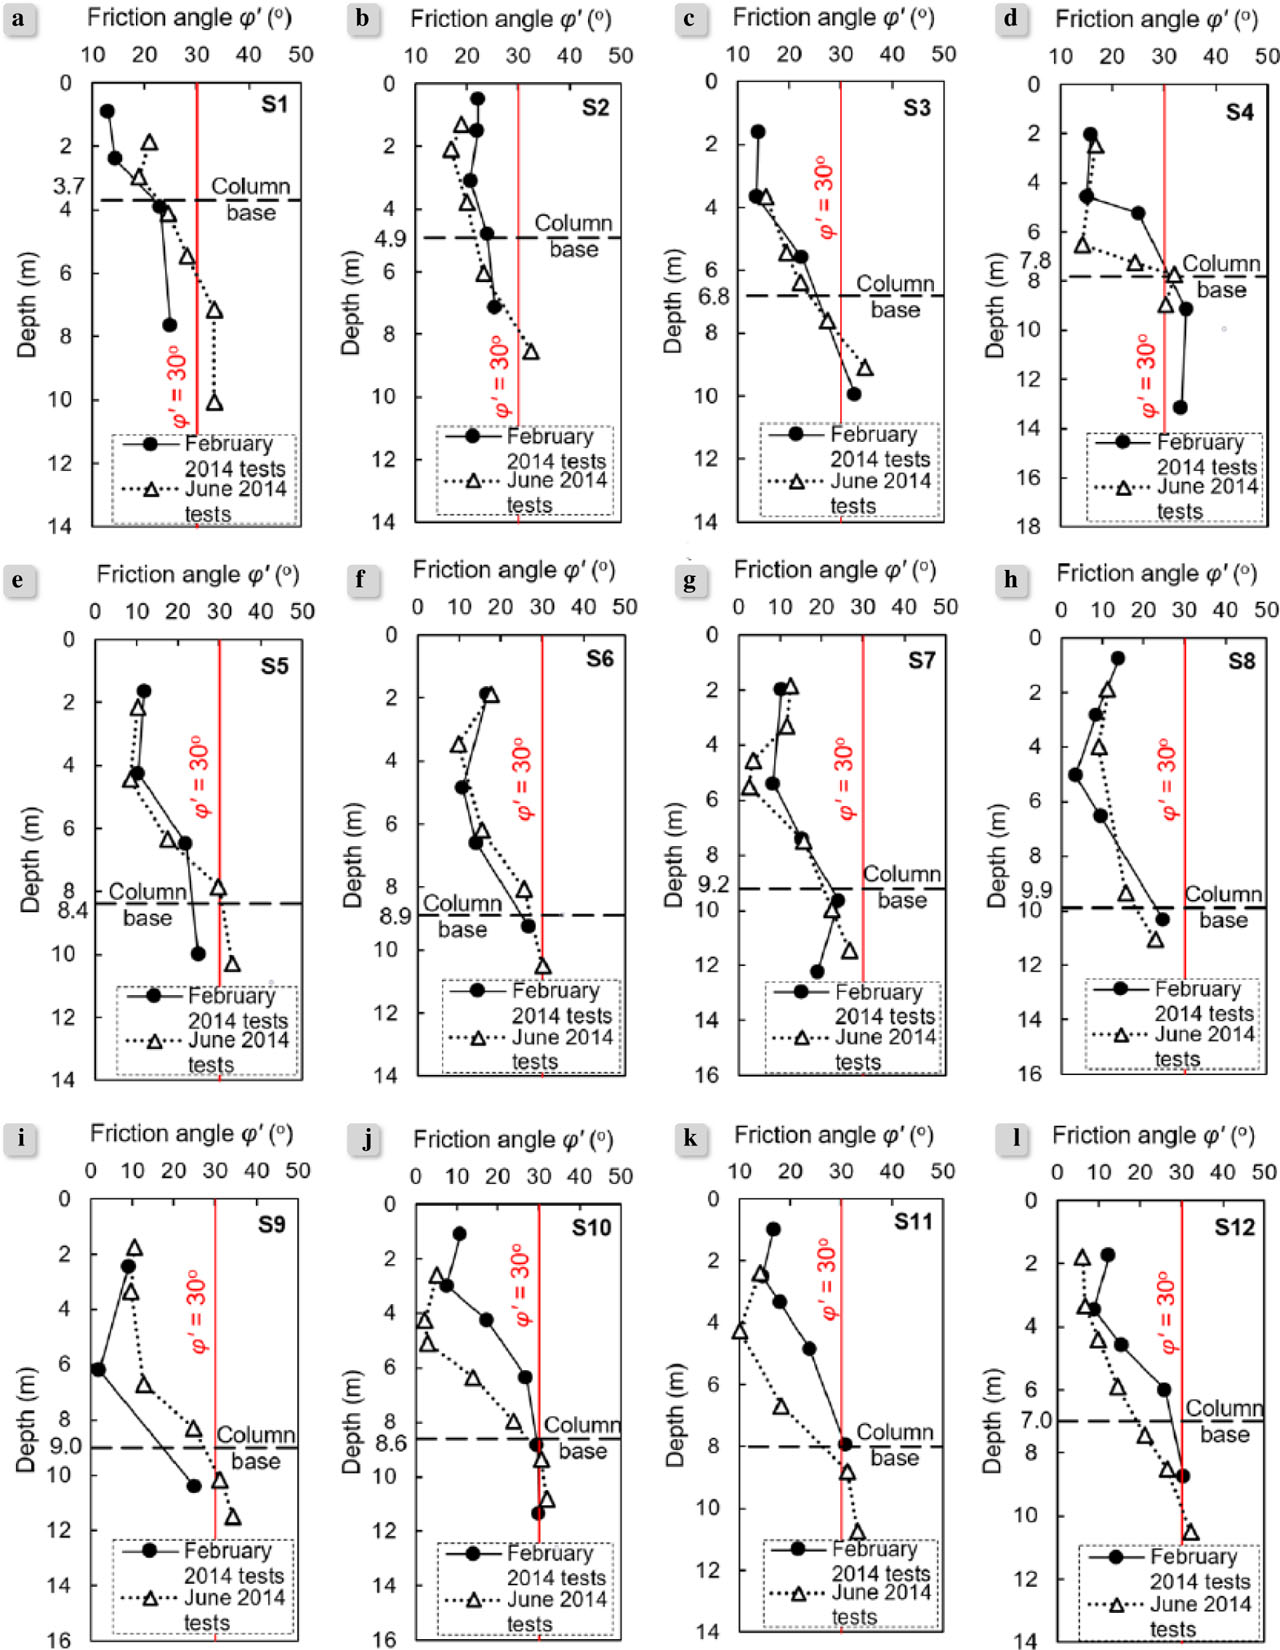
Figure 7.
The values of the effective friction angle φ’ estimated at test points (a) – (l) S1 – S12