
Figure 1
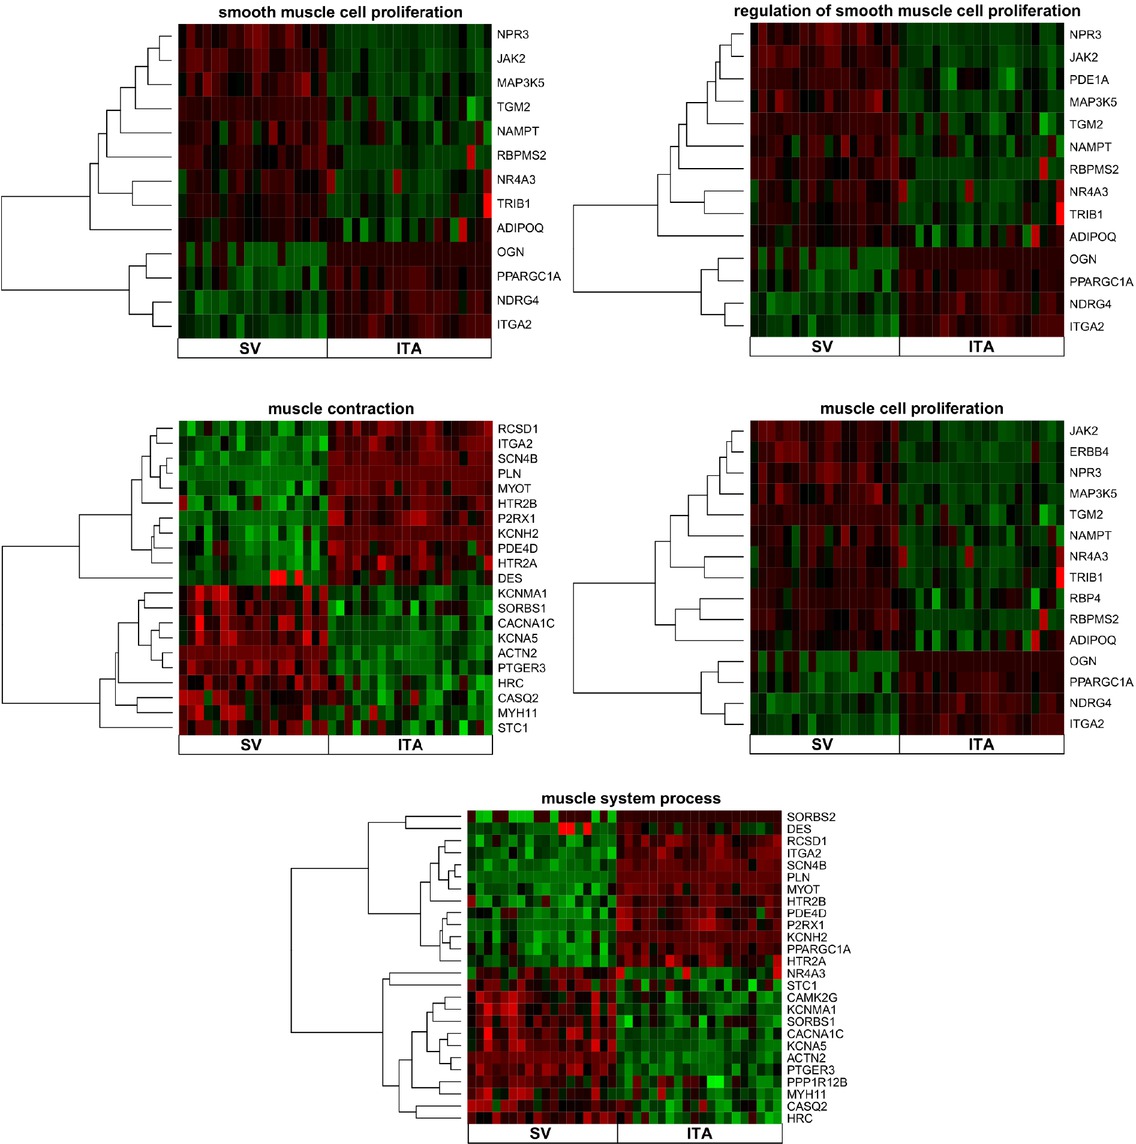
Heatmaps presenting differentially expressed genes involved in “muscle cell proliferation”, “muscle contraction”, “muscle system process”, “regulation of smooth muscle cell proliferation” and “smooth muscle cell proliferation” based on GO BP terms. Each row on the Y axis represents a single transcript. The red color indicates downregulated genes while the green are upregulated
Table 1
The 10 most significantly upregulated and 10 most significantly downregulated genes involved in muscle system process
| Gene symbol | Gene name | Fold change | Adj. p.val |
|---|---|---|---|
| ACTN2 | actinin, alpha 2 | 10.99 | <0.05 |
| RBPMS2 | RNA binding protein with multiple splicing 2 | 6.57 | <0.05 |
| NR4A3 | nuclear receptor subfamily 4, group A, member 3 | 5.72 | <0.05 |
| KCNA5 | potassium voltage-gated channel, shaker-related subfamily, member 5 | 5.46 | <0.05 |
| NPR3 | natriuretic peptide receptor C/guanylate cyclase C (atrionatriuretic peptide receptor C) | 5.30 | <0.05 |
| PTGER3 | prostaglandin E receptor 3 (subtype EP3) | 3.53 | <0.05 |
| RBP4 | retinol binding protein 4, plasma | 3.23 | <0.05 |
| OGN | osteoglycin | 3.23 | <0.05 |
| JAK2 | Janus kinase 2 | 3.18 | <0.05 |
| MYH11 | myosin, heavy chain 11, smooth muscle | 3.17 | <0.05 |
| PPARGC1A | peroxisome proliferator-activated receptor gamma, coactivator 1 alpha | -2.20 | <0.05 |
| NDRG4 | NDRG family member 4 | -2.22 | <0.05 |
| HTR2A | 5-hydroxytryptamine (serotonin) receptor 2A, G protein-coupled | -2.32 | <0.05 |
| ITGA2 | integrin, alpha 2 (CD49B, alpha 2 subunit of VLA-2 receptor) | -2.38 | <0.05 |
| HTR2B | 5-hydroxytryptamine (serotonin) receptor 2B, G protein-coupled | -2.64 | <0.05 |
| SCN4B | sodium channel, voltage-gated, type IV, beta subunit | -3.13 | <0.05 |
| MYOT | myotilin | -3.39 | <0.05 |
| DES | desmin | -4.44 | <0.05 |
| KCNH2 | potassium voltage-gated channel, subfamily H (eag-related), member 2 | -6.25 | <0.05 |
| P2RX1 | purinergic receptor P2X, ligand-gated ion channel, 1 | -6.48 | <0.05 |
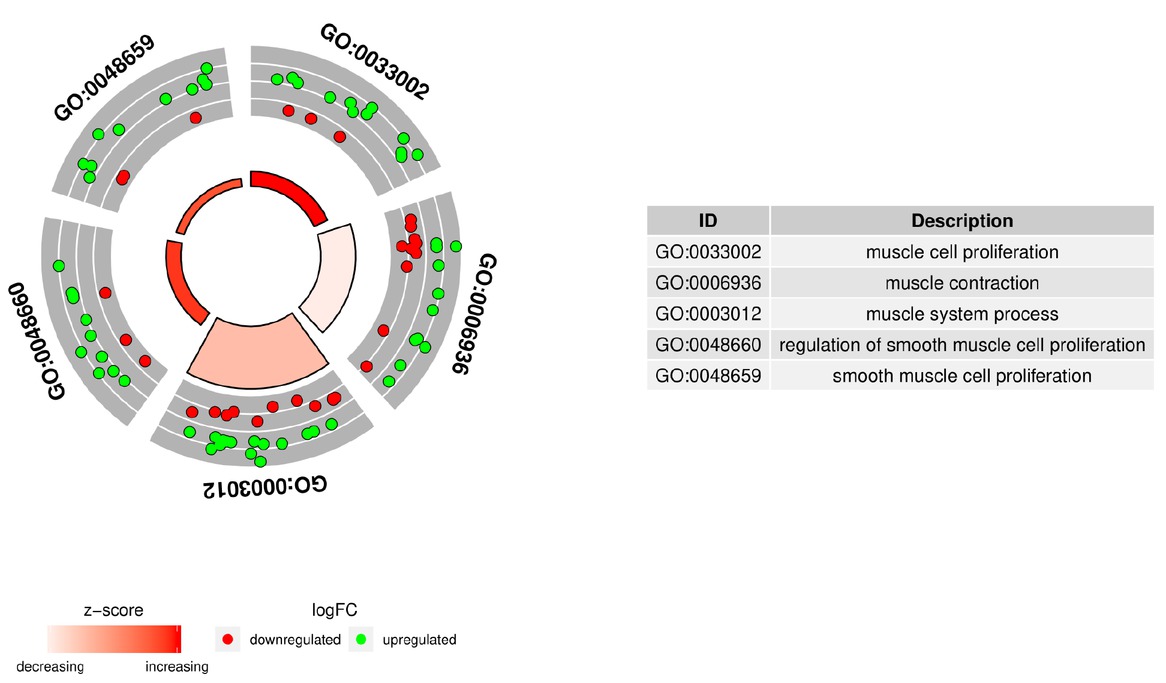
Figure 2
The circular scatter plots of differentially expressed genes involved in “muscle cell proliferation”, “muscle contraction”, “muscle system process”, “regulation of smooth muscle cell proliferation” and “smooth muscle cell proliferation” GO BP terms. Each dot represents a single gene. The z-scores were presented as segments of inner circles
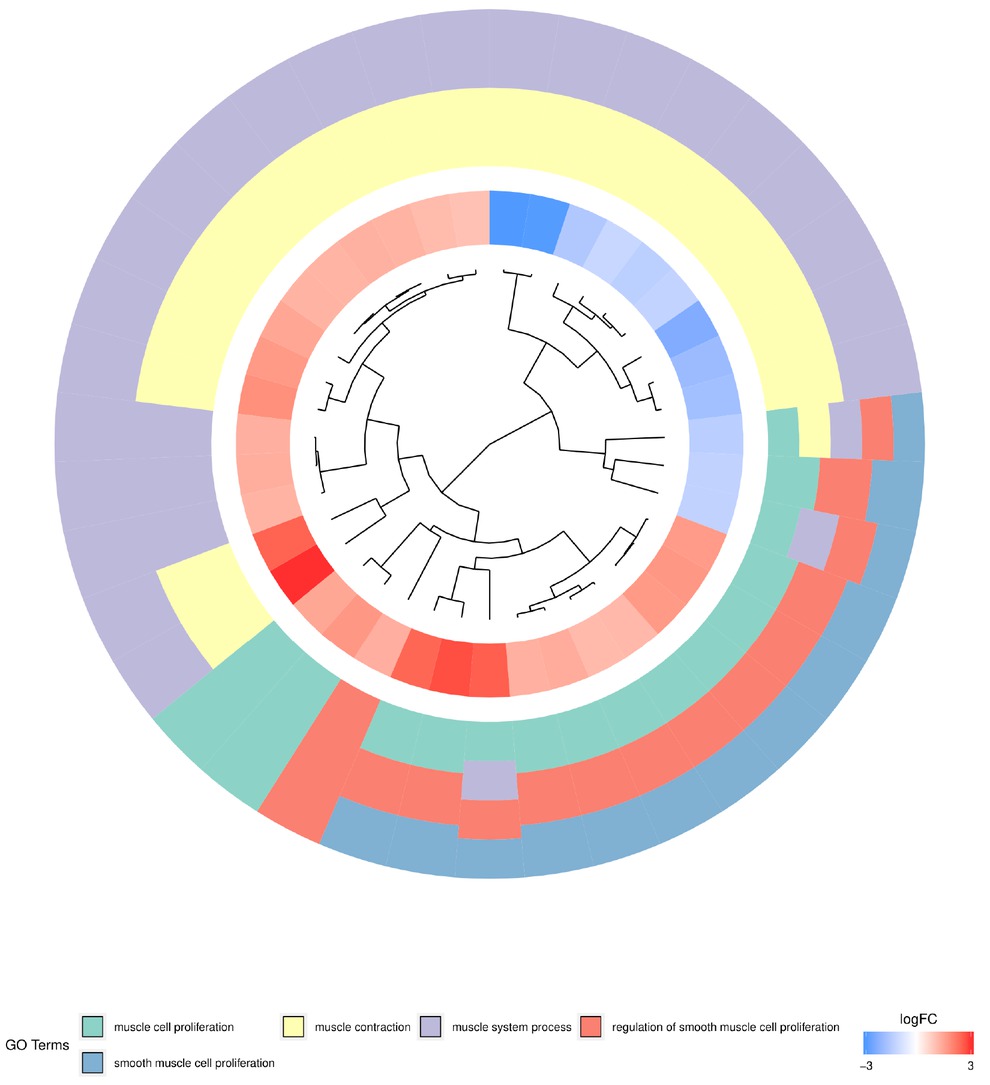
Figure 3
The dendrogram of differentially expressed genes involved in “muscle cell proliferation”, “muscle contraction”, “muscle system process”, “regulation of smooth muscle cell proliferation” and “smooth muscle cell proliferation” GO BP terms. The DEGs were clustered based on their logFC values
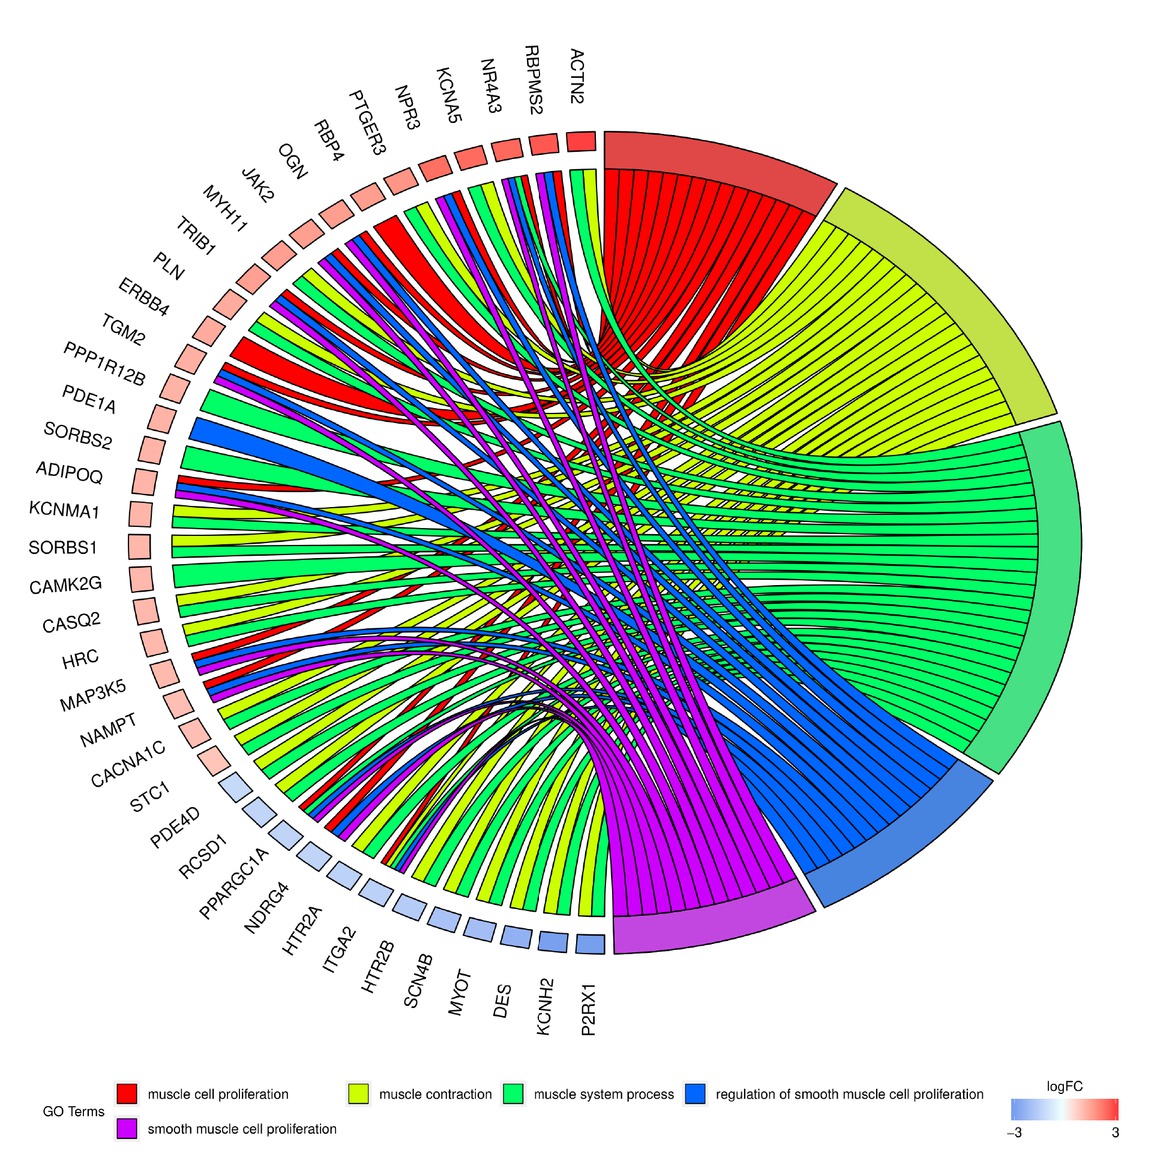
Figure 4
Analysis of enriched gene ontological groups involved in muscle system process. The network plot presenting the linkages of genes and GO BP terms

Figure 5
Heatmap presenting the relationship between genes and selected GO BP terms. The yellow color of tiles indicates the absence of logFC values
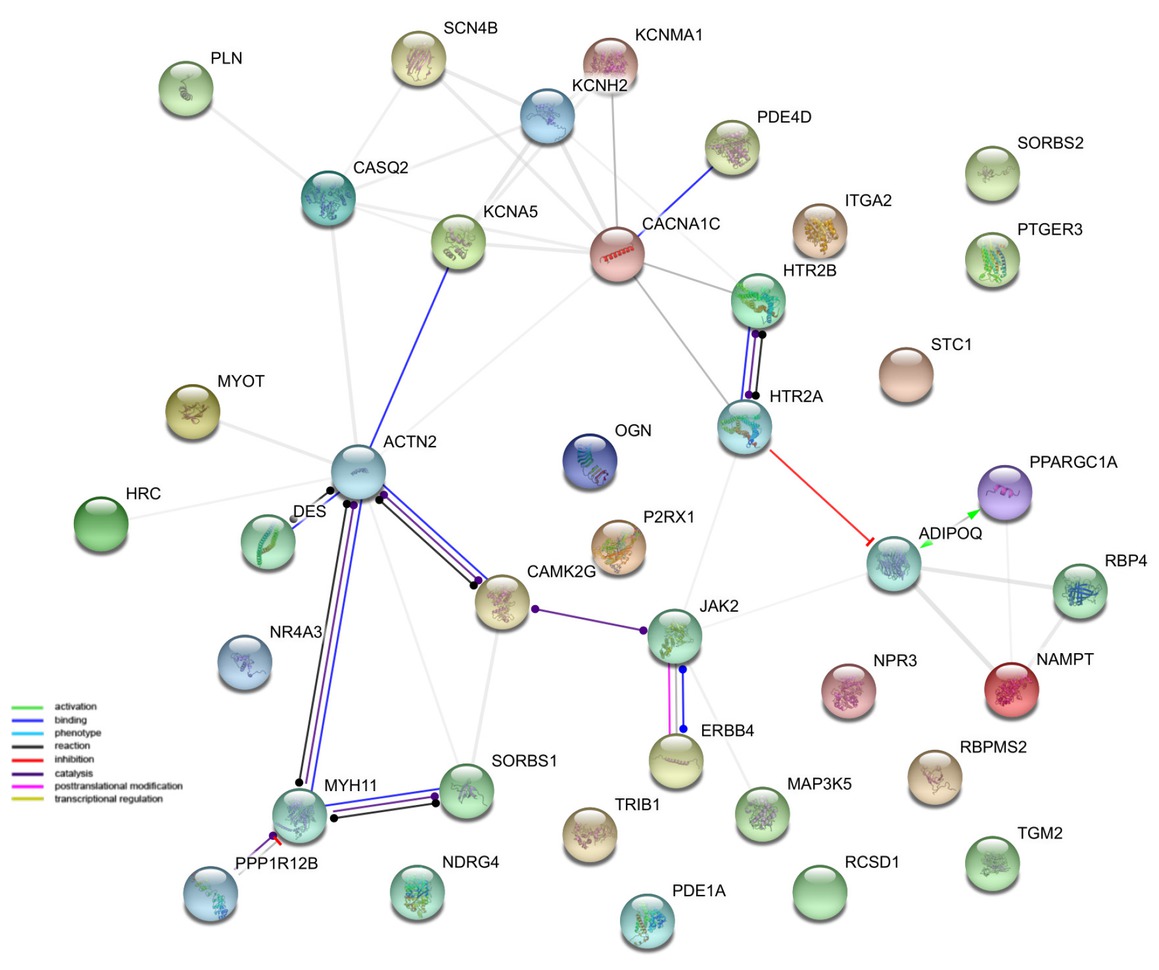
Figure 6
Interaction network of proteins encoded by DEGs belonging to “muscle cell proliferation”, “muscle contraction”, “muscle system process”, “regulation of smooth muscle cell proliferation” and “smooth muscle cell proliferation” GO BP terms. The network was generated by STRING software. Network nodes represent proteins, while empty nodes indicate proteins of unknown 3D structure
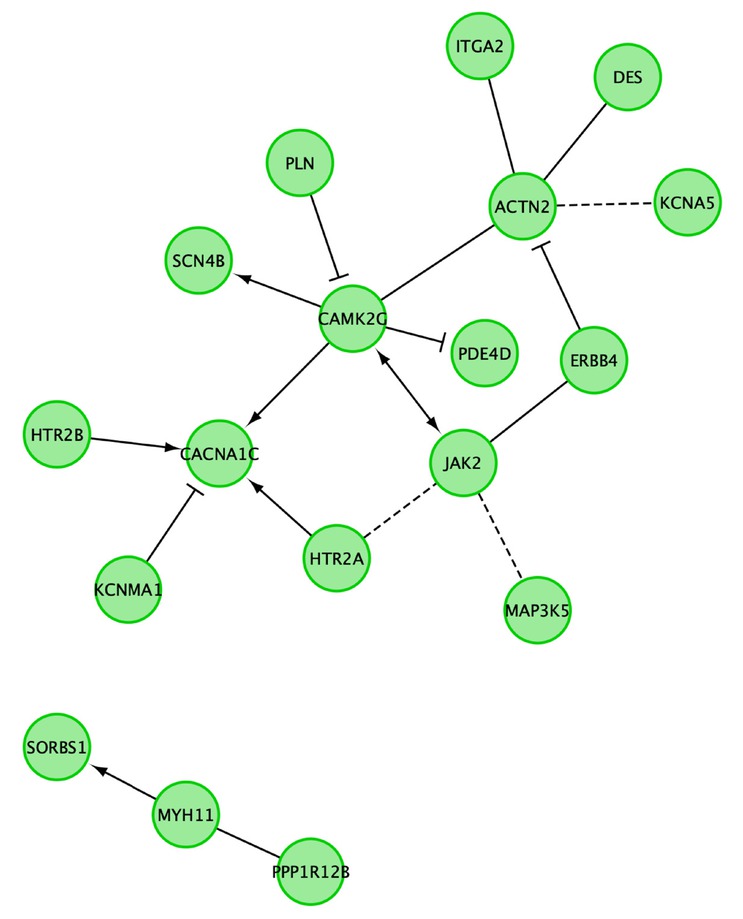
Figure 7
Reactome FI networks between differentially expressed genes belonging to the “muscle cell proliferation”, “muscle contraction”, “muscle system process”, “regulation of smooth muscle cell proliferation” and “smooth muscle cell proliferation” GO BP terms. “--->” indicates activating/catalyzing, “-|” for inhibition, “-“ FIs extracted from complexes or inputs and “---” predicted FIs
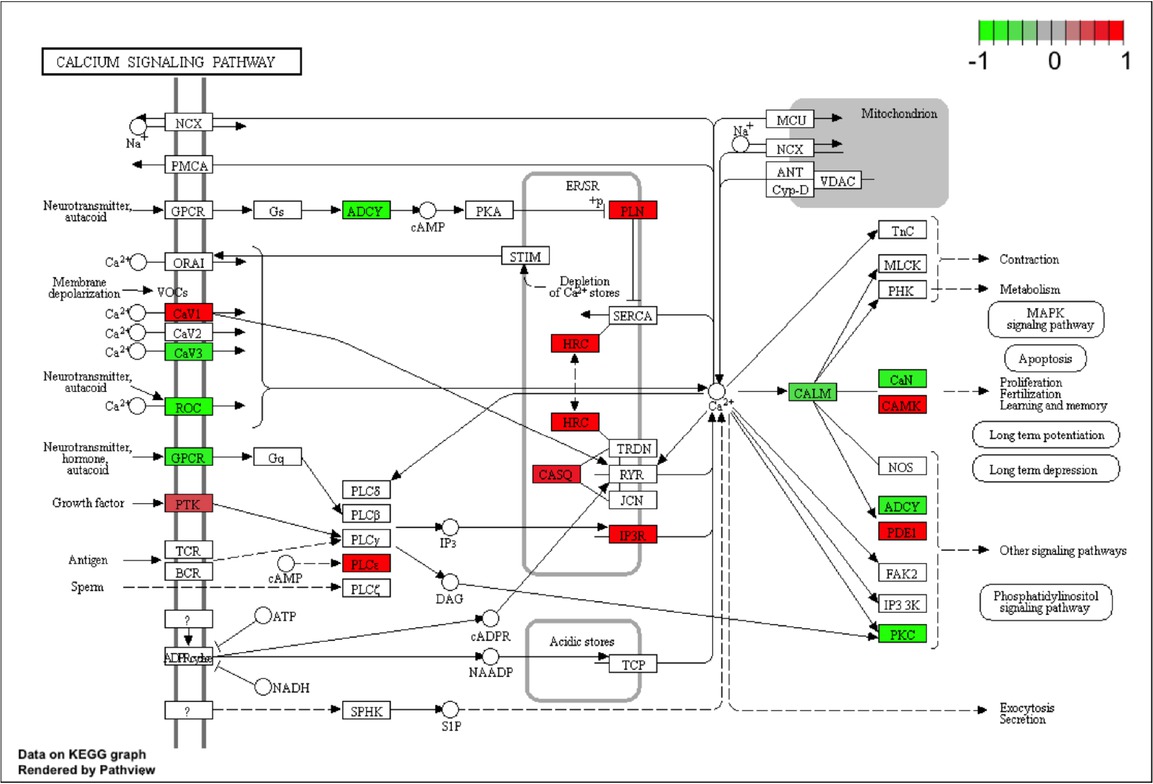
Figure 8
Pathway graph of “calcium signaling pathway” based on KEGG database. The red color indicates parts of the pathway that are upregulated in internal thoracic artery conduit while the green color represents components upregulated in saphenous vein conduit