
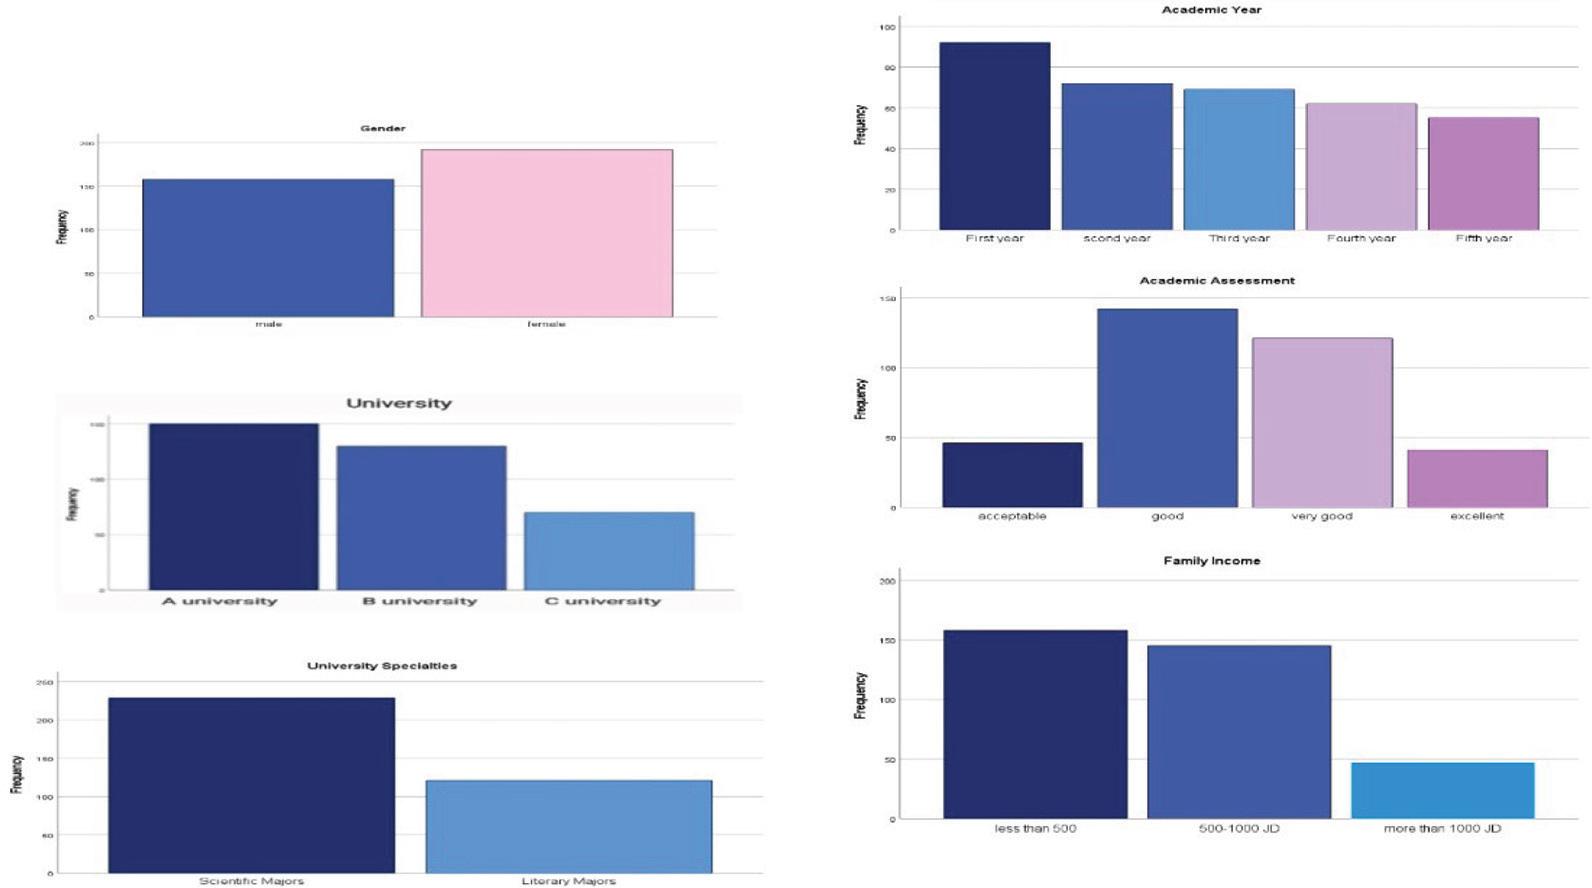
Figure 1.
Summary of the selected universities_
| University | Type of university | Number of colleges | Number of students |
|---|---|---|---|
| A | Public university | 10 colleges | Approximately 20,000 |
| B | Public university | 19 colleges | Approximately 24,314 |
| C | Private university | 14 colleges | Approximately 8000 |
Post comparisons test using the setting method according to the variable of the academic year to measure bullying among university students in Jordan_
| Dependent variable | Academic year (I) | Academic year (J) | Mean difference (I–J) | P |
|---|---|---|---|---|
| Bullying among university students | Third year | First year | 0.562* | 0.018 |
| Fourth year | First year | 0.604* | 0.011 |
Sociodemographic predictors of bullying among university students in Jordan_
| Model | Unstandardized coefficients | Standardized coefficients | t | P | Collinearity statistics | ||
|---|---|---|---|---|---|---|---|
| B | Std. error | Beta | Tolerance | VIF | |||
| Gender | −0.201 | 0.112 | −0.097 | −1.793 | 0.074 | 0.915 | 1.093 |
| Age (years) | 0.01 | 0.048 | 0.018 | 0.218 | 0.827 | 0.413 | 2.423 |
| University | −0.403 | 0.087 | −0.296 | −4.613 | 0.001 | 0.647 | 1.546 |
| Academic major | 0.083 | 0.119 | 0.038 | 0.698 | 0.486 | 0.889 | 1.124 |
| Academic year | 0.213 | 0.064 | 0.292 | 3.35 | 0.001 | 0.351 | 2.85 |
| Family income | −0.054 | 0.077 | −0.037 | −0.703 | 0.482 | 0.984 | 1.016 |
| University grade | −0.014 | 0.063 | −0.012 | −0.224 | 0.823 | 0.96 | 1.041 |
Bullying prevalence_
| Variable | Minimum | Maximum | Mean | Std. deviation | Percentage (%) | Frequency | |
|---|---|---|---|---|---|---|---|
| 1. Have you been subjected to bullying at the university | 1.00 | 5.00 | 2.12 | 1.035 | Never | 30.0 | 105 |
| Rarely | 41.1 | 144 | |||||
| Sometimes | 20.0 | 70 | |||||
| Often | 4.3 | 15 | |||||
| Always | 4.6 | 16 |