
FIGURE 1.
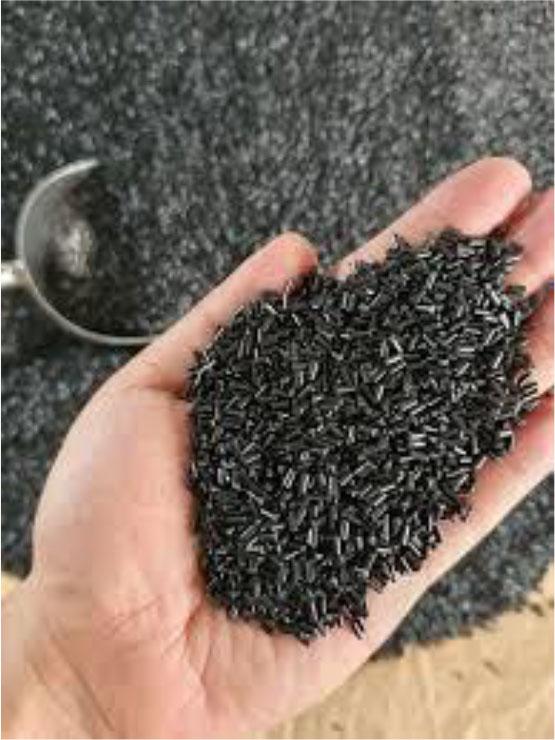
FIGURE 2.
FIGURE 3.
FIGURE 4.
FIGURE 5.

FIGURE 6.
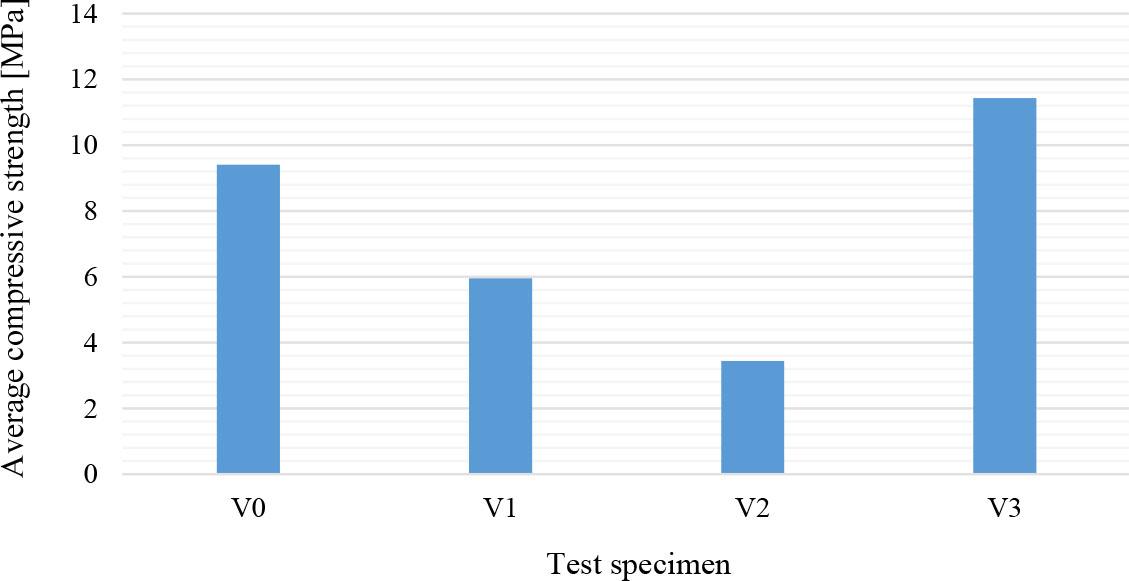
FIGURE 7.
Comparison of the compressive strength values from testing paving blocks
| Test | Normal | Compressive strength [MPa] | Innovation | Compressive strength [MPa] | Deviation [MPa] |
|---|---|---|---|---|---|
| 1 | V0 A | 10.69 | V1 A | 6.57 | ‒4.12 |
| 2 | V0 B | 10.21 | V1 B | 7.58 | ‒2.63 |
| 3 | V0 C | 7.33 | V1 C | 3.72 | ‒3.61 |
| 4 | V0 A | 10.69 | V2 A | 3.57 | ‒7.12 |
| 5 | V0 B | 10.21 | V2 B | 3.08 | ‒7.13 |
| 6 | V0 C | 7.33 | V2 C | 3.68 | ‒3.65 |
| 7 | V0 A | 10.69 | V3 A | 12.19 | +1.50 |
| 8 | V0 B | 10.21 | V3 B | 12.36 | +0.15 |
| 9 | V0 C | 7.33 | V3 C | 9.73 | +2.40 |
Physical properties of paving blocks
| Quality | Size [mm] | Compressive strength [MPa] | Wear resistance [mm·min−1] | Maximum average water absorption [%] | ||
|---|---|---|---|---|---|---|
| AVG | min | AVG | min | |||
| A | 210 × 105 × 50 | 40.0 | 35.0 | 0.090 | 0.103 | 3 |
| B | 210 × 105 × 50 | 20.0 | 17.0 | 0.130 | 0.149 | 6 |
| C | 210 × 105 × 50 | 15.0 | 12.5 | 0.160 | 0.184 | 8 |
| D | 210 × 105 × 50 | 10.0 | 8.5 | 0.219 | 0.251 | 10 |
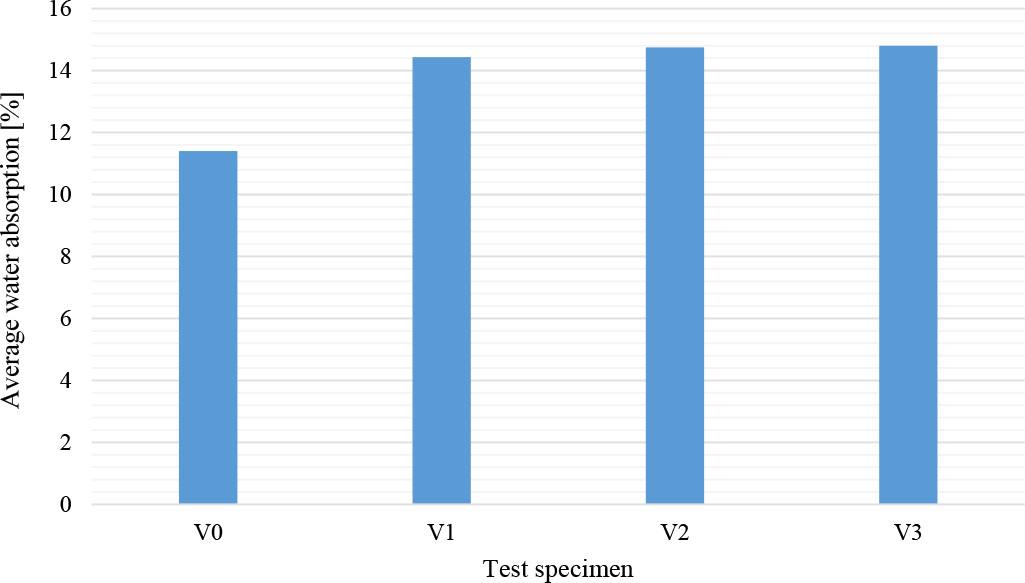
Summary of average water absorption test results for paving blocks
| Test specimen | Additional material | Average water absorption [%] | |
|---|---|---|---|
| Plastic pellets [%] | Red brick powder [%] | ||
| V0 A, V0 B, V0 C | 0 | 0 | 11.40 |
| V1 A, V1 B, V1 C | 10 | 25 | 14.43 |
| V2 A, V2 B, V2 C | 15 | 25 | 14.75 |
| V3 A, V3 B, V3 C | 25 | 25 | 14.80 |
Comparison of testing the water absorption value of paving blocks
| No | Normal | Water absorption [%] | Innovation | Water absorption [%] | Deviation [%] |
|---|---|---|---|---|---|
| 1 | V0 A | 11.70 | V1 A | 13.70 | ‒2.00 |
| 2 | V0 B | 11.34 | V1 B | 15.18 | ‒3.84 |
| 3 | V0 C | 11.18 | V1 C | 14.39 | ‒3.21 |
| 4 | V0 A | 11.70 | V2 A | 14.21 | ‒2.51 |
| 5 | V0 B | 11.34 | V2 B | 13.66 | ‒2.32 |
| 6 | V0 C | 11.18 | V2 C | 16.38 | ‒5.20 |
| 7 | V0 A | 11.70 | V3 A | 14.48 | ‒2.78 |
| 8 | V0 B | 11.34 | V3 B | 15.14 | ‒3.80 |
| 9 | V0 C | 11.18 | V3 C | 14.76 | ‒3.58 |
Summary of test results for the optimal average water absorption capacity of paving blocks
| Test object | Additional material | Average compressive strength [MPa] | |
|---|---|---|---|
| Plastic pellets [%] | Red brick powder [%] | ||
| 1 | 0 | 0 | 9.41 |
| 4 | 25 | 25 | 11.43 |
Content weight test results
| Material | Aggregate weight [g] | Container volume [cm3] | Unit weight [g·cm−3] |
|---|---|---|---|
| Sand | 1 090 | 0.001 | 1.09 |
| Red brick powder | 1 060 | 0.001 | 1.06 |
| Plastic pellets | 540 | 0.001 | 0.54 |
A summary of test results for average compressive strength values of paving blocks
| Test specimen | Additional material | Average compressive strength [MPa] | |
|---|---|---|---|
| Plastic pellets [%] | Red brick powder [%] | ||
| V0 A, V0 B, V0 C | 0 | 0 | 9.41 |
| V1 A, V1 B, V1 C | 10 | 25 | 5.95 |
| V2 A, V2 B, V2 C | 15 | 25 | 3.44 |
| V3 A, V3 B, V3 C | 25 | 25 | 11.43 |