
FIGURE 1.
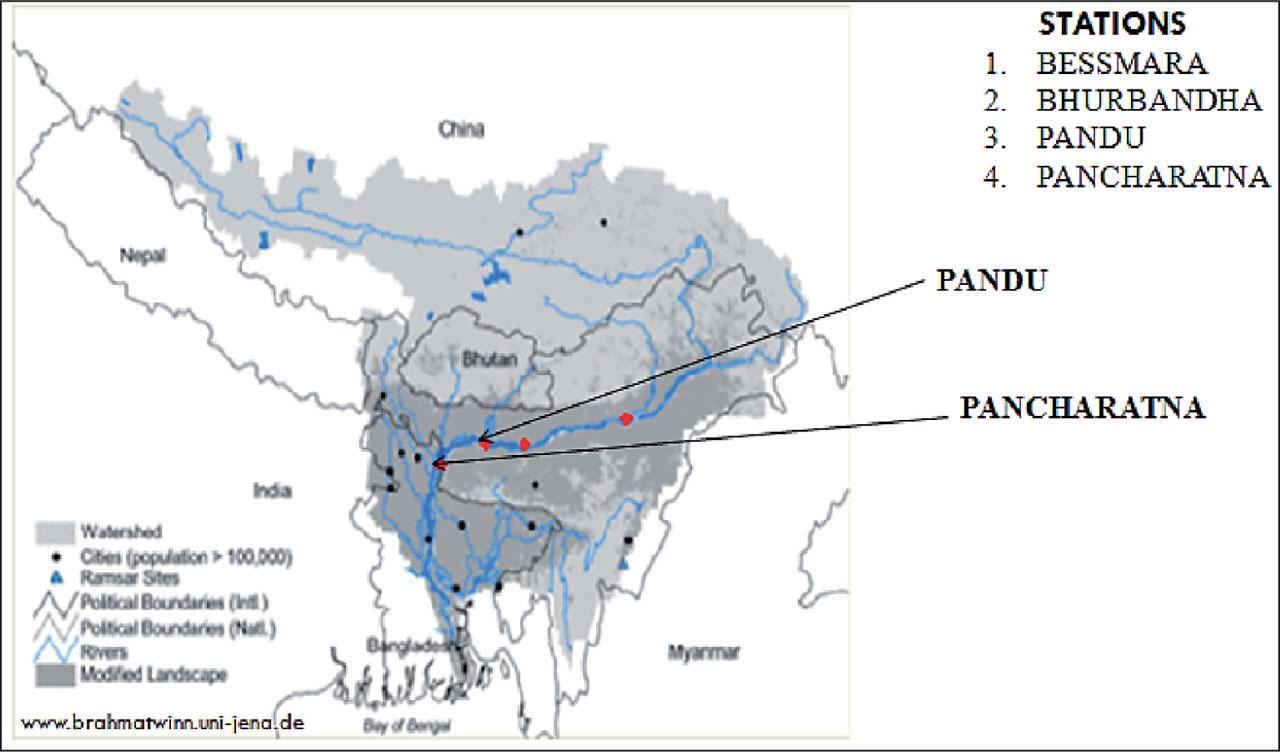
FIGURE 2.

FIGURE 3.

FIGURE 4.

FIGURE 5.

FIGURE 6.
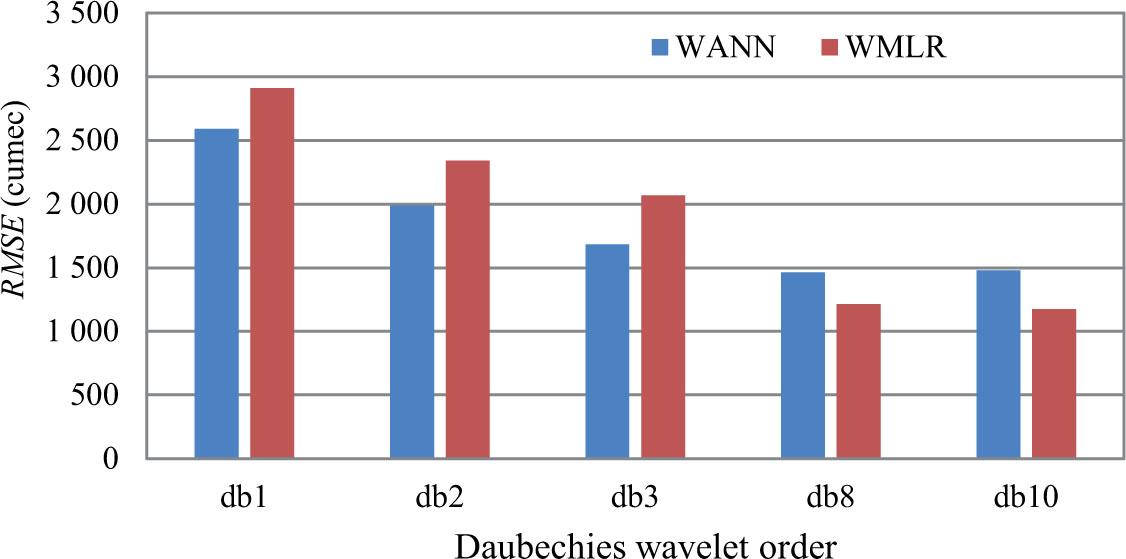
FIGURE 7.

FIGURE 8.
FIGURE 9.
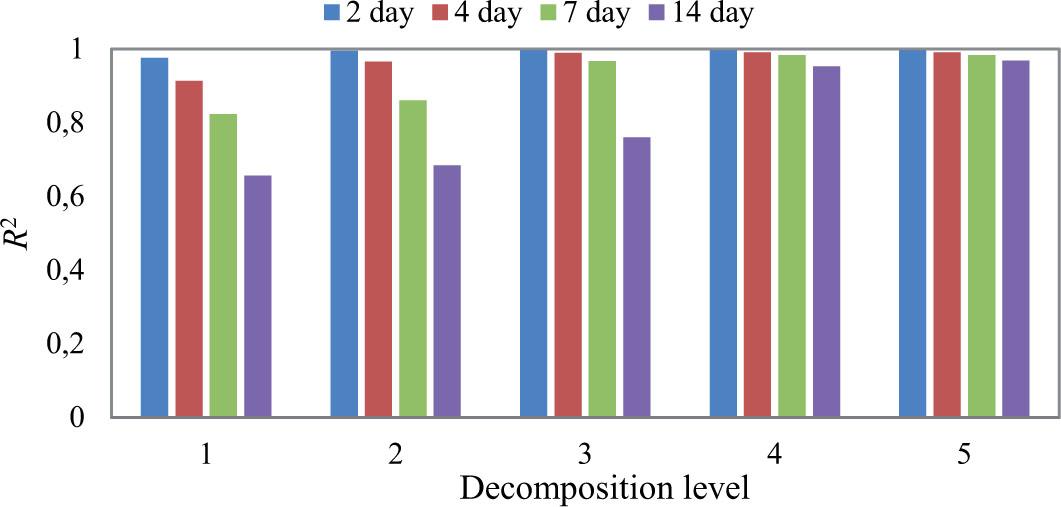
FIGURE 10.
Correlation coefficients for the flow series
| Output* (Qt+n) | Input (Qt−j)* | |||||||||
|---|---|---|---|---|---|---|---|---|---|---|
| Qt | Qt−1 | Qt−2 | Qt−3 | Qt−4 | Qt−5 | Qt−6 | Qt−7 | Qt−8 | Qt−9 | |
| Qt+2 | 0.983 | 0.971 | 0.957 | 0.942 | 0.929 | 0.915 | 0.903 | 0.891 | 0.880 | 0.871 |
| Qt+4 | 0.957 | 0.942 | 0.928 | 0.915 | 0.902 | 0.891 | 0.880 | 0.870 | 0.862 | 0.854 |
| Qt+7 | 0.915 | 0.902 | 0.891 | 0.880 | 0.870 | 0.862 | 0.854 | 0.846 | 0.839 | 0.832 |
| Qt+14 | 0.846 | 0.839 | 0.832 | 0.825 | 0.818 | 0.812 | 0.805 | 0.799 | 0.792 | 0.784 |
Values of statistical parameters for 14-day lead time
| Model type | Training period | Testing period | Optimum ANN structure | ||||||||
|---|---|---|---|---|---|---|---|---|---|---|---|
| RMSE | R2 | MAE | BIAS | SI | RMSE | R2 | MAE | BIAS | SI | ||
| ANN | 5 704.97 | 0.765 | 4 035.67 | 1.014 | 0.353 | 7 084.21 | 0.673 | 5 116.37 | 1.068 | 0.433 | 4-2-1 |
| MLR | 4 584.37 | 0.848 | 3 204.37 | 1.000 | 0.283 | 5 415.77 | 0.809 | 3 630.94 | 0.999 | 0.333 | – |
| WANN-db1l5 | 4 173.09 | 0.874 | 2 765.27 | 1.007 | 0.258 | 4 913.55 | 0.843 | 3 425.92 | 1.036 | 0.300 | 24-4-1 |
| WMLR-db1l5 | 4 761.19 | 0.836 | 3 215.26 | 1.000 | 0.294 | 6 050.48 | 0.762 | 3 886.88 | 0.999 | 0.371 | – |
| WANN-db2l5 | 3 071.96 | 0.932 | 2 062.78 | 1.004 | 0.190 | 4 716.30 | 0.855 | 3 017.38 | 1.038 | 0.288 | 24-3-1 |
| WMLR-db2l5 | 4 037.44 | 0.882 | 2 571.67 | 1.000 | 0.249 | 4 876.84 | 0.845 | 3 109.41 | 0.999 | 0.299 | – |
| WANN-db3l5 | 2 420.95 | 0.958 | 1 737.07 | 1.014 | 0.149 | 3 848.56 | 0.904 | 2 663.88 | 1.031 | 0.235 | 24-2-1 |
| WMLR-db3l5 | 3 172.17 | 0.927 | 2 083.46 | 1.000 | 0.196 | 4 770.31 | 0.852 | 2 694.26 | 0.999 | 0.292 | –– |
| WANN-db8l5 | 1 922.74 | 0.973 | 1 353.08 | 1.012 | 0.119 | 3 746.15 | 0.908 | 2 190.53 | 1.020 | 0.229 | 24-2-1 |
| WMLR-db8l5 | 1 985.33 | 0.971 | 1 325.19 | 1.000 | 0.123 | 2 612.09 | 0.955 | 1 731.46 | 0.999 | 0.160 | – |
| WANN-db10l5 | 2 225.74 | 0.964 | 1 600.63 | 0.995 | 0.138 | 3 539.60 | 0.918 | 2 287.83 | 0.986 | 0.217 | 24-3-1 |
| WMLR-db10l5 | 1 670.31 | 0.979 | 1 137.67 | 1.000 | 0.103 | 2 196.46 | 0.968 | 1 435.57 | 1.000 | 0.134 | – |
Values of statistical parameters for seven-day lead time
| Model type | Training period | Testing period | Optimum ANN structure | ||||||||
|---|---|---|---|---|---|---|---|---|---|---|---|
| RMSE | R2 | MAE | BIAS | SI | RMSE | R2 | MAE | BIAS | SI | ||
| ANN | 4 308.72 | 0.866 | 2 801.05 | 1.002 | 0.266 | 5 185.33 | 0.825 | 3 441.99 | 1.032 | 0.318 | 4-3-1 |
| MLR | 4 490.92 | 0.854 | 2 986.84 | 1.000 | 0.277 | 5 376.87 | 0.811 | 3 429.75 | 0.999 | 0.331 | – |
| WANN-db1l5 | 2 830.19 | 0.942 | 1 961.30 | 1.004 | 0.175 | 4 131.69 | 0.889 | 2 942.38 | 1.016 | 0.254 | 24-3-1 |
| WMLR-db1l5 | 3 122.62 | 0.929 | 1 942.73 | 1.000 | 0.193 | 4 123.65 | 0.889 | 2 415.44 | 0.999 | 0.254 | – |
| WANNdb2l5 | 2 038.56 | 0.970 | 1 408.02 | 1.004 | 0.126 | 2 894.02 | 0.945 | 1 927.13 | 1.024 | 0.178 | 24-2-1 |
| WMLR-db2l5 | 2 623.55 | 0.950 | 1 617.63 | 1.000 | 0.162 | 3 193.40 | 0.933 | 1 937.76 | 0.999 | 0.196 | – |
| WANN-db3l5 | 1 683.52 | 0.979 | 1 151.42 | 1.003 | 0.104 | 2 525.32 | 0.958 | 1 639.74 | 1.013 | 0.155 | 24-3-1 |
| WMLR-db3l5 | 2 129.55 | 0.967 | 1 336.34 | 1.000 | 0.132 | 2 987.57 | 0.942 | 1 640.06 | 0.999 | 0.184 | – |
| WANN-db8l5 | 1 313.63 | 0.987 | 871.91 | 0.999 | 0.081 | 2 038.33 | 0.973 | 1 233.97 | 0.997 | 0.125 | 24-2-1 |
| WMLR-db8l5 | 1 318.74 | 0.987 | 837.08 | 1.000 | 0.082 | 1 702.96 | 0.981 | 1 042.41 | 0.999 | 0.105 | – |
| WANN-db10l5 | 1 187.51 | 0.989 | 792.06 | 0.999 | 0.073 | 1 929.58 | 0.975 | 1 060.01 | 1.005 | 0.119 | 24-2-1 |
| WMLR-db10l5 | 1 167.65 | 0.990 | 733.49 | 1.000 | 0.072 | 1 585.02 | 0.984 | 881.76 | 1.000 | 0.097 | – |
Values of statistical parameters for two-day lead time
| Model type | Training period | Testing period | Optimum ANN structure | ||||||||
|---|---|---|---|---|---|---|---|---|---|---|---|
| RMSE | R2 | MAE | BIAS | SI | RMSE | R2 | MAE | BIAS | SI | – | |
| ANN | 1 764.66 | 0.977 | 1 044.28 | 1.002 | 0.109 | 2 463.33 | 0.960 | 1 401.83 | 1.014 | 0.152 | 2-8-1 |
| MLR | 1 828.26 | 0.976 | 1 058.12 | 1.000 | 0.113 | 2 535.96 | 0.958 | 1 293.19 | 1.000 | 0.156 | – |
| WANN-db1l5 | 1 199.43 | 0.989 | 757.47 | 1.008 | 0.074 | 1 795.99 | 0.979 | 1 144.51 | 1.018 | 0.110 | 12-2-1 |
| WMLR-db1l5 | 1 228.25 | 0.989 | 680.19 | 1.000 | 0.076 | 1 758.64 | 0.980 | 913.41 | 1.000 | 0.109 | – |
| WANN-db2l4 | 960.30 | 0.993 | 540.14 | 1.001 | 0.059 | 1 415.36 | 0.987 | 796.43 | 1.007 | 0.087 | 10-2-1 |
| WMLR-db2l5 | 1 093.66 | 0.991 | 595.74 | 1.000 | 0.068 | 1 478.74 | 0.986 | 769.43 | 0.999 | 0.091 | – |
| WANN-db3l4 | 813.84 | 0.995 | 469.56 | 1.001 | 0.050 | 1 202.33 | 0.990 | 698.70 | 1.007 | 0.074 | 10-3-1 |
| WMLR-db3l5 | 909.81 | 0.994 | 510.23 | 1.000 | 0.056 | 1 311.38 | 0.989 | 629.76 | 0.999 | 0.081 | – |
| WANN-db8l5 | 553.07 | 0.998 | 368.93 | 1.000 | 0.034 | 1 054.10 | 0.992 | 543.92 | 1.000 | 0.065 | 12-2-1 |
| WMLR-db8l5 | 526.83 | 0.998 | 296.78 | 1.000 | 0.033 | 775.11 | 0.996 | 406.20 | 0.999 | 0.048 | – |
| WANN-db10l5 | 481.40 | 0.998 | 298.51 | 0.999 | 0.030 | 933.06 | 0.994 | 436.49 | 0.999 | 0.057 | 12-2-1 |
| WMLR-db10l5 | 471.99 | 0.998 | 261.79 | 1.000 | 0.029 | 751.87 | 0.996 | 369.69 | 1.000 | 0.046 | – |
Statistical properties of flow data
| Statistical parameter | Training | Testing | All |
|---|---|---|---|
| Qmean [m3·s−1] | 16 159 | 16 236 | 16 161 |
| Qmax [m3·s−1] | 59 832 | 76 236 | 76 236 |
| Qmin [m3·s−1] | 2 628 | 1 723 | 1 723 |
| Sd [m3·s−1] | 11 783 | 12 388 | 11 965 |
| Cx | 0.726 | 0.968 | 0.809 |
Optimal input combination
| Lead time [day] | Input parameter* | Output parameter** Q(t+n) |
|---|---|---|
| 2 | Qt, Q(t−1) | Q(t+2) |
| 4 | Qt, Q(t−1), Q(t−2), Q(t−3) | Q(t+4) |
| 7 | Qt, Q(t−1), Q(t−2), Q(t−3) | Q(t+7) |
| 14 | Qt, Q(t−1), Q(t−2), Q(t−3) | Q(t+14) |
Effect of decomposition level on determination coefficient (R2) for WMLR-db10 model (testing period)
| Two-day lead time | Four-day lead time | Seven-day lead time | 14-day lead time | ||||
|---|---|---|---|---|---|---|---|
| Model type | R2 | Model type | R2 | Model type | R2 | Model type | R2 |
| WMLR-db10l1 | 0.976 | WMLR-db10l1 | 0.914 | WMLR-db10l1 | 0.824 | WMLR-db10l1 | 0.656 |
| WMLR-db10l2 | 0.995 | WMLR-db10l2 | 0.966 | WMLR-db10l2 | 0.861 | WMLR-db10l2 | 0.684 |
| WMLR-db10l3 | 0.996 | WMLR-db10l3 | 0.990 | WMLR-db10l3 | 0.967 | WMLR-db10l3 | 0.760 |
| WMLR-db10l4 | 0.996 | WMLR-db10l4 | 0.991 | WMLR-db10l4 | 0.983 | WMLR-db10l4 | 0.953 |
| WMLR-db10l5 | 0.996 | WMLR-db10l5 | 0.991 | WMLR-db10l5 | 0.984 | WMLR-db10l5 | 0.968 |
Values of statistical parameters for four-day lead time
| Model type | Training period | Testing period | Optimum ANN structure | ||||||||
|---|---|---|---|---|---|---|---|---|---|---|---|
| RMSE | R2 | MAE | BIAS | SI | RMSE | R2 | MAE | BIAS | SI | ||
| ANN | 3 133.09 | 0.929 | 2 067.41 | 1.005 | 0.194 | 3 890.35 | 0.901 | 2 566.07 | 1.031 | 0.239 | 4-8-1 |
| MLR | 3 136.83 | 0.929 | 1 988.84 | 1.000 | 0.194 | 3 932.06 | 0.899 | 2 274.72 | 1.000 | 0.243 | – |
| WANN-db1l5 | 1 918.22 | 0.973 | 1 229.16 | 1.008 | 0.118 | 2 590.84 | 0.956 | 1 717.58 | 1.018 | 0.159 | 24-3-1 |
| WMLR-db1l5 | 2 088.67 | 0.968 | 1 268.59 | 1.000 | 0.129 | 2 909.44 | 0.945 | 1 618.86 | 1.000 | 0.179 | – |
| WANN-db2l5 | 1 431.04 | 0.985 | 868.66 | 1.001 | 0.088 | 1 986.38 | 0.974 | 1 137.20 | 1.009 | 0.122 | 24-2-1 |
| WMLR-db2l4 | 1 922.49 | 0.973 | 1 160.03 | 1.000 | 0.119 | 2 342.13 | 0.964 | 1 354.14 | 0.999 | 0.144 | – |
| WANN-db3l5 | 1 280.06 | 0.988 | 790.25 | 1.001 | 0.079 | 1 683.59 | 0.982 | 1 034.97 | 1.004 | 0.104 | 24-2-1 |
| WMLR-db3l5 | 1 528.75 | 0.983 | 924.38 | 1.000 | 0.094 | 2 067.67 | 0.972 | 1 084.63 | 0.999 | 0.127 | – |
| WANN-db8l4 | 962.64 | 0.993 | 601.76 | 1.001 | 0.059 | 1 465.35 | 0.986 | 774.11 | 1.000 | 0.090 | 20-2-1 |
| WMLR-db8l5 | 940.03 | 0.994 | 556.62 | 1.000 | 0.058 | 1 213.32 | 0.990 | 664.47 | 0.999 | 0.075 | – |
| WANN-db10l5 | 822.67 | 0.995 | 527.85 | 1.003 | 0.051 | 1 477.12 | 0.986 | 755.19 | 1.004 | 0.091 | 24-2-1 |
| WMLR-db10l5 | 785.37 | 0.995 | 460.22 | 1.000 | 0.048 | 1 174.80 | 0.991 | 612.69 | 1.000 | 0.072 | – |
Values of statistical parameters for WMLR(db10) model for monsoon season (June to September) in testing period
| Year | RMSE | R2 | MAE | BIAS | S.I. |
|---|---|---|---|---|---|
| Two-day lead time | |||||
| 1997 | 890.55 | 0.995 | 596.966 | 1.000 | 0.034 |
| 1998 | 1 448.88 | 0.995 | 767.802 | 0.999 | 0.042 |
| 1999 | 1 070.20 | 0.996 | 629.899 | 0.999 | 0.034 |
| Four-day lead time | |||||
| 1997 | 1 572.65 | 0.984 | 1 072.41 | 1.000 | 0.059 |
| 1998 | 2 188.39 | 0.989 | 1 153.71 | 0.999 | 0.063 |
| 1999 | 1514.68 | 0.992 | 968.89 | 0.998 | 0.048 |
| Seven-day lead time | |||||
| 1997 | 2 243.79 | 0.967 | 1 667.90 | 0.998 | 0.084 |
| 1998 | 2 971.27 | 0.980 | 1 677.60 | 1.001 | 0.086 |
| 1999 | 1 797.46 | 0.989 | 1 209.73 | 0.999 | 0.058 |
| 14-day lead time | |||||
| 1997 | 3 035.86 | 0.938 | 2 292.43 | 1.002 | 0.115 |
| 1998 | 3 722.21 | 0.967 | 2 295.27 | 1.006 | 0.111 |
| 1999 | 2 588.93 | 0.976 | 1 972.25 | 0.998 | 0.084 |
Percent improvement in RMSE with increase in wavelet order from db1 to db10
| Lead time [day] | Improvement in RMSE [%] |
|---|---|
| 2 | 57.25 |
| 4 | 54.66 |
| 7 | 61.56 |
| 14 | 55.30 |