

TABLE 1.
Composition of organic material and C : N ratio of each compost
| Pile | Compost composition | Weight (g/per test) [%] | Carbon (C) [%] | Nitrogen (N) [%] | C : N ratio [g] |
|---|---|---|---|---|---|
| A | (70 wt% mixed fruits and vegetables + + 30 wt% vegetable residues) | 180 | 48.5 (27%) | 1.3 (0.7%) | 37.3 |
| B | (50 wt% vegetable residues + 25 wt% eggshells + + 25 wt% mixed vegetables and fruits) | 180 | 46.2 (25.7%) | 1.4 (0.8%) | 33.0 |
| C | (50 wt% eggshell + 40 wt% vegetable residues + + 10 wt% mixed fruits and vegetables) | 180 | 47.4 (26.3%) | 1.5 (0.8%) | 31.6 |
| D | (70 wt% mixed fruits and vegetables + + 30 wt% vegetable residues) | 180 | 48.0 (26.7%) | 1.2 (0.7%) | 40.0 |
TABLE 2.
Comparison of Californian red worms and wild earthworms
| Indicator | Californian red worm (Eisenia fetida) | Wild earthworm (Lumbricus terrestris) |
|---|---|---|
| Life span | 10–16 years old | Up to 10 years old |
| Adapting to a new place | Relatively fast | Slowly getting used to the composter |
| Feed change | They cross with difficulty | At first, they refuse to eat |
| Types of feed | Any waste of plant origin | Waste found in the natural environment |
| Acceptable temperature | 0–40°C | 0–30°C |
| Assiduity | Good | Average |
| Reproduction | Every 5–7 days | For a long time, as in nature – 4–6 times a year, mainly in spring and early summer |
| Body length | 80–100 mm | 60–130 mm |
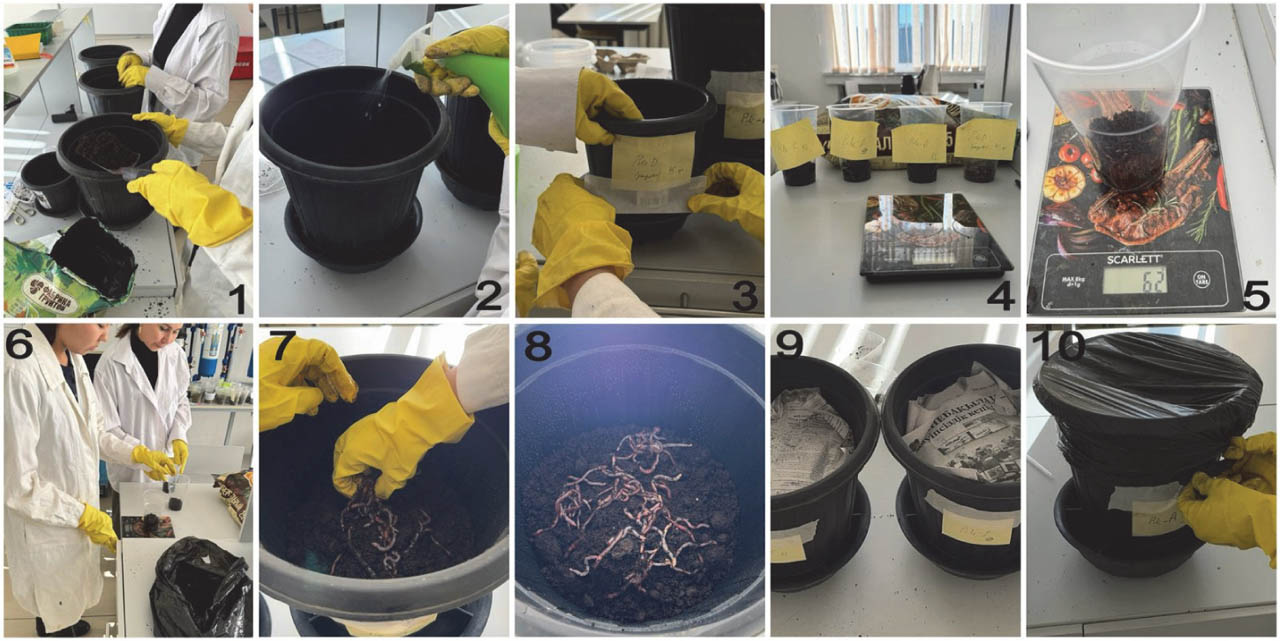
FIGURE 1.
Analysis of the final results of composting
Source: own work.
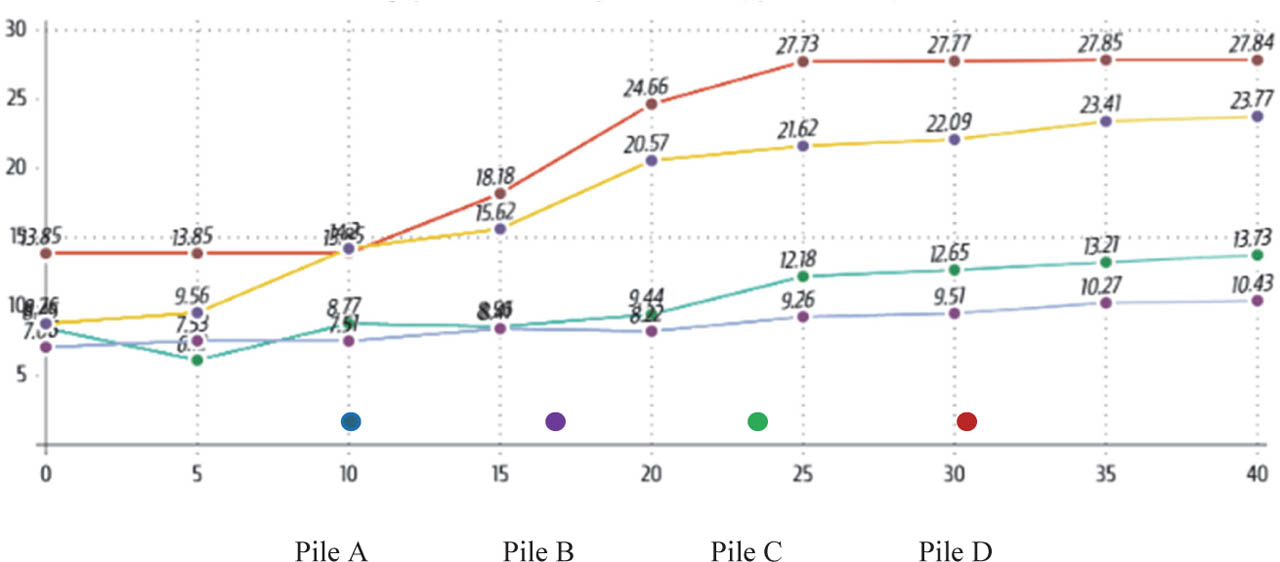
FIGURE 2.
The rate of decomposition of food waste in the nutrition of worms [g·day−2]
Source: own work.
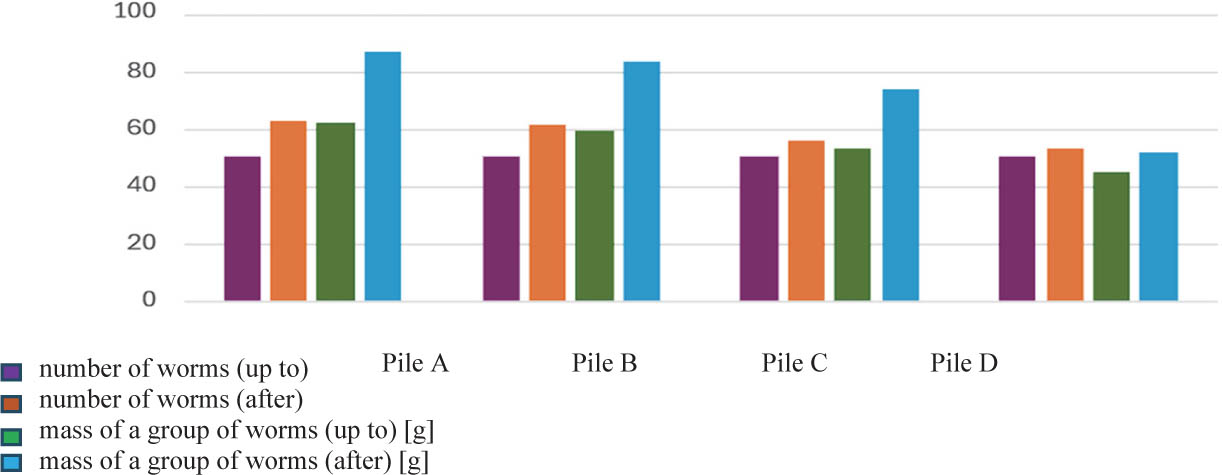
FIGURE 3.
Changes in the mass and number of worms during the study
Source: own work.
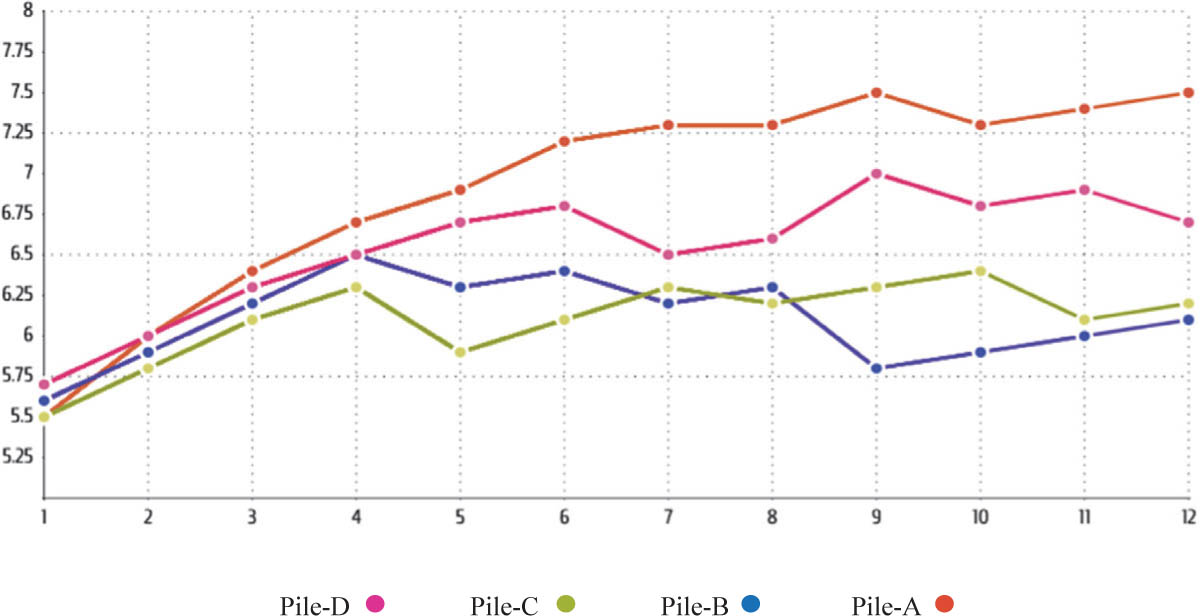
FIGURE 4.
Average pH profiles during the composting period
Source: own work.
TABLE 3.
Experimental data on the process of soil zooremediation
| Parameter | Description/Observation |
|---|---|
| Earthworm species used | California red worms and common earthworms |
| Interaction with soil | Each worm processes a soil mass approximately equal to its body weight per day |
| Experimental setup | Worm density: 30 individuals per 1 kg of soil. Average worm mass: 0.6–1.0 g |
| Estimated soil processing time | The selected worm species can pass 1 kg of soil through their digestive systems within 1.5–2.0 months |
| Time for complete soil mixing | Based on average body and gut diameter ratios (1 : 3 to 1 : 5), complete mixing of 1 kg of soil may occur within 1.5 to 2.5 weeks |
| Research objective | To compare the efficiency of soil mixing by earthworms under oil contamination conditions with that of mechanical technologies |
| Study location | Oil-contaminated areas of the Atyrau Region (Kazakhstan) |
| Level of oil contamination | Crude oil added at a concentration of 2.5 g·kg−2 – representing the upper threshold of low contamination levels |
| Worm introduction rate | 15 individuals per 1 kg of soil |
| Monitoring and measurements |
|
TABLE 4.
Level of decomposition of oil hydrocarbons
| Pollution level [%] | Type of worm | Total petroleum hydrocarbons primary [mg·kg−2] | After 90 days [mg·kg−2] | Decomposition percentage [%] |
|---|---|---|---|---|
| 0.5 | E. fetida | 5,000 | 1,200 | 76 |
| 0.5 | rainworm | 5,000 | 1,700 | 66 |
| 1.0 | E. fetida | 10,000 | 2,400 | 76 |
| 1.0 | Rainworm | 10,000 | 3,200 | 68 |
| 2.0 | E. fetida | 20,000 | 6,000 | 70 |
| 2.0 | rainworm | 20,000 | 7,800 | 61 |
TABLE 5.
Changes in biological and agrochemical parameters of the soil
| The indicator | Before and after | After (E. fetida) | After (L. terrestris) |
|---|---|---|---|
| Number of worms [pcs] | 50 | 62–65 | 52–55 |
| Biomass of worms [g] | 60–65 | 85–90 | 50–55 |
| Humus content [%] | 1.2–1.5 | 2.0–2.4 | 1.7–1.9 |
| Soil pH [-] | 5.6–5.8 | 6.8–7.2 | 6.5–6.9 |
| Level of biological activity | low | high | medium |