

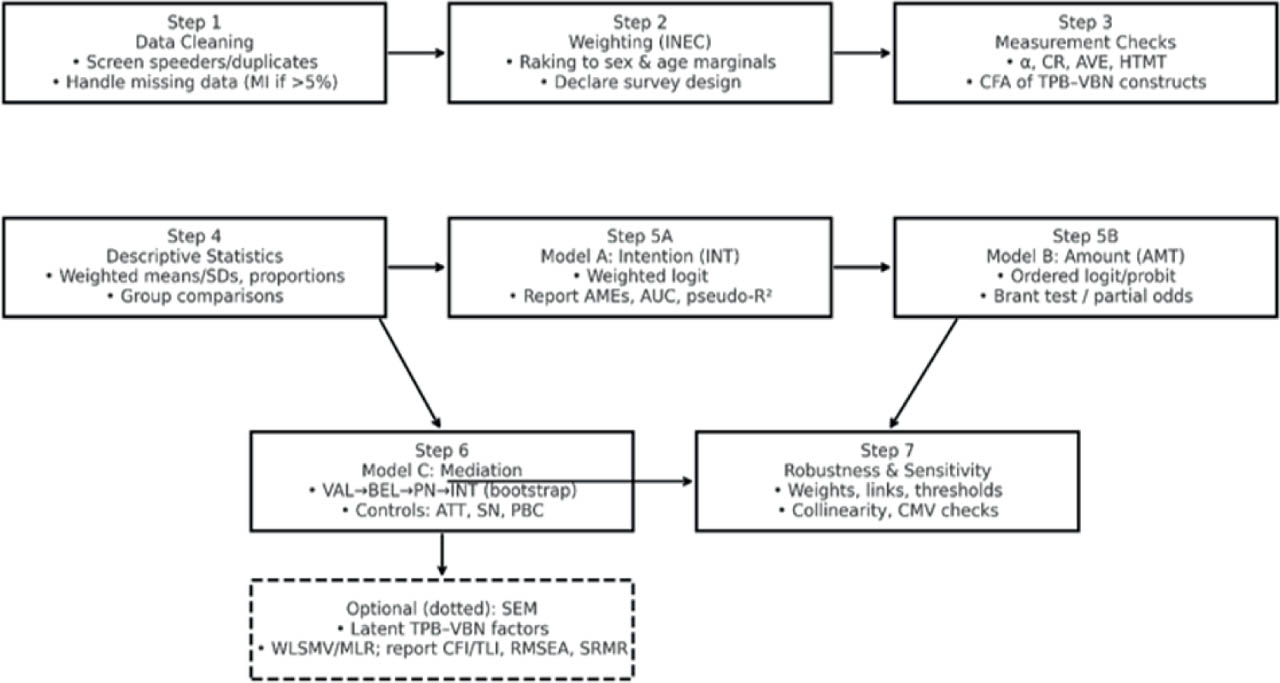
FIGURE 1.
Integrated TPB–VBN model of green bond investment intention. Solid arrows represent hypothesized direct effects (H1–H5); dotted arrows indicate exploratory credibility links (H6)
Source: own work.
TABLE 1.
Post-stratification marginals and raking weights (INEC targets versus assumed sample profile)
| Category | Target [%] (INEC, 2023) | Assumed sample [%] | Weight factor (target/sample) [-] |
|---|---|---|---|
| Sex | |||
| Male | 49.96 | 57.00 | 0.876 |
| Female | 50.04 | 43.00 | 1.164 |
| Age (adults 18+) | |||
| 18–35 | 38.62 | 55.00 | 0.702 |
| 36–64 | 47.35 | 38.00 | 1.246 |
| 65+ | 14.02 | 7.00 | 2.003 |
TABLE 2.
Construct operationalization and projected scale properties
| Construct | Example stems (seven-point Likert) | # items | Score | α | CR | AVE | Source |
|---|---|---|---|---|---|---|---|
| ATT | “Green bonds are a good idea/beneficial/fit my goals.” | 4 | Mean | 0.86 | 0.87 | 0.63 | Ajzen (1991) |
| SN | “Important others approve/expect me to invest.” | 4 | Mean | 0.82 | 0.84 | 0.57 | Ajzen (1991) |
| PBC | “I have knowledge/means; small tickets available.” | 4 | Mean | 0.81 | 0.83 | 0.55 | Ajzen (1991) |
| VAL | “Protecting nature guides my decisions.” | 4 | Mean | 0.85 | 0.87 | 0.60 | Dreifert and Rigotti (2025) |
| BEL | “My investments can help the environment.” (AC/AR) | 5 | Mean | 0.80 | 0.82 | 0.54 | Dreifert and Rigotti (2025) |
| PN | “I feel morally obliged to support green projects.” | 4 | Mean | 0.84 | 0.86 | 0.59 | Dreifert and Rigotti (2025) |
| CRED | “Certification/reporting makes me trust this bond.” | 4 | Mean | 0.83 | 0.85 | 0.58 | Ge et al. (2025) |
| LIT | Two quiz items + one self-efficacy item | 3 | Sum//Mean | 0.66 | 0.67 | × | × |
TABLE 3.
Variable descriptions, descriptive statistics, and hypothesized relationships
| Construct | Description/Coding | Mean (SD) or % | Hypothesis (Path) |
|---|---|---|---|
| INT_high | Intention to invest (1 if ≥5 on 1–7 scale) | 46% | Outcome (H1, H2, H3, H5) |
| AMT | Investment amount bracket (ordinal) | Median = 2–3 | Outcome (scale analysis) |
| ATT | Attitude (1–7 index) | 4.90 (1.10) | H1: ATT → INT |
| SN | Subjective norm (1–7 index) | 4.60 (1.20) | H2: SN → INT |
| PBC | Perceived behavioral control (1–7 index) | 4.30 (1.30) | H3: PBC → INT |
| VAL | Biospheric/Altruistic Values (1–7 index) | 5.20 (1.00) | H4: VAL → BEL → PN |
| BEL | Ecological beliefs (1–7 index) | 5.00 (1.10) | H4: VAL → BEL → PN |
| PN | Personal norm (1–7 index) | 4.70 (1.20) | H5: PN → INT |
| CRED | Credibility of green bond labels (1–7 index) | 4.10 (1.20) | H6: CRED → ATT/BEL → INT |
| LIT | Financial literacy (0–3) | 1.60 (0.90) | Control variable |
| EXP | Prior investing experience (1 = yes) | 49% | Control variable |
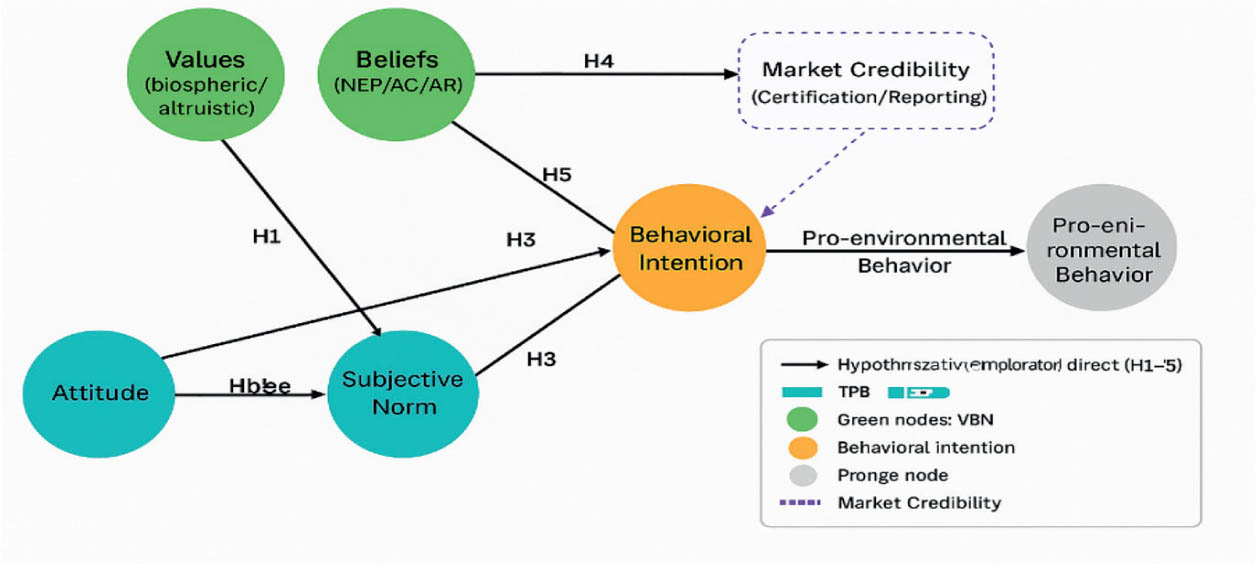
FIGURE 2.
Analysis workflow for testing TPB–VBN determinants of green-bond investment (Solid boxes denote required steps; dotted boxes denote optional SEM)
Source: own work based on survey responses.
TABLE 4.
Logistic regression predicting high intention (INT_high ≥ 5/7)
| Predictor | Odds ratio (OR) | SE | p-value |
|---|---|---|---|
| ATT | 1.84 | 0.31 | 0.002 |
| SN | 1.12 | 0.27 | 0.305 |
| PBC | 1.42 | 0.28 | 0.041 |
| VAL | 1.19 | 0.22 | 0.118 |
| BEL | 1.21 | 0.25 | 0.098 |
| PN | 2.02 | 0.36 | 0.001 |
TABLE 5.
Ordinal logistic regression predicting investment amount (AMT)
| Predictor | β | SE | p-value |
|---|---|---|---|
| ATT | 0.12 | 0.09 | 0.201 |
| PBC | 0.29 | 0.11 | 0.017 |
| PN | 0.08 | 0.07 | 0.281 |
TABLE 6.
Bootstrap mediation results (VAL → BEL → PN → INT_high)
TABLE 7.
SEM path coefficients and model fit
| Path | Std. β | p-value |
|---|---|---|
| ATT → INT | 0.33 | 0.001** |
| SN → INT | 0.08 | 0.212 |
| PBC → INT | 0.24 | 0.032* |
| VAL → BEL | 0.41 | 0.000** |
| BEL → PN | 0.37 | 0.002** |
| PN → INT | 0.39 | 0.000** |