

TABLE 1.
Water quality parameters pre- and post-treatment for aquaculture
| Parameter | Average raw wastewater | Average after biofiltration | Average after ultrafiltration | Aquaculture quality standard |
|---|---|---|---|---|
| BOD [mg·l−1] | 46.5 | 22.0 | 6.1 | <10 |
| COD [mg·l−1] | 130 | 68.2 | 19 | <50 |
| TSS [mg·l−1] | 120 | 36 | 3.4 | <10 |
| DO [mg·l−1] | 2.3 | 4.5 | 6.8 | >5 |
| pH [-] | 6.4 | 6.8 | 7.1 | 6.5–8.5 |
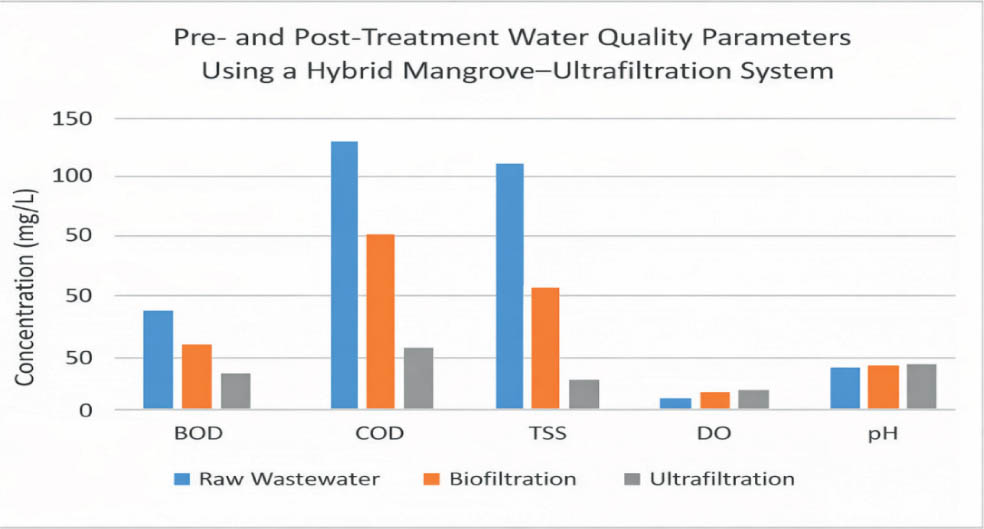
FIGURE 1.
Pre- and post-treatment water quality parameters using a hybrid mangrove-ultrafiltration system
Source: own work.
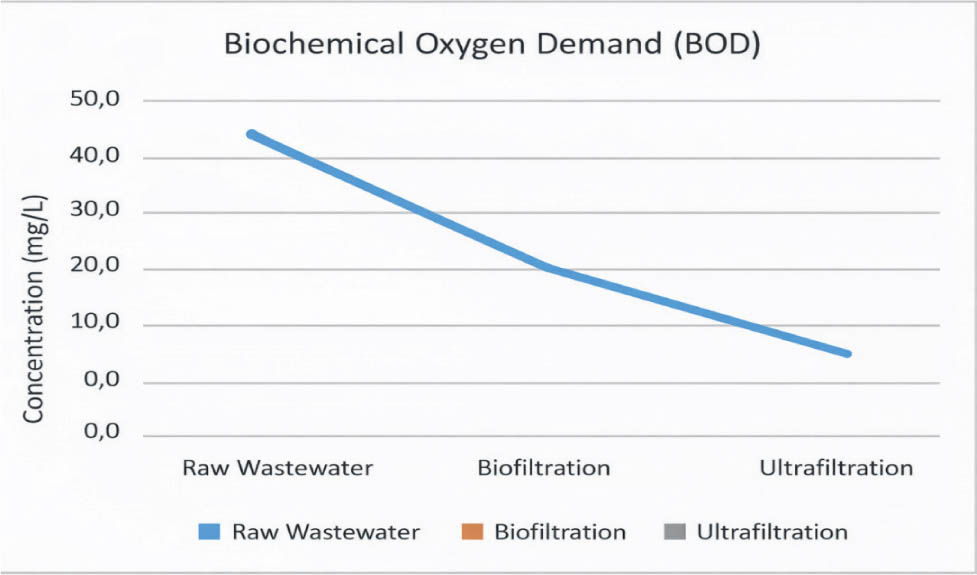
FIGURE 2.
Performance of biochemical oxygen demand reduction using mangrove-ultrafiltration system
Source: own work.
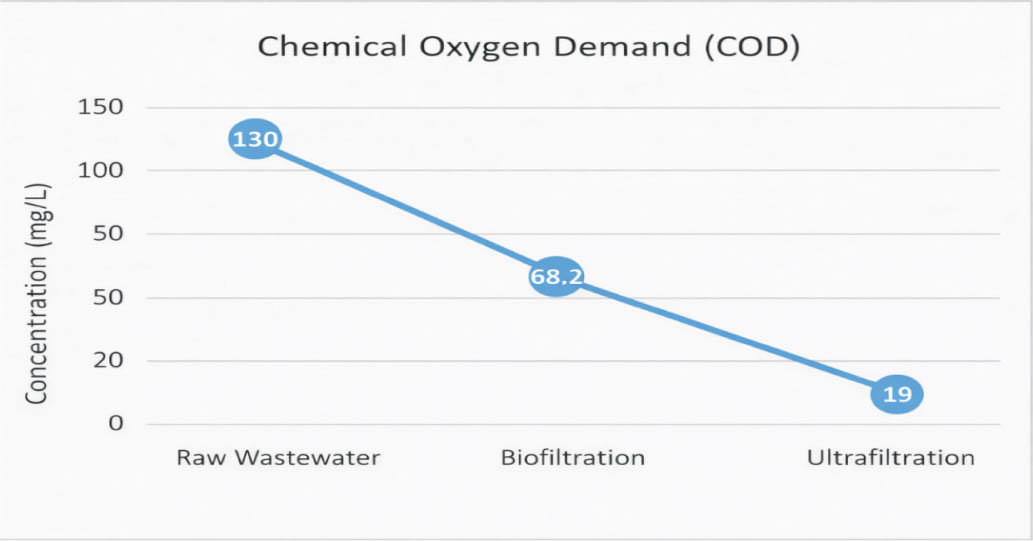
FIGURE 3.
Chemical oxygen demand reduction during biofiltration and ultrafiltration processes
Source: own work.
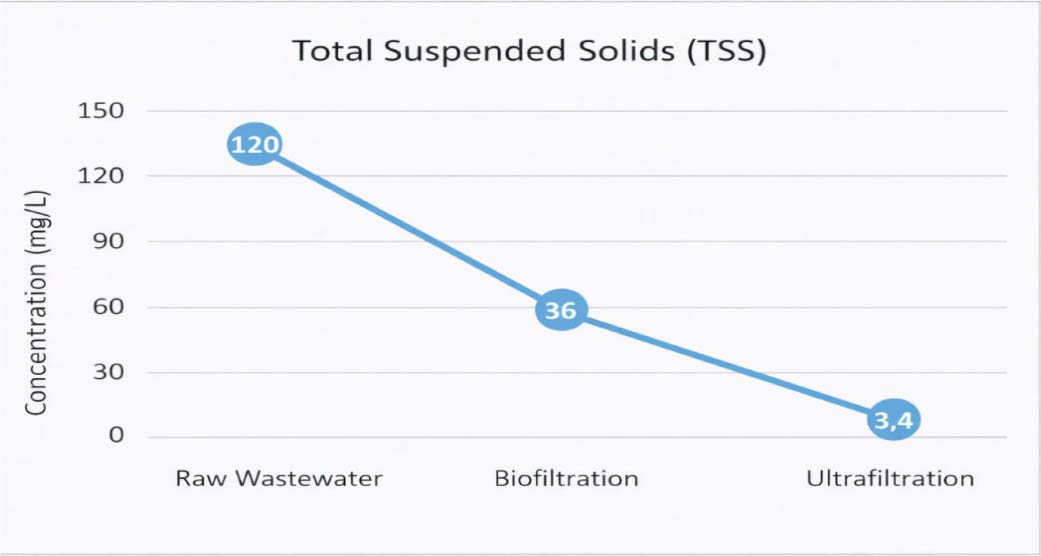
FIGURE 4.
Total suspended solids reduction during biofiltration and ultrafiltration processes
Source: own work.
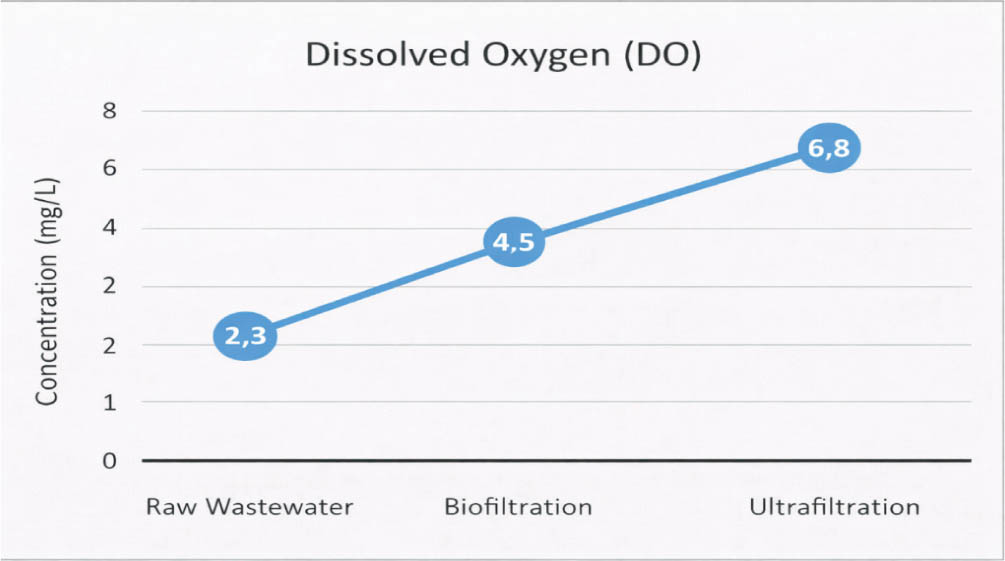
FIGURE 5.
Dissolved oxygen during biofiltration and ultrafiltration processes
Source: own work.
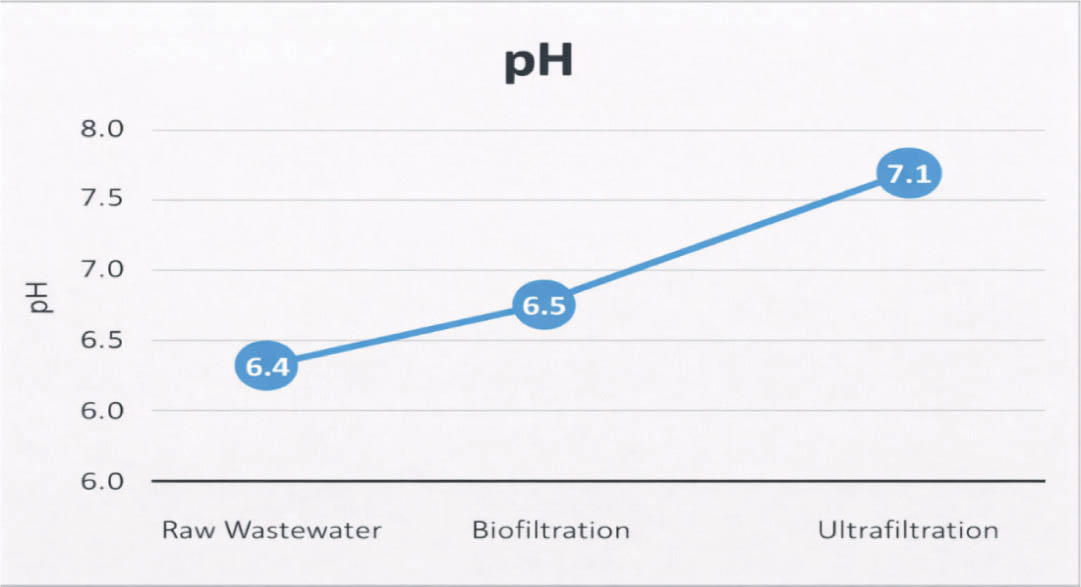
FIGURE 6.
Changes in pH at each stage of the treatment process
Source: own work.
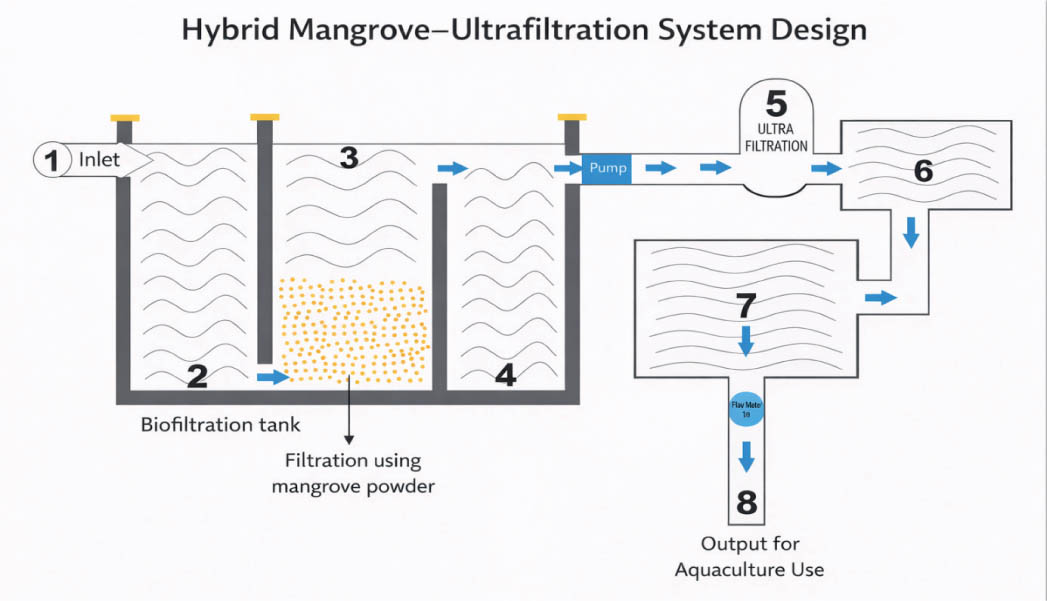
FIGURE 7.
Wastewater treatment design with mangroves and ultrafiltration
Source: own work.