
FIGURE 1.
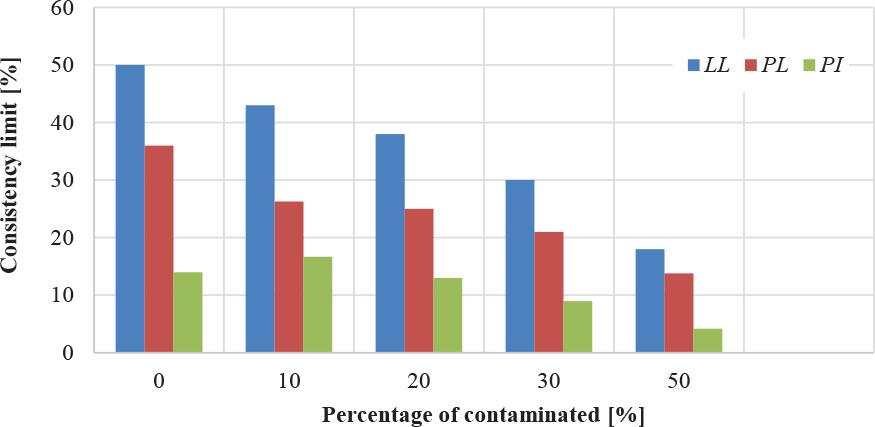
FIGURE 2.

FIGURE 3.
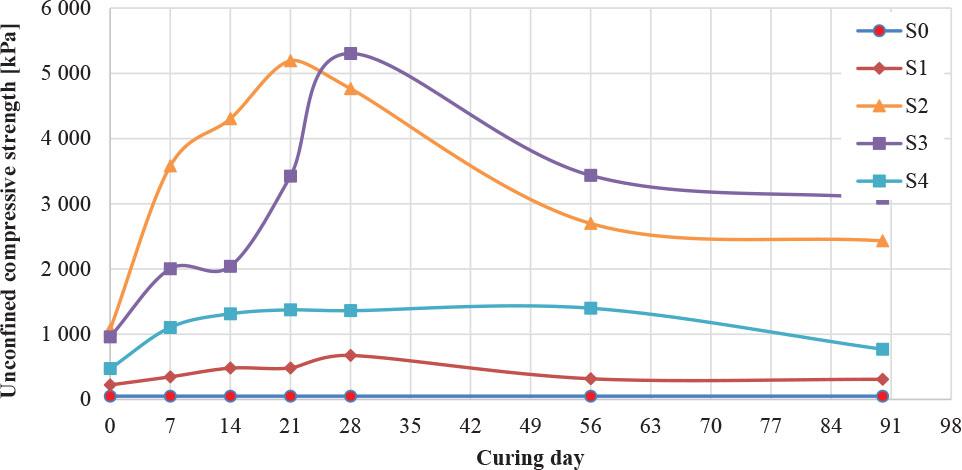
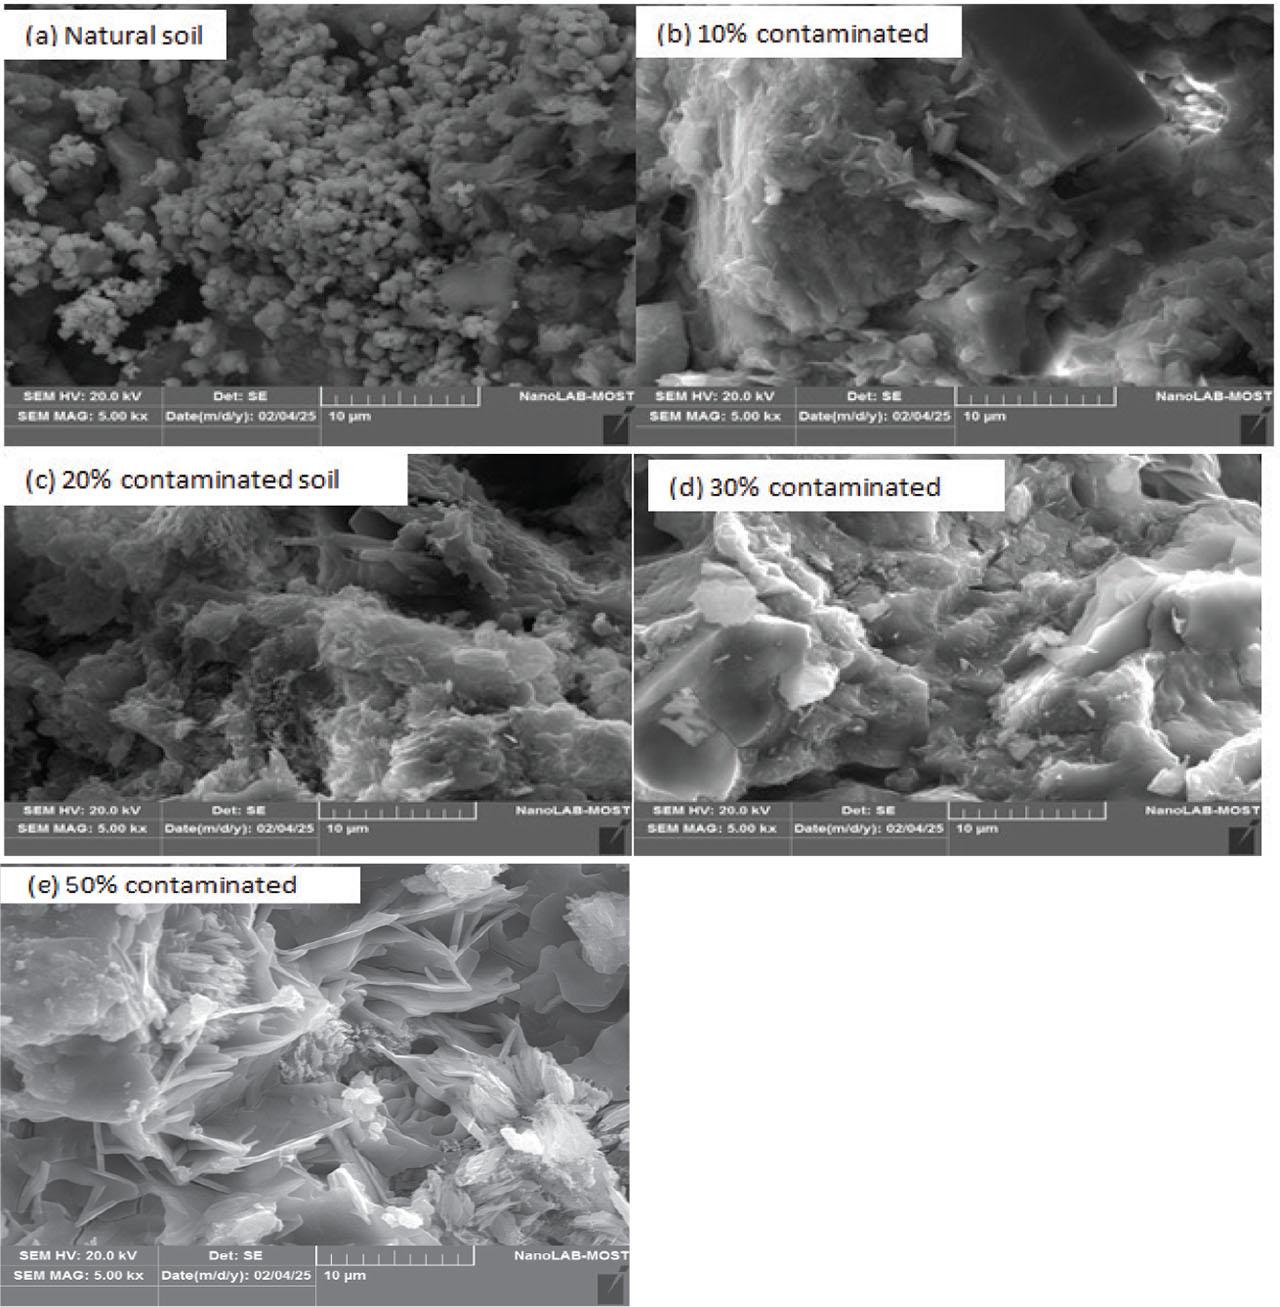
FIGURE 4.
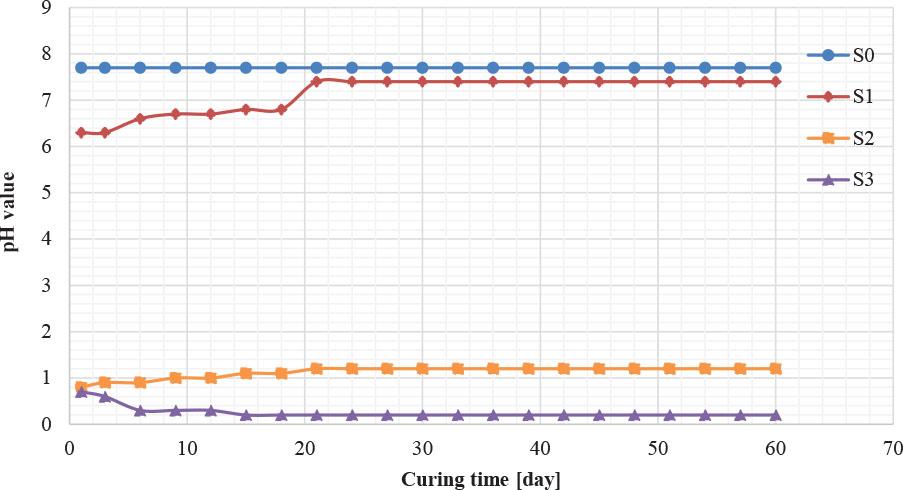
FIGURE 5.
The design mixture of the study
| Soil sample | Content of sulfate in soil by volume [%] | Concentration of sulfate contaminant [%] | pH [-] |
|---|---|---|---|
| S0 | 0 | 0.32 | 7.7 |
| S1 | 10 | 1.74 | 6.7 |
| S2 | 20 | 2.67 | 1.4 |
| S3 | 30 | 3.87 | 0.3 |
| S4 | 50 | 6.43 | 0 |
The physical features of normal soil
| Characters | Color | LL [%] | PL [%] | PI [%] | MDD [g·cm−3] | OMC [%] | UCS [kPa] | Gs [g·cm−3] | USCS category | pH [-] |
|---|---|---|---|---|---|---|---|---|---|---|
| Value | light brown | 49 | 36 | 13 | 1.66 | 18.5 | 25 | 2.67 | ML | 7.7 |
Designation keys of samples
| Soil sample | Description |
|---|---|
| S0 | natural soil sample |
| S1 | soil samples contaminated with 10% by weight of acid |
| S2 | soil samples contaminated with 20% by weight of acid |
| S3 | soil samples contaminated with 30% by weight of acid |
| S4 | soil samples contaminated with 50% by weight of acid |