
Rapid industrial growth and economic expansion have led to the construction of numerous industrial facilities, resulting in increased environmental pollution. Acid infiltration into soil is a prominent environmental and engineering issue in geotechnical engineering, resulting in significant changes in soil properties. This infiltration occurs due to several factors, including industrial waste discharge, chemical accidents, or the indiscriminate use of acidic substances on construction sites. Acids affect soil structure by dissolving certain minerals, leading to modifications in cohesion and permeability properties, thereby lowering its ability to withstand structural loads. The chemical response between acids and soil additives also results in a change in pH, negatively impacting the organic and chemical health of the soil. Therefore, analyzing the impact of acid seepage on soil from an engineering perspective is necessary to enhance the use of effective techniques to protect facilities and soil from environmental and structural degradation.
Sunil et al. (2006) investigated the location behavior of soil underneath the influence of pH on the engineering and chemical properties of laterite soils soaked in solutions of various pH levels (pH 5.0), neutral (pH 7.0), and alkaline (pH 8.0) for about 90 days. It was found that the solution’s pH strongly influences the chemical properties of laterite soils. The engineering properties of the soil change when compared to the initial soil properties. Umesh et al. (2011) studied how acid pollutants influence soil by changing its physical and chemical properties, including its fluidity. This decreases the soil’s water-preserving ability, increases frictional resistance, and reduces cohesion. These modifications negatively affect soil compressive strength and overall stability. Umesha et al. (2012) focused on the engineering properties of black cotton soils, which are extensively altered through acid infection. Hydrochloric, phosphoric, and sulfuric acids impact the compressive strength and the ultimate compressive strength. Understanding these modifications is crucial for effective soil management and reclamation in contaminated sites. Jain and Jain (2015) explored the differences in engineering characteristics between virgin soil and acid-contaminated soil. The findings showed that acidification of black cotton soil reduces its engineering qualities. As the acid concentration rises, the soil’s strength decreases. However, the extent of the damage is determined by the acid’s concentration and type.
Prasad and Reddy (2016) showed that acid contamination has a significant impact on soil morphology and mineral composition. Prolonged exposure to acids like phosphoric and sulfuric acid causes severe morphological changes, such as clay structure disintegration, as well as mineral transformations, including the production of new minerals such as berilinite, stilbite, gypsum, anhydrite, and albite. These changes impact soil qualities such as compressibility, strength, and fluid conductivity, which in turn impair the serviceability of foundations and superstructures constructed on contaminated soil.
Prasad et al. (2018) examined how acid pollution, notably sulfuric and phosphoric acids, affected the swelling properties of three soil types: natural black cotton soil, bentonite, and kaolin clay. The study investigated soil swelling under various acidity conditions and found that interaction with sulfuric acid produced the most significant swelling ratio, followed by interaction with phosphoric acid. Acidity (pH) is important in establishing the nature of the interaction between soil and acid because a drop in pH causes greater ion exchange effects and mineral changes, which impact soil stability and the ability to sustain engineering pressures. Wang et al. (2020) investigated how acid contamination influences evaporation rates and the formation of drought cracks in soils. As acid concentrations rise, pore structure and bulk density alter, reducing the soil’s mechanical strength. When acid reacts with clay minerals, soil cohesion and tensile strength are lowered, resulting in increased deformation and instability.
Liu et al. (2021) presented results on loess soils and showed that exposure to acidic solutions can alter the particle size distribution of loess. In contrast, acidic solutions can reduce the Atterberg limits, loess strength, and permeability, although the Atterberg limits and loess strength increase significantly in a high-sulfuric acid environment. Subsequently, there is an important change in the influence of different types of acidic solutions on soil particle gradation. The permeability of contaminated loess is negatively correlated with the acid solution concentration. Shan et al. (2023) explore how contamination with acidic materials can affect the geotechnical characteristics of soil. The interaction of soil, water, and acid can lead to significant variations in the compressibility of soil specimens. The effect of the acidic solution increases the pore volume of the soil and changes its structure. Therefore, soil specimens in acidic solutions exhibit higher compressibility. The quality of soil specimens contaminated with acidic solutions is poor. The reason is that some of the materials in the particles react with the acid and dissolve in the liquid. Conversely, the quality of soil specimens in alkaline solutions increases. The study by Chen et al. (2023) indicates that acid-alkali contamination leads to changes in mineralogy, chemistry, and microstructure, affecting properties such as limit moisture content, shear strength, and internal friction angle. Chemical interactions between water and soil are also affected.
The current work focuses on measuring the effects of liquid industrial waste on the geotechnical characteristics of intact clayey soil due to increased industrial activities at the Al-Musiab chemical factory.
The soil samples utilized in this research were obtained from clayey soils from an open excavation at Al-Furat General Company for Chemical Industries in Al-Musaib, south of Babylon Governorate. The excavation was carried out using an eight-meter-long and four-meter-wide Pocline machine, and the specimens were extracted from a depth of 2 m below ground level to study the effect of industrial pollutants on their geotechnical characteristics.
The soil underwent an initial visual classification, where it was identified as high plasticity (ML) clay soil according to the Unified Soil Classification System (USCS). Table 1 presents features of the natural soil.
The physical features of normal soil
| Characters | Color | LL [%] | PL [%] | PI [%] | MDD [g·cm−3] | OMC [%] | UCS [kPa] | Gs [g·cm−3] | USCS category | pH [-] |
|---|---|---|---|---|---|---|---|---|---|---|
| Value | light brown | 49 | 36 | 13 | 1.66 | 18.5 | 25 | 2.67 | ML | 7.7 |
LL – liquid limit, PL – plastic limit, PI – plasticity index, MDD – maximum dry density, OMC – optimum moisture content, UCS – unconfined compression strength, Gs – specific gravity
Source: own work.
After visual classification and soil sampling, disturbed specimens were air-dried and divided into portions for experiments. In this study, sulfuric acid (H2SO4) at a concentration of 97% was used. This hazardous chemical is known to be a strong inorganic acid characterized by its severe corrosiveness and dangerous effects. The acid is usually colorless or yellowish and produces dense vapors at high concentrations with a pungent odor. When diluted, an exothermic reaction occurs with gaseous emissions. Soil samples were immersed in the acid, which was used as a contaminant to simulate the effect of pollution on soil properties. The contaminant was added at different percentages (0%, 10%, 20%, 30%, and 50%) by the weight of the dry soil sample. Table 2 shows the classification and symbols of the soil specimens tested in this study.
Designation keys of samples
| Soil sample | Description |
|---|---|
| S0 | natural soil sample |
| S1 | soil samples contaminated with 10% by weight of acid |
| S2 | soil samples contaminated with 20% by weight of acid |
| S3 | soil samples contaminated with 30% by weight of acid |
| S4 | soil samples contaminated with 50% by weight of acid |
Source: own work.
The contaminant was added to the soil specimens at changing concentrations (10%, 20%, 30%, and 50%) by the weight of the dry sample. The contaminated samples were then placed in sealed plastic containers for 24 hours, a period sufficient to ensure complete penetration of the contaminant into the soil. The soil specimens used in this research were classified according to contamination levels (Table 1). After the mixing process was completed, the contaminated samples were transferred to polyethylene bags and stored in a desiccator before testing. Table 3 shows the changes in contaminant concentrations in the sulfate liquid.
The design mixture of the study
| Soil sample | Content of sulfate in soil by volume [%] | Concentration of sulfate contaminant [%] | pH [-] |
|---|---|---|---|
| S0 | 0 | 0.32 | 7.7 |
| S1 | 10 | 1.74 | 6.7 |
| S2 | 20 | 2.67 | 1.4 |
| S3 | 30 | 3.87 | 0.3 |
| S4 | 50 | 6.43 | 0 |
Source: own work.
Acidity (pH) was measured using a Hanna instrument, model HI 98107, according to ASTM D4972-13 (ASTM International [ASTM], 2013). The test was performed on natural and contaminated soil samples with varying concentrations of sulfuric acid (H2SO4).
Scanning electron microscope (SEM) tests were conducted at the Scientific Research Center of the Commission of Science and Technology, using soil samples contaminated with different concentrations of the pollutant (10%, 20%, 30%, and 50%). These tests aimed to analyze the morphological changes that occurred in the soil structure and study the influence of acid pollution on its behavior. The images used in the analysis were carefully selected from a large collection of images taken of selected samples, using multiple magnification levels, allowing for accurate and detailed visualization of the changes that occurred in the soil surface structure due to exposure to acid pollutants.
Specimens were prepared with mixing ratios corresponding to the optimum moisture content and maximum dry density derived from the standard Proctor test, with predetermined contaminant concentrations applied. The vertical displacement rate of the device was set at 1 mm·min−1 according to ASTM D2166 (ASTM, 2010). During the test, the stress–strain relationship was recorded at 10‒15 measurement points, with the load adjusted so that the failure time did not exceed 15 min or 20% of the specimen height, to ensure accurate and comparable results. The face structure is affected by exposure to acid pollutants.
The sulfuric ion test was conducted at the Scientific Research Center of the Commission of Science and Technology, according to ASTM D516 (ASTM, 2023). The test was performed on normal and contaminated soil specimens with varying concentrations of sulfuric acid (H2SO4).
The findings of the Atterberg limit tests, which include the liquid limit, plastic limit, and plasticity index, show that increasing the contamination concentration of sulfuric acid (H2SO4) in the soil results in a significant reduction in both the liquid limit and plasticity index. This reduction is attributed to the chemical and physical variations that occur in the soil structure due to the acid’s action and can be explained by the following reasons:
- –
Disintegration of clay structure and degradation of clay minerals, which is consistent with the study by Aubaid (2004).
- –
Sulfuric acid decomposes clay minerals – for example, montmorillonite and kaolinite, altering their water-holding capacity according to Panda et al. (2010).
- –
Decomposition weakens the soil’s water absorption and increases swelling, leading to a decrease in liquid limit, which is consistent with previous studies, such as Sivapullaiah et al. (2008), AlShammari et al. (2019), and Min et al. (2023).
- –
Reduced soil water-holding capacity, according to Umesh et al. (2011).
- –
Sulfuric acid reacts with clay particles and water, causing the soil to lose its plastic properties (Chari et al., 2023).
- –
The water required to initiate flow decreases, thus reducing the liquid limit (Sivapullaiah et al., 2009).
- –
The effect of chemical reactions on intermolecular bonds (Caselles et al., 2023). Sulfuric acid weakens the chemical bonds within the activated clay network, resulting in a loss of cohesion and plasticity.
The pH value is critical in defining soil geotechnical features, particularly those related to Atterberg limits, including the liquid limit, plastic limit, and plasticity index. When the pH drops due to exposure to acidic pollutants, such as sulfuric acid, clay minerals undergo chemical changes that cause the lamellar structure to disintegrate. According to Gratchev and Towhata (2013) and Momeni et al. (2020), as a result of this action, the soil’s water-holding capacity decreases significantly, as does its plastic behavior. Acid reactions contribute to the formation of hardening and cracking. Experimental findings demonstrate that the plastic limit steadily decreases with the early phases of acid pollution and continues to diminish with increasing sulfuric acid concentration, with a maximum plastic limit value reported at 50% of the pollution concentration. Figure 1 reflects this pattern of changes, showing a direct relationship between increasing acid pollution rates and decreasing Atterberg limits, highlighting the profound structural impact of changes in pH on the plastic behavior of soils.
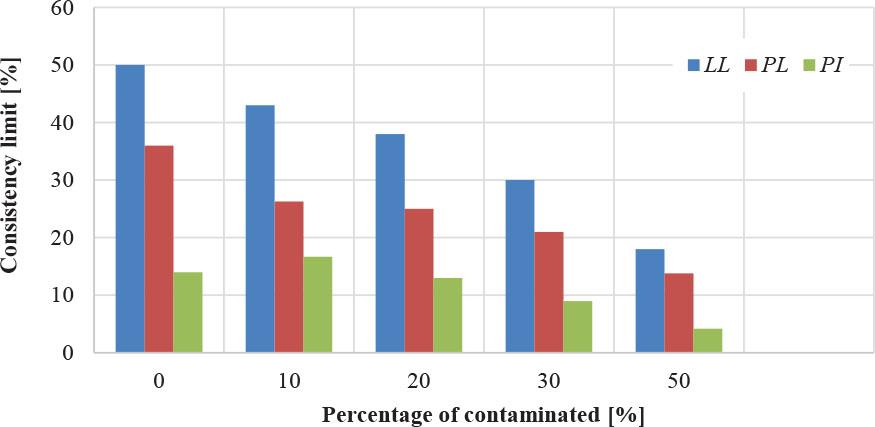
Impact of contamination on Atterberg limits
Source: own work.
Unconfined compression tests were conducted on disturbed soil samples to determine the strength of clayey soil. Figure 2 shows that when the soil was contaminated with sulfuric acid at different concentrations (10%, 20%, 30%, and 50%), the highest strength was recorded at 20% at pH 1.4; then the strength began to decrease with increasing contamination. This trend reflects the effect of the chemical interaction between the acid and soil components. Moderate acid (10% and 20%) at pH 6.7 and 1.4, respectively, led to the hardening of some minerals and enhanced cohesion, while higher percentages (30% and 50%) at pH 0.3 and 0.0, respectively, led to the dissolution of the mineral structure and weakening of the soil’s mechanical properties, resulting in a reduction in its strength. The findings also showed that the strength increased for all contamination levels after 28 days of treatment, indicating an initial reaction that temporarily improved the soil properties. However, after 56 days and 90 days, a decrease in strength was observed as a result of the continued chemical reactions between the acid and the soil minerals, leading to the dissolution of the soil structure and the weakening of its cohesion over time. The rate of decrease in soil strength increased with increasing contamination, confirming the impact of acid pollution on its mechanical characteristics (Abdulhussein Saeed et al., 2014). The results of the unconfined compression tests are shown in Figure 2.
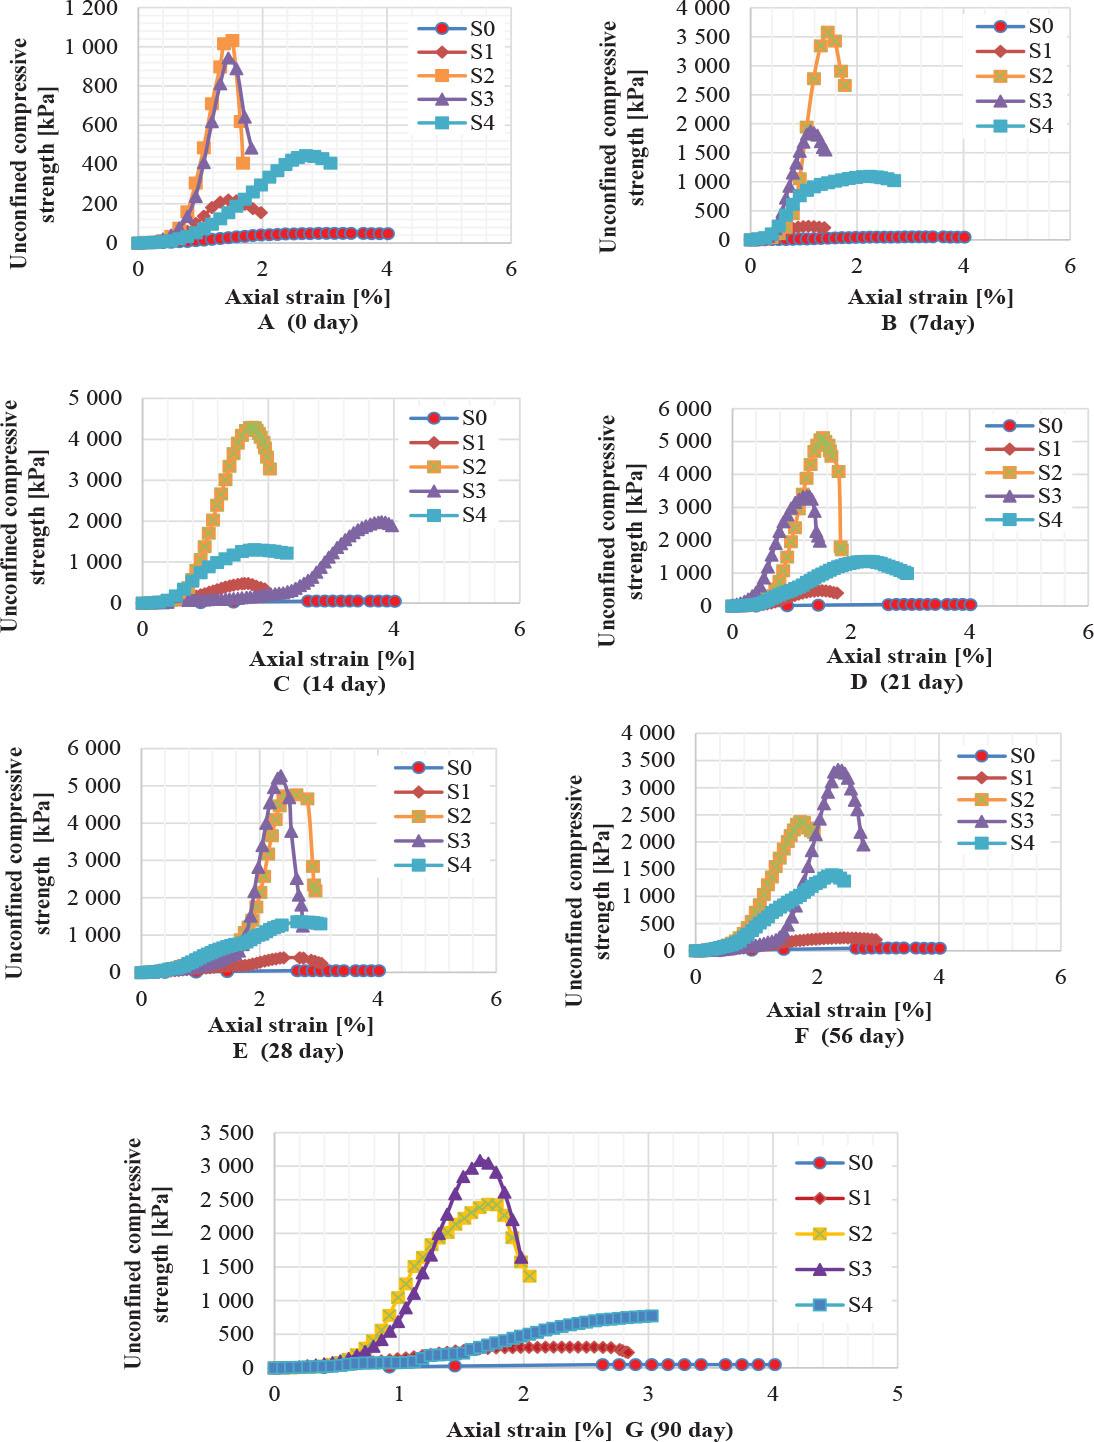
The uncompressed strength for natural and contaminated soil for different curing time (A to G)
Source: own work.
From Figure 3, it can be concluded that the influence of time on the strength of soil is significant. At the beginning, the S2 (20% sulfate) sample had a maximum strength of around 1,000 kPa, with a maximum increase in strength of 1,900%. After a curing period of 7 days, the strength continued to increase for the same soil sample (S2) until it reached 3,600 kPa. The strength further increased to 5,100 kPa after 21 days for the same soil sample (S2). After that, the soil with 30% chemical (S3) began to surpass the S2 samples, reaching 5,200 kPa at 28 days, and at 56 days, the S3 samples had more strength than the other soil samples. From these results, it can be concluded that the effect of the chemical over time depends on the percentage of the chemical, as some percentages do not react at the beginning but need time to start. On the other hand, all samples showed a decrease in strength after 56 days and 90 days, indicating a found relationship between the chemical (sulfate) and time during the chemical reaction in the soil media. From Figure 3, these results can be confirmed. While S0 and S1 had high pH values, it can be noted that S2 and S3 had lower pH values, which, in acidic media, increases the shear strength for this soil type (ML).
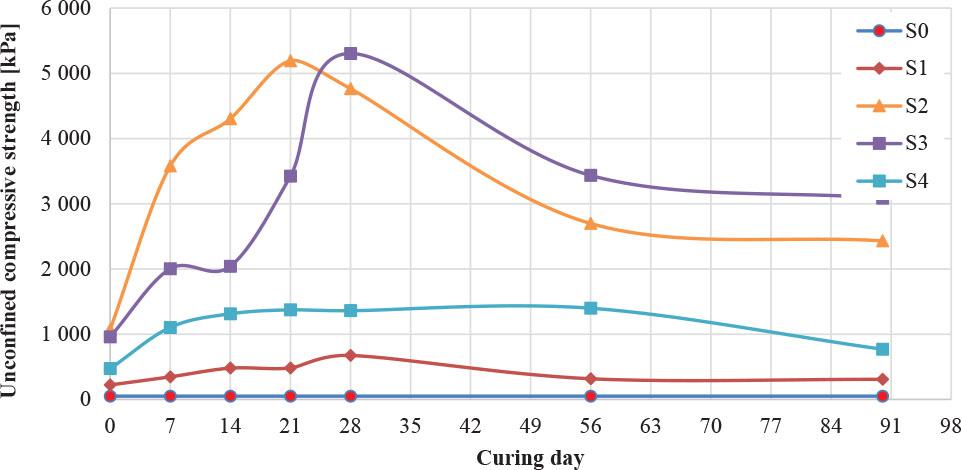
The average unconfined compressed strength for natural and contaminated soil with curing time
Source: own work.
The pH value of a given solution reflects its hydrogen ion concentration, making it an important indicator for understanding chemical reactions in soil. The pH value provides vital information about changes that may occur in soil properties, as it significantly affects the charge distribution in the clay network, making it a key factor in controlling the solubility of clay minerals. A study conducted on soil contaminated with sulfuric acid showed that low pH not only affects chemical reactions but also extends to the geotechnical characteristics of the soil, such as its cohesion and water-holding capacity. It may be that the soil’s cation exchange capacity decreases with increasing acid concentration, leading to reduced stability (SD) (Venkataraja Mohan & Ramesh, 2014; Venkataraja & Ramesh, 2014). Figure 4 illustrates the relationship between pH and contamination level. Three different contamination levels (10%, 20%, and 30%) were used to study their effect over time. The results showed that pH values gradually increased over time and then stabilized after 21 days; this is likely the result of ion exchange processes, where clay minerals and soil organic matter absorb or release ions to achieve chemical balance. In addition, sulfuric acid reacts with basic minerals and calcium carbonate (CaCO3), consuming hydrogen ions and contributing to a gradual decrease in pH until it reaches stability.
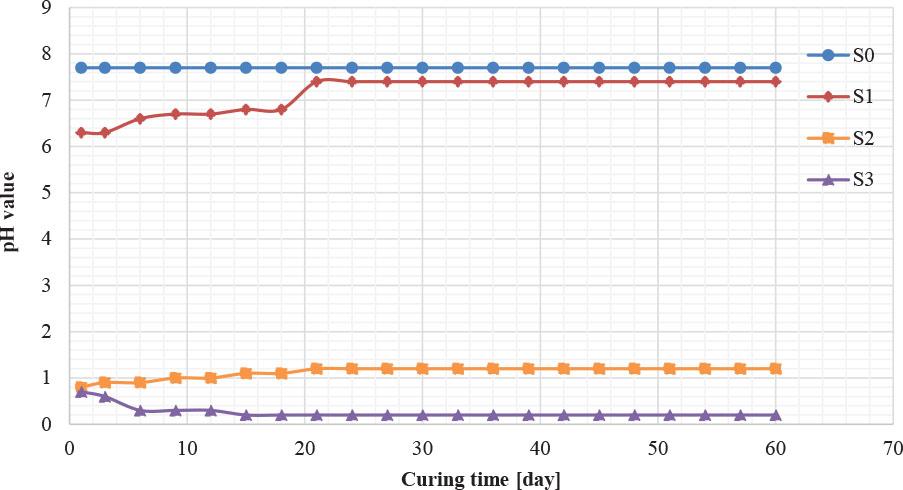
Variation of pH for the contaminated acidic percentages with time
Source: own work.
When fine clay particles are exposed to sulfuric acid contamination, carbonate bonds are formed, leading to the formation of loose structures with extensive voids, causing significant swelling and compression, as noted by Mohan et al. (2018) and Khodabandeh et al. (2020). The dissolution of calcite, ankerite, and aluminum minerals, along with the formation of sulfates, contributes to the disintegration of the clay structure. As the microscopic images in Figure 5 illustrate, natural clay appears as agglomerated particles with interconnected crystal structures and hexagonal clusters with voids. Upon interaction with a 10% contaminated concentrate, these structures transform into sintered, irregular crystal plates with an increased void ratio. When the H2SO4 concentration increases to 20%, the clay microstructure changes to irregular, agglomerated structures covered with fine, needle-like crystal plates, exhibiting a higher void content. Upon interaction with a 30% contaminated concentrate, cohesive, agglomerated crystal structures with greater void content are formed. As the concentration increases to 50%, the microstructure of the clay becomes composed of thin crystalline plates and needle-shaped crystals, with a marked increase in void content. These changes highlight the microscopic effects of acid contamination on the clay after 28 days of exposure. The results of the SEM test confirm that the 30% chemical (S3) becomes coarser and stronger than the other soil samples. In contrast, the S4 (50% acid) becomes weaker due to an increase in chemical content and a decrease in pH, resulting in a thin and sharp layer, marking the change from an agglomerated structure to a layered structure.
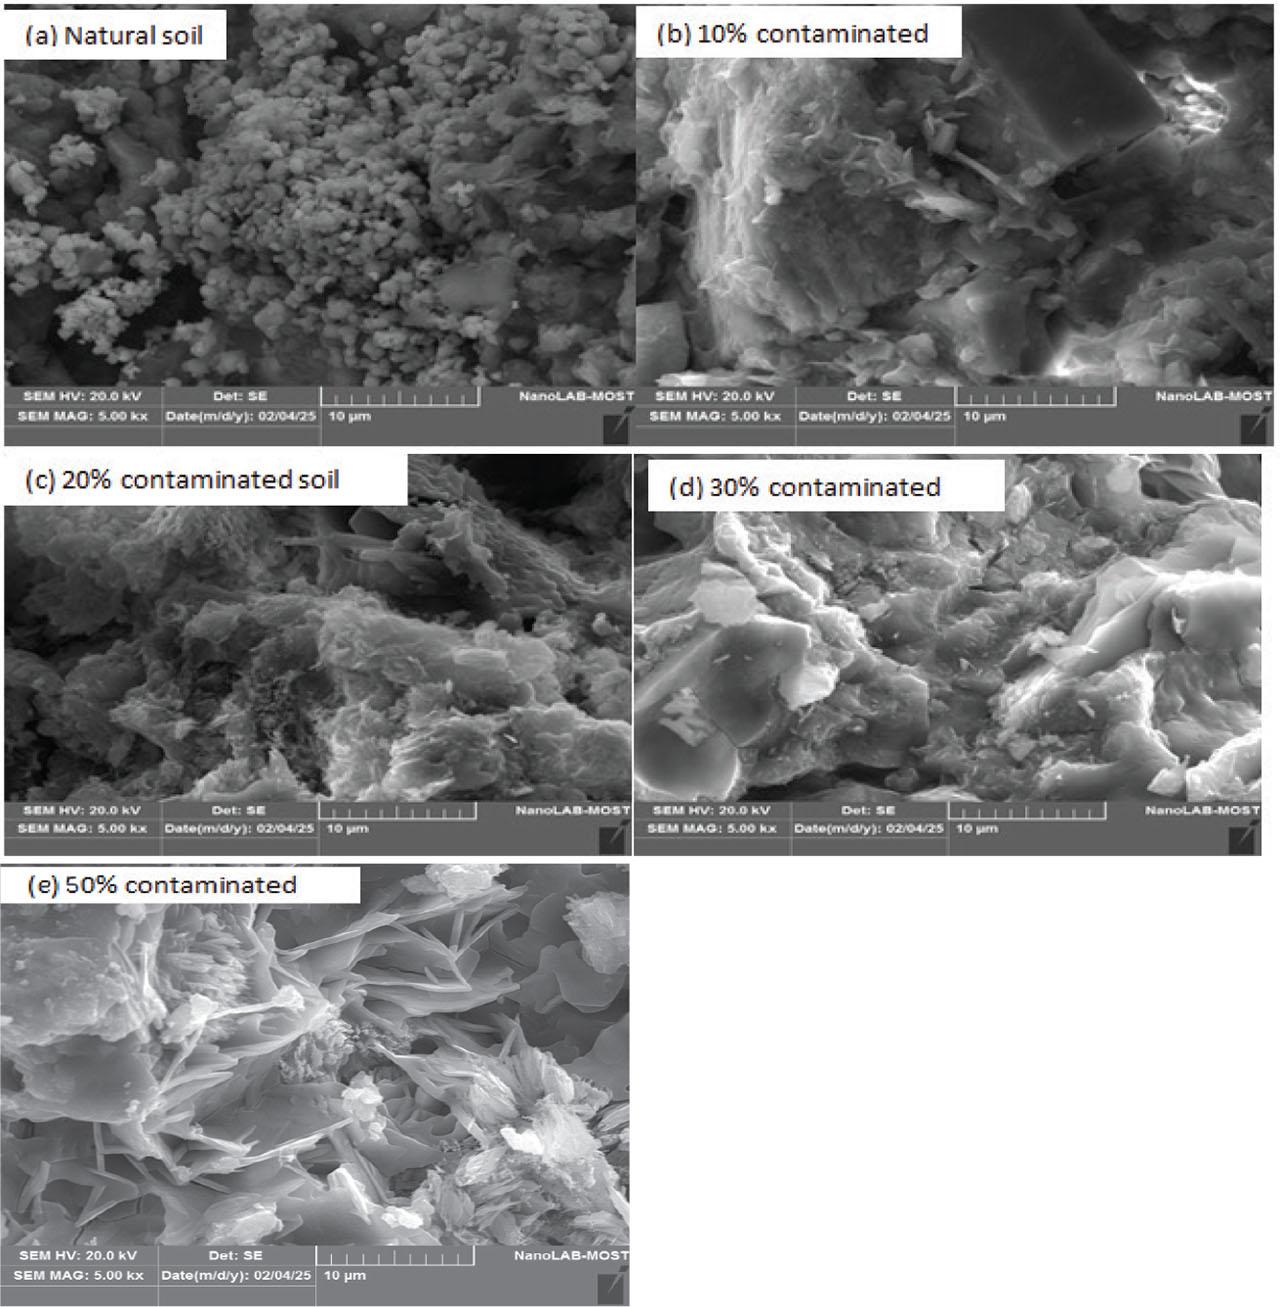
SEM images of lay interacting with (a) natural soil, (b) 10% H2SO4, (c) 20% H2SO4, (d) 30% H2SO4, and (e) 50% H2SO4
Source: own work.
The liquid industrial waste resulting from leakage obtained from the Furat State Company for Chemical Industries in Al-Musaib City has diverse effects on the geotechnical characteristics of clayey soil. This diversity ranged from slight in some characteristics to significant in others. Additionally, increasing the ratio of contaminants enhanced the diverse effects on the geotechnical properties of the soil. The conclusion can be summarized in the following points:
- –
The contaminant causes a significant decrease in pH value, which decreases by 96% at a concentration of 30%.
- –
The pH values increase over time and then stabilize after three weeks.
- –
The contaminant causes a reduction in liquid limit, plastic limit, the plasticity index, which decreased by 63%, 61.6%, and 67.7% at a concentration of 50%.
- –
The findings of the unconfined compressive strength displayed a significant increase of 10,921% at a contaminant concentration of 20%, followed by a further 2,851% increase at 50% concentration compared to uncontaminated soil.
- –
The unconfined compressive strength decreased by 51% to a 20% contaminant concentration, and this decrease continued with increasing contaminant levels, reaching a 5.24% decrease at a 50% concentration after 56 days compared to 28 days. This change in the mechanical behavior of soil is attributed to the gradual decrease in pH over time, as the acidic environment resulting from pollution contributes to the disintegration of the soil structure, weakening the cohesion of particles and leading to a significant deterioration in its mechanical resistance.
Microstructure images taken from the SEM show the agglomeration of soil particles, which increases the percentage of voids and causes a change in soil density, leading to increased dispersion and resulting in decreased resistivity. This decrease in resistivity is attributed to the reduction in pH resulting from increased contamination levels. Soil contamination with sulfuric acid leads to an increase in sulfate ion content in the soil.