
FIGURE 1.
FIGURE 2.
FIGURE 3.
FIGURE 4.
FIGURE 5.

FIGURE 6.

FIGURE 7.
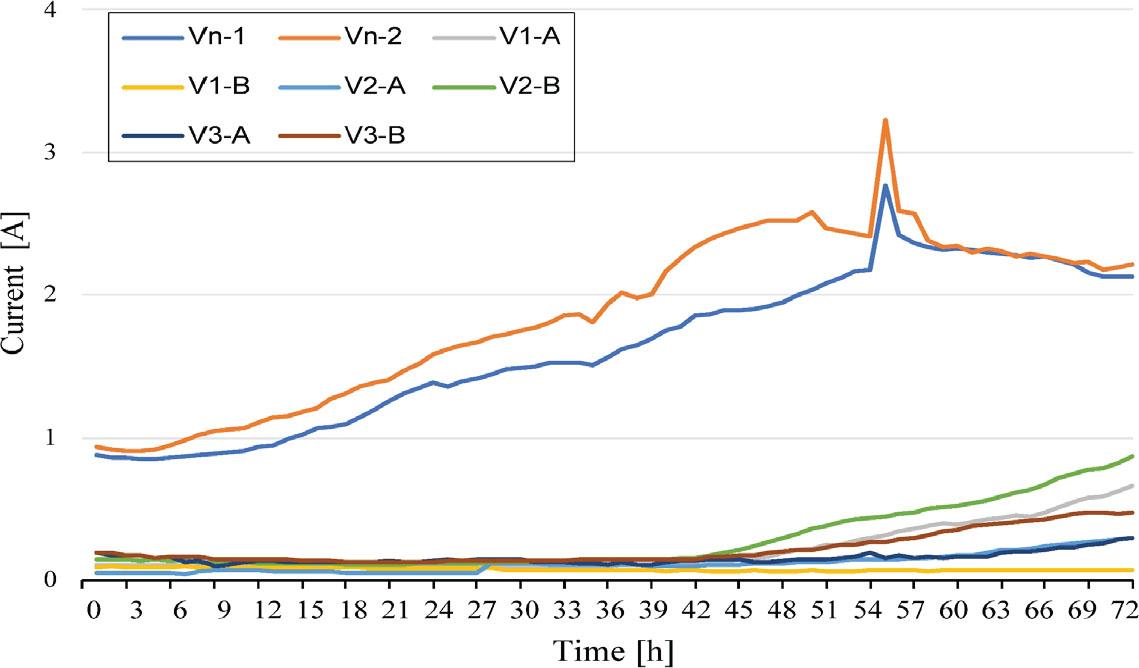
FIGURE 8.
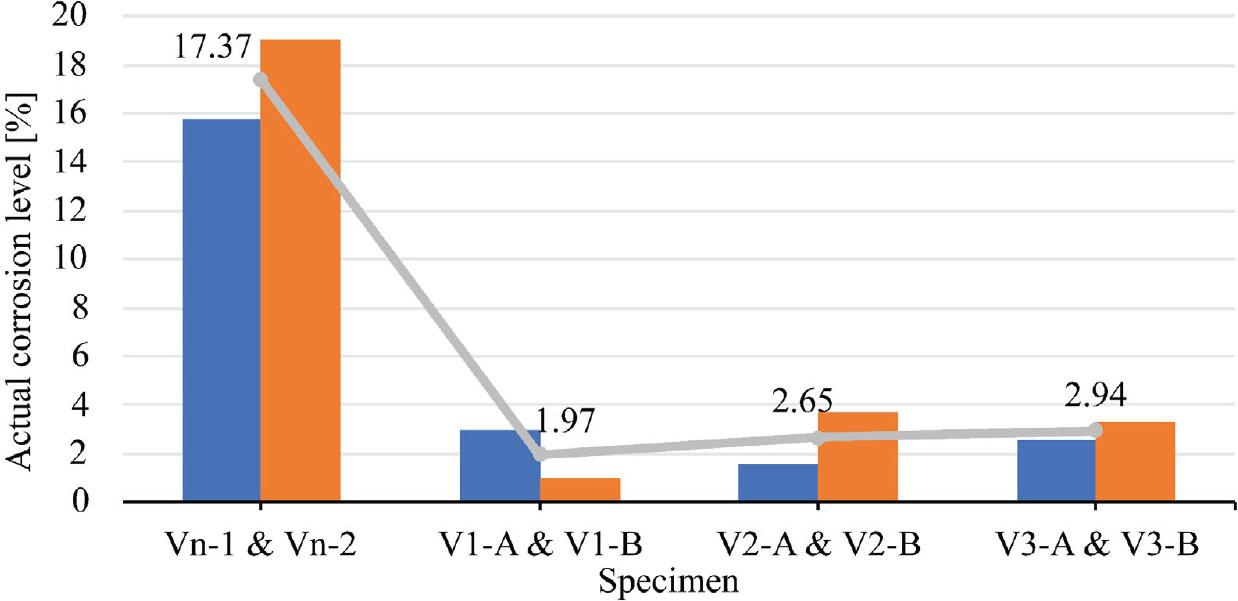
FIGURE 9.
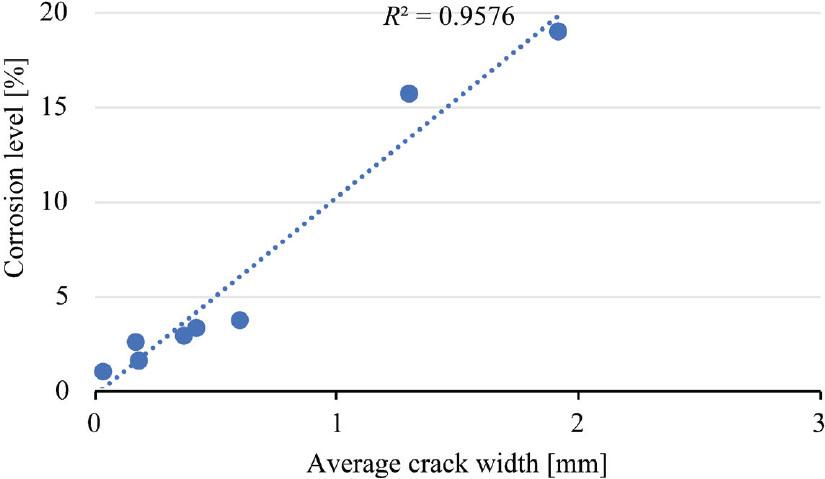
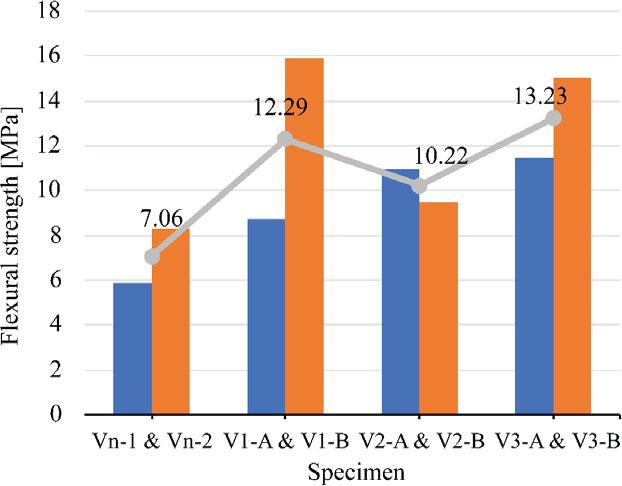
FIGURE 10.
FIGURE 11.
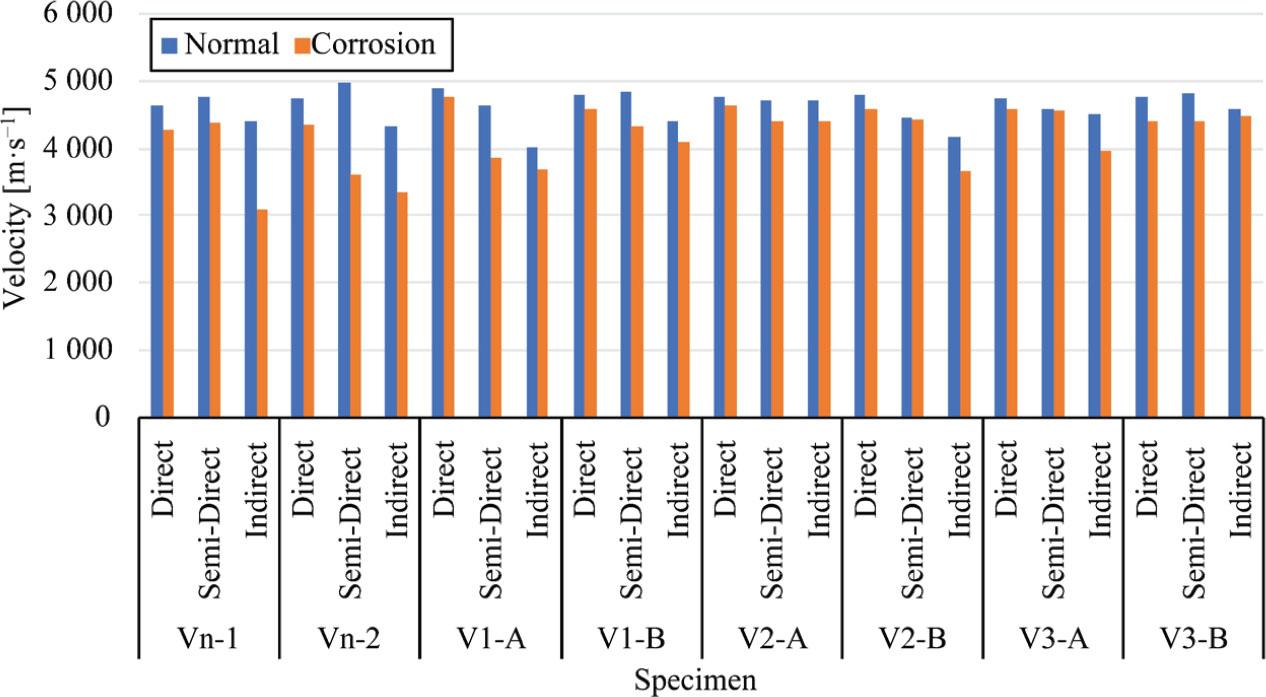
FIGURE 12.
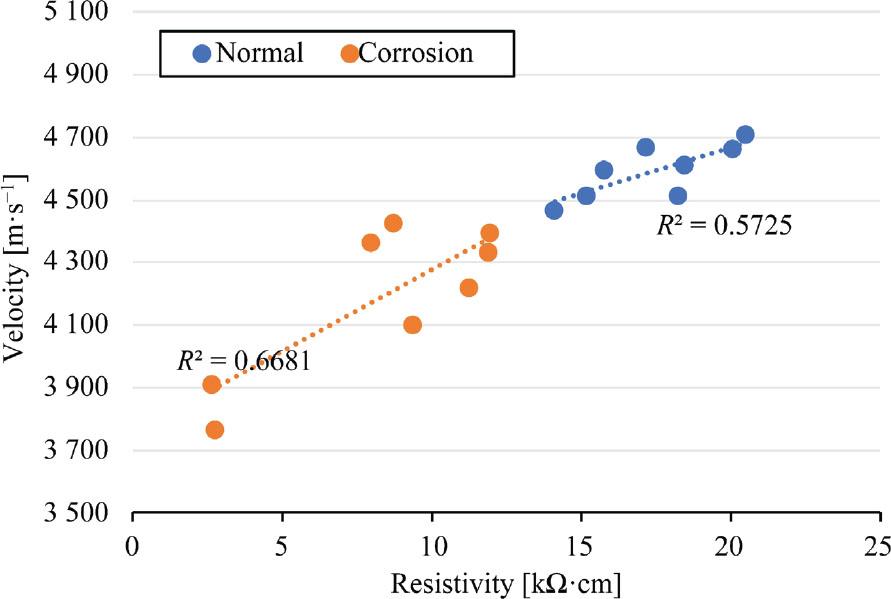
FIGURE 13.
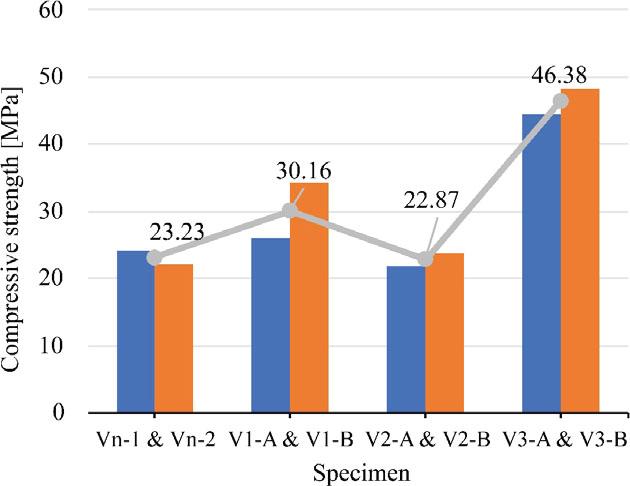
FIGURE 14.
Specimen mixture proportion
| Material content [kg·m−3] | Specimen | ||||
|---|---|---|---|---|---|
| Vn | V1 | V2 | V3 | ||
| Water | 313.59 | 313.59 | 313.59 | 313.59 | |
| Cement | 336.07 | 235.25 | 235.25 | 235.25 | |
| Sand | 805.87 | 684.99 | 684.99 | 684.99 | |
| Gravel | 1 064.55 | 1 064.55 | 1 064.55 | 1 064.55 | |
| Fly ash (FA) | – | 50.41 | 67.21 | 84.02 | |
| Silica fume (SF) | – | 50.41 | 33.61 | 16.80 | |
| Bottom ash (BA) | – | 120.88 | 120.88 | 120.88 | |
| Superplasticizer | – | 8.40 | 8.40 | 8.40 | |
Concrete corrosion level
| Specimen | Current [A] | Corrosion duration [h] | Estimated corrosion level [%] | Estimated mass loss [g] | Actual corrosion level [%] | Actual mass loss [g] | Derivation [%] | ||
|---|---|---|---|---|---|---|---|---|---|
| Vn-1 | 1.636 | 72 | 23.893 | 123.049 | 15.73 | 81 | 8.16 | ||
| Vn-2 | 1.861 | 72 | 27.181 | 139.981 | 20.58 | 106 | 6.60 | ||
| V1-A | 0.209 | 72 | 3.082 | 15.721 | 2.94 | 15 | 0.14 | ||
| V1-B | 0.075 | 72 | 1.110 | 5.662 | 1.96 | 10 | 0.85 | ||
| V2-A | 0.118 | 72 | 1.728 | 8.900 | 2.52 | 13 | 0.80 | ||
| V2-B | 0.286 | 72 | 4.213 | 21.487 | 3.73 | 19 | 0.49 | ||
| V3-A | 0.157 | 72 | 2.316 | 11.814 | 2.55 | 13 | 0.23 | ||
| V3-B | 0.221 | 72 | 3.255 | 16.598 | 3.33 | 17 | 0.08 | ||
Crack width measurement
| Specimen | Duration of corrosion [h] | Crack width [mm] | AVG | Actual corrosion level [%] | ||
|---|---|---|---|---|---|---|
| left | middle | right | ||||
| Vn-1 | 72 | 0.65 | 2.50 | 0.75 | 1.30 | 15.73 |
| Vn-2 | 72 | 0.15 | 5.00 | 0.60 | 1.92 | 19.01 |
| V1-A | 72 | 0.75 | 0.25 | 0.10 | 0.37 | 2.94 |
| V1-B | 72 | 0.10 | 0 | 0 | 0.03 | 0.99 |
| V2-A | 72 | 0.20 | 0.20 | 0.15 | 0.18 | 1.57 |
| V2-B | 72 | 0 | 0.80 | 1.00 | 0.60 | 3.73 |
| V3-A | 72 | 0.1 | 0.25 | 0.15 | 0.17 | 2.55 |
| V3-B | 72 | 0.9 | 0.20 | 0.15 | 0.42 | 3.33 |
Properties of aggregates
| Property | Gravel | Sand |
|---|---|---|
| Bulk specific gravity [kg·m−3] | 2.65 | 1.78 |
| Apparent specific gravity [kg·m−3] | 2.71 | 2.97 |
| Saturated surface-dry specific gravity [kg·m−3] | 2.67 | 2.18 |
| Water absorption [%] | 0.75 | 22.62 |
| Fineness modulus [-] | – | 2.435 |
| Mud content [%] | – | 2.0 |
| Aggregate wear [%] | 15.0 | – |