
Concrete is a primary construction material widely utilized in the building industry. Its extensive application in residential and commercial infrastructure stems not only from its exceptional properties, such as structural performance, sustainability, affordability, and versatility, but also from its adaptability in achieving complex geometric shapes (Li et al., 2022). However, steel corrosion within concrete structures significantly compromises durability and is frequently identified as a major cause of premature failure and damage in reinforced concrete construction. The global economic impact of corrosion is substantial, with associated costs estimated at approximately USD 2.5 trillion (Rahita & Zaki, 2023). This issue underscores the necessity of innovative strategies to enhance the resilience and longevity of concrete structures in corrosive environments. One of the primary limitations of concrete is its susceptibility to steel reinforcement corrosion, an electrochemical process involving iron anode dissolution and oxygen cathode reduction, with the concrete’s pore solution acting as an electrolyte. This phenomenon is exacerbated by aggressive agents, such as CO2+ and Cl−, which penetrate the concrete matrix to reach the reinforcement. The degradation of the protective layer formed on the steel surface in dense concrete accelerates the corrosion process, progressively undermining the performance of reinforced concrete structures. The resulting corrosion products deposit and generate tensile stress, leading to the formation of cracks (Rodrigues et al., 2021). Addressing this challenge requires the development of methods to inhibit the natural corrosion rate by advancing more durable and long-lasting concrete mixtures capable of withstanding such deterioration over time. Fly ash (FA) is a byproduct of coal-fired power plants and is widely utilized as a mineral additive in cement and concrete. Incorporating FA in concrete is cost-effective and enhances its properties in both fresh and hardened states, including improved workability, strength, and reduced drying shrinkage. Furthermore, the use of FA addresses issues related to the storage and disposal of this industrial byproduct (Nayak et al., 2022). Similarly, silica fume (SF) is an ultrafine, non-crystalline byproduct of the silicon production process. It is a highly reactive pozzolanic material composed primarily of amorphous silicon dioxide, with a specific surface area ranging from 15 to 25 m2·g−1 (Adil et al., 2020). The inclusion of SF in concrete significantly enhances its corrosion resistance, as evidenced by studies showing that reinforcement corrosion does not initiate even after 300 days of exposure to a five-percent solution of NaCl (Ahmad et al., 2022). The combination of FA and SF has demonstrated superior performance compared to their individual use, particularly in improving the durability of concrete in corrosive environments (Anwar et al., 2022).
Thermal power plants generate large quantities of coal ash, approximately one-fifth of which is bottom ash (BA), with the remainder being FA. Bottom ash exhibits a granular structure, making it a subject of ongoing research as a substitute for sand and cement in concrete (Monika et al., 2022). However, due to its porous structure and higher water absorption capacity compared to natural sand, the inclusion of BA in concrete mixtures increases water demand, consequently reducing workability (Nanda & Rout, 2021). In addition to mineral additives, the use of bacteria offers a novel approach to enhancing concrete performance. Certain bacteria can convert chemical precursors into calcium carbonate, commonly known as limestone. Bacillus subtilis, a rod-shaped bacterium found in soil and the human gastrointestinal tract, has been identified as an effective self-healing agent for concrete. Concrete incorporating Bacillus subtilis exhibits higher compressive strength than conventional concrete and demonstrates self-healing properties (Premalatha et al., 2023). Studies have shown that Bacillus subtilis enhances both the compressive and flexural strength of concrete, making it a promising agent for improving durability and extending the lifespan of concrete structures (Nindhita et al., 2024).
Early detection of the corrosion process can significantly minimize the extent of repairs or replacements required, thereby reducing rehabilitation costs. Non-destructive testing (NDT) methods have proven valuable for in-situ evaluation of steel corrosion in reinforced concrete, allowing for effective assessment of corrosion effects and structural integrity (Zaki et al., 2015). Among these methods, electrical resistivity (ER) testing has been employed to evaluate the extent of concrete damage caused by steel reinforcement corrosion. Studies indicate a significant correlation between ER values and the degree of corrosion-induced damage, making resistivity measurements a reliable, non-destructive approach for estimating potential corrosion damage in concrete structures (Robles et al., 2024). Ultrasonic pulse velocity (UPV) testing is another widely used NDT method for assessing concrete quality and detecting damage, including that caused by corrosion. When combined with other techniques, such as electrical resistivity measurements, UPV provides more accurate results for identifying corrosion and evaluating the condition of concrete structures (Almashakbeh & Saleh, 2022). These methods highlight the importance of integrating advanced testing techniques to enhance the durability and maintenance of reinforced concrete systems.
Various studies have explored various aspects of the use of Bacillus subtilis in improving the mechanical properties of concrete (Ganesh et al., 2020; Jena et al., 2020; Nindhita et al., 2024), as well as the use of fly ash, bottom ash, and silica fume materials in increasing the resistance of concrete to corrosion and chloride attack (Mh et al., 2020; Morla et al., 2021; Anwar et al., 2022; Meena et al., 2023; Malaiškienė & Vaičienė, 2024; Panda et al., 2024), However, these studies have not been correlated with the evaluation of concrete using NDT. Meanwhile, studies of NDT evaluation methods such as ER and UPV in detecting concrete degradation due to corrosion (Almashakbeh & Saleh, 2022; Robles et al., 2024) are still focused on research on ordinary concrete and have not yet explored concrete mixtures based on Bacillus subtilis bacteria and mining waste as a substitute for cement. In addition, there is still a gap in research that comprehensively links the synergistic effects of the combination of Bacillus subtilis with fly ash, bottom ash, and silica fume on concrete resistance to corrosion while validating the results through destructive testing (DT) and NDT to obtain a more accurate correlation between the physical condition of the concrete and the results of NDT measurements. Therefore, this study aims to bridge the existing research gaps while analyzing the impact of fly ash and silica fume compositions, combined with the addition of bottom ash, superplasticizer, and Bacillus subtilis bacteria, on the performance of corroded concrete. In addition, this study aims to offer a comparative analysis of the performance of normal concrete versus pozzolan-based concrete incorporating Bacillus subtilis in overcoming corrosion phenomena. This study is expected to provide valuable references for research related to corrosion detection in reinforced concrete using ER and UPV methods.
The materials used in this study include sand with a particle size range of 0.15–4.75 mm and gravel with a maximum size of 20 mm. Sieve analysis of the sand, conducted in accordance with ASTM C33/33M (ASTM International [ASTM], 2018), indicates a size distribution consistent with gradation classification number 3, as shown in Figure 1. The cement utilized in this research is Portland composite cement (PCC) branded as Semen Merdeka Indonesia. The fly ash and bottom ash used are sourced from power plant waste in Indonesia. The Bacillus subtilis bacteria were cultured in the laboratory to a concentration of 105 cfu·ml−1. Silica fume was supplied by PT. Sika Indonesia was under the SikaFume brand, while the superplasticizer (SP) used was ViscoCrete-1003, also produced by PT. Sika Indonesia.
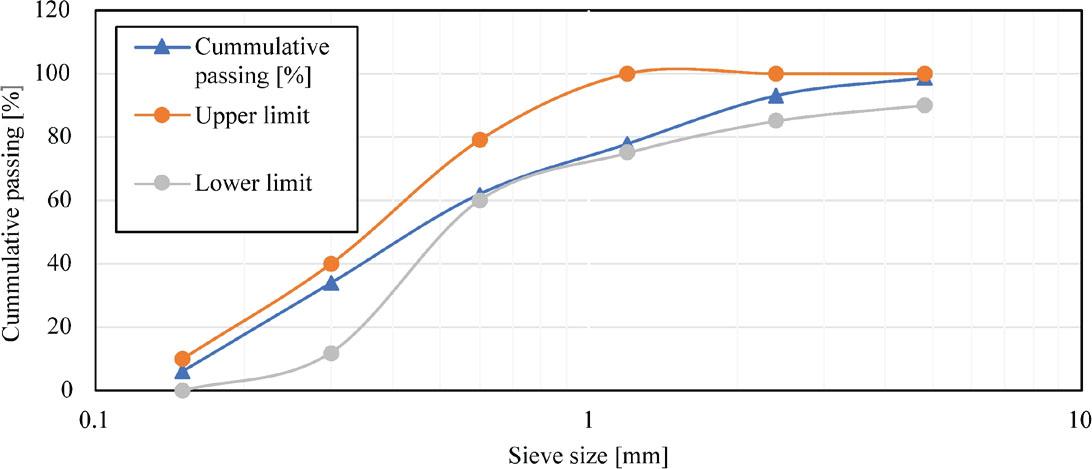
Sand sieve analysis
Source: own work.
The material testing process is carried out before the mix design process, which includes testing the specific gravity, gradation, wear, and mud content of the material. Testing of specific gravity and absorption of coarse aggregate is based on SNI 1969:2016 (Badan Standardisasi Nasional [BSN], 2016) and SNI 1970:2016 (BSN, 2016) for fine aggregate. Gradation testing refers to SNI ASTM C136:2012 (ASTM, 2012). Wear testing refers to SNI 2417:2008 (BSN, 2008). Mud content testing refers to SNI ASTM C117:2012 (ASTM, 2012). The aggregate properties are presented in Table 1.
Properties of aggregates
| Property | Gravel | Sand |
|---|---|---|
| Bulk specific gravity [kg·m−3] | 2.65 | 1.78 |
| Apparent specific gravity [kg·m−3] | 2.71 | 2.97 |
| Saturated surface-dry specific gravity [kg·m−3] | 2.67 | 2.18 |
| Water absorption [%] | 0.75 | 22.62 |
| Fineness modulus [-] | – | 2.435 |
| Mud content [%] | – | 2.0 |
| Aggregate wear [%] | 15.0 | – |
Source: own work.
The concrete mix design was prepared following the ACI 211.1 standard (Dixon et al., 1991), targeting a compressive strength of 25 MPa with a water-to-cement ratio (w/c) of 0.61 for all specimens. The material proportions for preparing the specimens are detailed in Table 2.
Specimen mixture proportion
| Material content [kg·m−3] | Specimen | ||||
|---|---|---|---|---|---|
| Vn | V1 | V2 | V3 | ||
| Water | 313.59 | 313.59 | 313.59 | 313.59 | |
| Cement | 336.07 | 235.25 | 235.25 | 235.25 | |
| Sand | 805.87 | 684.99 | 684.99 | 684.99 | |
| Gravel | 1 064.55 | 1 064.55 | 1 064.55 | 1 064.55 | |
| Fly ash (FA) | – | 50.41 | 67.21 | 84.02 | |
| Silica fume (SF) | – | 50.41 | 33.61 | 16.80 | |
| Bottom ash (BA) | – | 120.88 | 120.88 | 120.88 | |
| Superplasticizer | – | 8.40 | 8.40 | 8.40 | |
Source: own work.
The specimens included one control mix (Vn) and three pozzolan concrete variations: V1 (15% FA + 15% SF), V2 (20% FA + 10% SF), and V3 (25% FA + 5% SF). In the pozzolan variations, 15% of the sand was replaced with BA, and SP was added at 2.5% of the cement weight. Additionally, Bacillus subtilis was incorporated directly into the mixture at 1% of the specimen’s volume. This mix design ensures consistency across specimens while evaluating the effects of pozzolan variations and bacterial addition on the performance of the concrete.
Rectangular beam specimens with dimensions of 50 × 10 × 10 cm were used. Each beam was reinforced with a 12-millimeter diameter steel bar, embedded with a concrete cover thickness of 2 cm (Fig. 2). A cable was connected to the reinforcement to facilitate the corrosion acceleration process using a DC power supply.
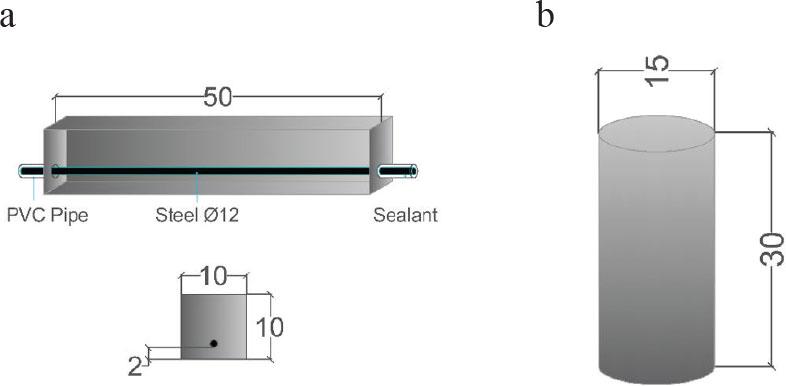
Testing specimen: a – beam, b – cylinder
Source: own work.
These specimens were used to evaluate both corrosion testing and flexural strength. Cylindrical specimens with dimensions of 15 × 30 cm were prepared for compressive strength testing. All test specimens were cured in water for 28 days to ensure proper hydration and strength development.
Corrosion testing was conducted using an accelerated corrosion method. In this setup, the positive cable terminal was connected to the reinforcement within the concrete specimen, while the negative terminal was attached to a steel bar submerged in a 5% five-percent solution of NaCl (Su et al., 2022). The test employed a constant voltage of 25 V, with the current fluctuating throughout the 72-hour testing period. The corrosion test was performed on beam specimens after the curing process. The degree of corrosion was determined by calculating the percentage mass loss of the reinforcement, utilizing Faraday’s law (El Maaddawy & Soudki, 2003), as follows:
Δm – mass loss of the reinforcement [g],
M – atomic weight of the metal (M = 56) [g·mol−1],
I – electric current [A],
t – duration of corrosion [s],
z – electron charge (z = 2) [C],
F – Faraday’s constant (F = 96,500) [A·s−1].
The crack width resulting from corrosion was subsequently measured on three distinct sections: the right side, closest to the connection cable; the middle section; and the left side, furthest from the cable. These measurements were conducted using a crack gauge with a precision of 0.05 mm.
The mechanical properties of concrete were evaluated through compressive and flexural strength tests after a curing period of 28 days. The compressive strength test was conducted on cylindrical specimens (15 × 30 cm) following the guidelines of ASTM C39/C39M (ASTM, 2021), while the flexural strength test was performed on beam specimens (50 × 10 × 10 cm) in accordance with ASTM C293/C293M (ASTM, 2016). These tests aimed to determine the compressive strength of the concrete cylinders and the flexural strength of the concrete beams. Additionally, the study sought to compare the performance of control concrete with that of pozzolan concrete variations.
The tests (NDT) were conducted using the ER method to measure the electrical resistance of concrete, as well as the UPV method, both before and after the corrosion acceleration process. The results were then compared with the previous data. The resistivity test was performed using the Wenner four-point method (probe technique). Data were collected three times at each measurement point, and the average values were computed and categorized according to the corrosion classification by Robles et al., 2022. The sides of the concrete specimen were divided into four areas: the left side, which is directly connected to the cable, and the right, top, and bottom sides. This division of points aimed to ensure accurate and uniform results, thereby providing a precise average. The distribution of the points is illustrated in Figure 3.
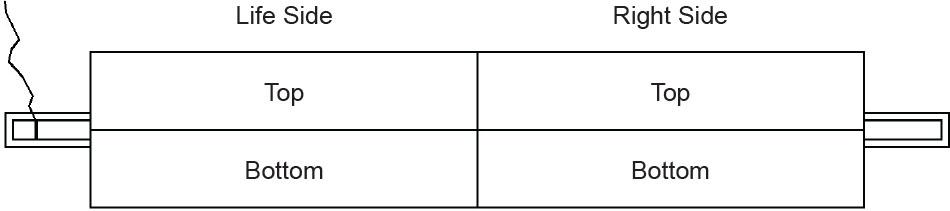
Illustration of the ER testing point
Source: own work.
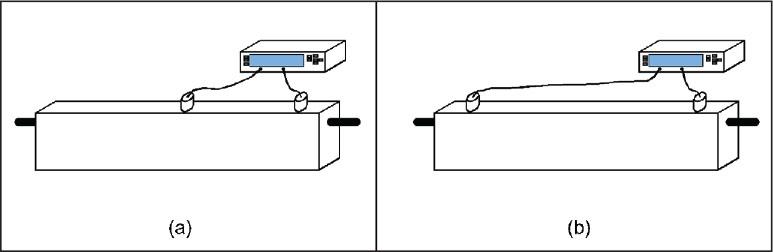
The UPV testing was conducted using a 54 kHz longitudinal wave transducer. The UPV measurements were performed by positioning the two transducers on opposite sides of the specimen (direct method), as shown in Figure 4; on adjacent sides (semi-direct method), as shown in Figure 5; and on the same side (indirect method) (Almasaeid et al., 2022), as shown in Figure 6.
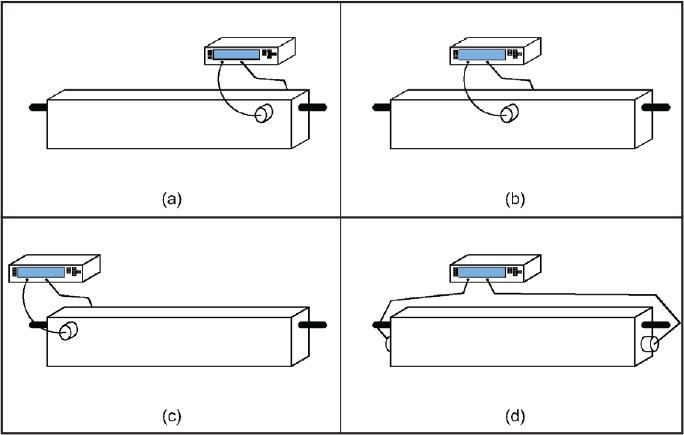
Direct method: a – left, b – center, c – right, d – edge-to-end
Source: own work.
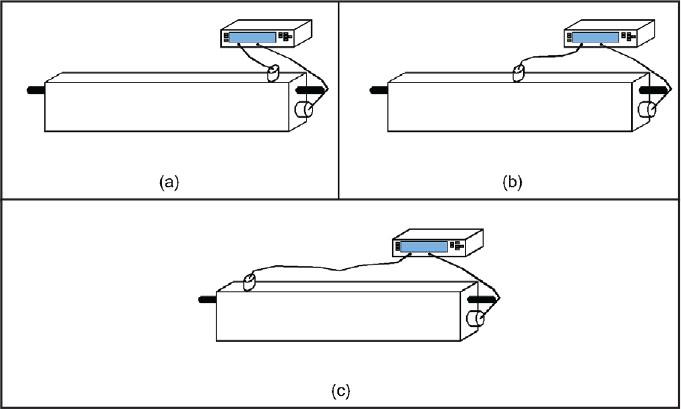
Semi-direct method: a – 5 cm, b – 25 cm, c – 45 cm
Source: own work.
Indirect method: a – 20 cm, b – 40 cm
Source: own work.
Results of corrosion acceleration over 72 h (Fig. 7) indicate a continuous increase in current until the final duration, with variations in the mix. In the control concrete, a decrease in current occurred after 55 h due to the reinforcement connected to the wire no longer being able to effectively conduct the current. Concrete with mixed variations exhibited both lower initial and average current compared to normal concrete. Concrete with the V1-B code, containing 15% of FA and 15% of SF, demonstrated the best corrosion resistance, with an average current of 0.075 A. Using Faraday’s law, the corrosion level and mass loss of the corroded reinforcement can be estimated, as shown in Table 3. Then, the corrosion level values were averaged, as shown in Figure 8.
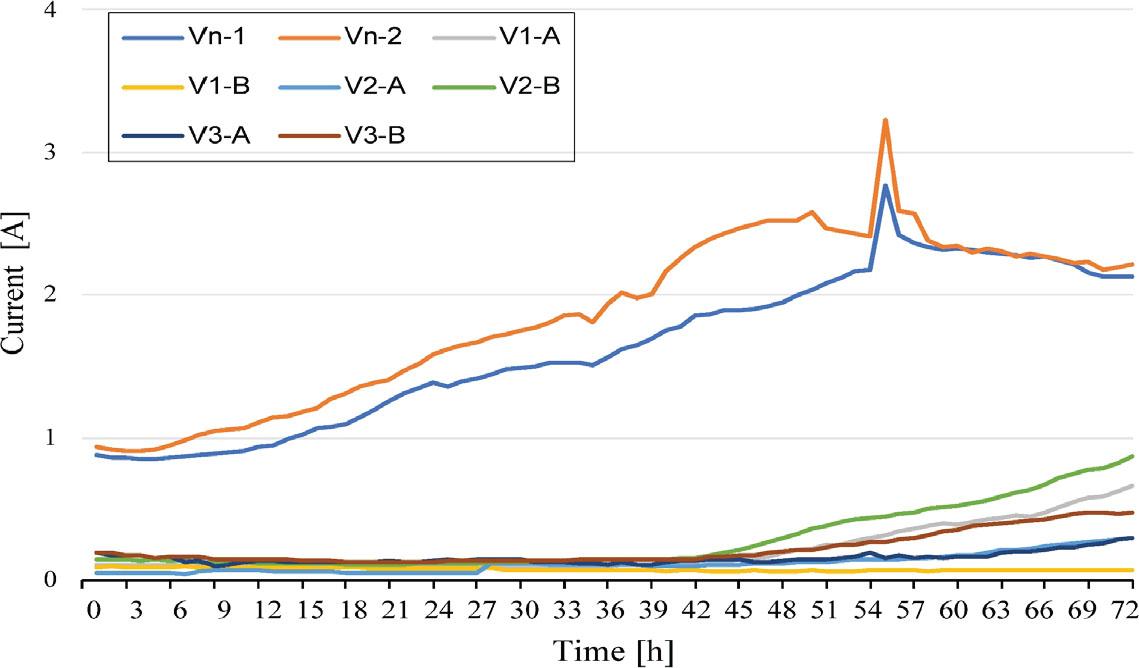
Corrosion acceleration current monitoring results
Source: own work.
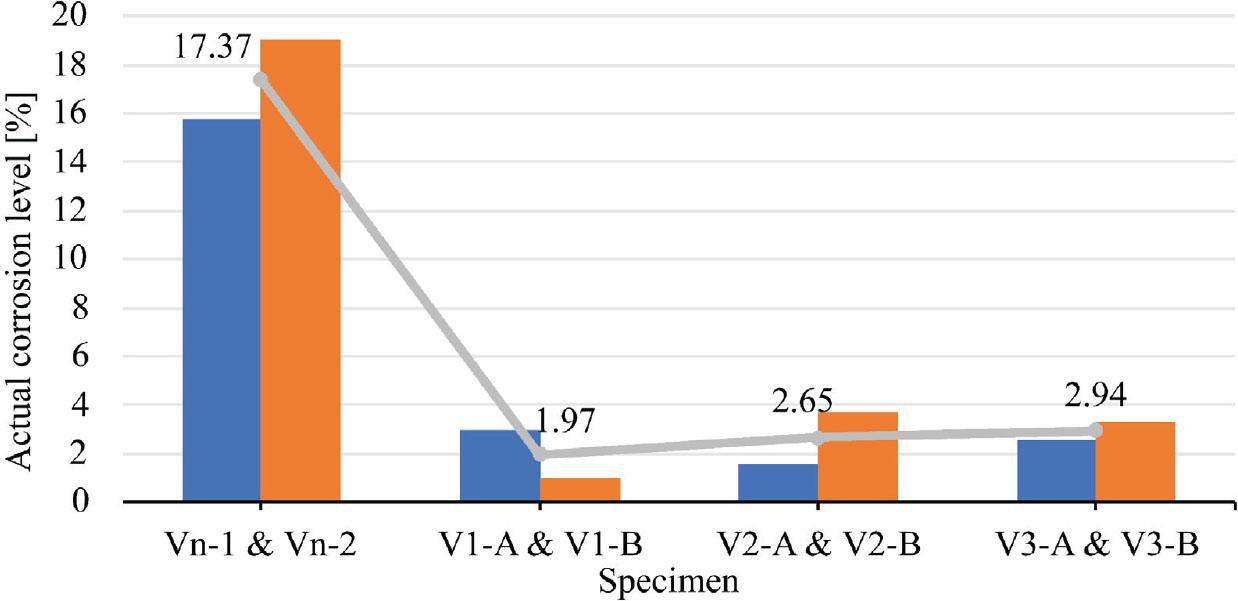
Average actual corrosion level
Source: own work.
Concrete corrosion level
| Specimen | Current [A] | Corrosion duration [h] | Estimated corrosion level [%] | Estimated mass loss [g] | Actual corrosion level [%] | Actual mass loss [g] | Derivation [%] | ||
|---|---|---|---|---|---|---|---|---|---|
| Vn-1 | 1.636 | 72 | 23.893 | 123.049 | 15.73 | 81 | 8.16 | ||
| Vn-2 | 1.861 | 72 | 27.181 | 139.981 | 20.58 | 106 | 6.60 | ||
| V1-A | 0.209 | 72 | 3.082 | 15.721 | 2.94 | 15 | 0.14 | ||
| V1-B | 0.075 | 72 | 1.110 | 5.662 | 1.96 | 10 | 0.85 | ||
| V2-A | 0.118 | 72 | 1.728 | 8.900 | 2.52 | 13 | 0.80 | ||
| V2-B | 0.286 | 72 | 4.213 | 21.487 | 3.73 | 19 | 0.49 | ||
| V3-A | 0.157 | 72 | 2.316 | 11.814 | 2.55 | 13 | 0.23 | ||
| V3-B | 0.221 | 72 | 3.255 | 16.598 | 3.33 | 17 | 0.08 | ||
Source: own work.
Table 3 demonstrates that higher average current values correspond to an increased actual corrosion rate with higher percentages. Figure 8 indicates that normal concrete exhibits a higher corrosion rate compared to concrete incorporating industrial waste and Bacillus subtilis bacteria. Additionally, an increase in average corrosion levels is observed from Variation 1 to Variation 3. Concrete with Variation 1, containing 15% of FA and 15% of SF, showed good performance in resisting chloride ion penetration, though its performance was not significantly different from other pozzolan variations. The use of FA and SF effectively reduces concrete porosity and permeability by enhancing its microstructural quality. The formation of calcium silicate hydrate (CSH) as a product of the pozzolanic reaction plays a crucial role in impeding chloride ion ingress into the concrete (Zhang & Zhang, 2020). Fly ash and silica fume reduce the number of pores and optimize pore size distribution within the concrete. Silica fume contributes to the formation of uniform micro-sized pores, while FA fills larger voids, thereby increasing concrete density (Wang et al., 2021). Moreover, the replacement of sand with bottom ash up to 20% limits chloride ion ingress, enhancing the corrosion resistance of reinforced concrete. However, using more than 20% bottom ash increases porosity and reduces concrete durability, making it unsuitable for aggressive environments (Mh et al., 2020). Measurements of cracks in V1-B concrete revealed the smallest crack width among the specimens, which corresponded to lower current readings during corrosion acceleration. This can be attributed to the 15% SF substitution for cement, which reduces concrete pore volume. The crack widths after corrosion are shown in Table 4.
Crack width measurement
| Specimen | Duration of corrosion [h] | Crack width [mm] | AVG | Actual corrosion level [%] | ||
|---|---|---|---|---|---|---|
| left | middle | right | ||||
| Vn-1 | 72 | 0.65 | 2.50 | 0.75 | 1.30 | 15.73 |
| Vn-2 | 72 | 0.15 | 5.00 | 0.60 | 1.92 | 19.01 |
| V1-A | 72 | 0.75 | 0.25 | 0.10 | 0.37 | 2.94 |
| V1-B | 72 | 0.10 | 0 | 0 | 0.03 | 0.99 |
| V2-A | 72 | 0.20 | 0.20 | 0.15 | 0.18 | 1.57 |
| V2-B | 72 | 0 | 0.80 | 1.00 | 0.60 | 3.73 |
| V3-A | 72 | 0.1 | 0.25 | 0.15 | 0.17 | 2.55 |
| V3-B | 72 | 0.9 | 0.20 | 0.15 | 0.42 | 3.33 |
Source: own work.
Corrosion products generate tensile stress, leading to crack formation (Rodrigues et al., 2021). Concrete containing supplementary materials exhibited smaller crack widths compared to normal concrete. Figure 9 confirms that crack width correlates with the corrosion rate – higher corrosion levels result in more visible damage, including cracking.
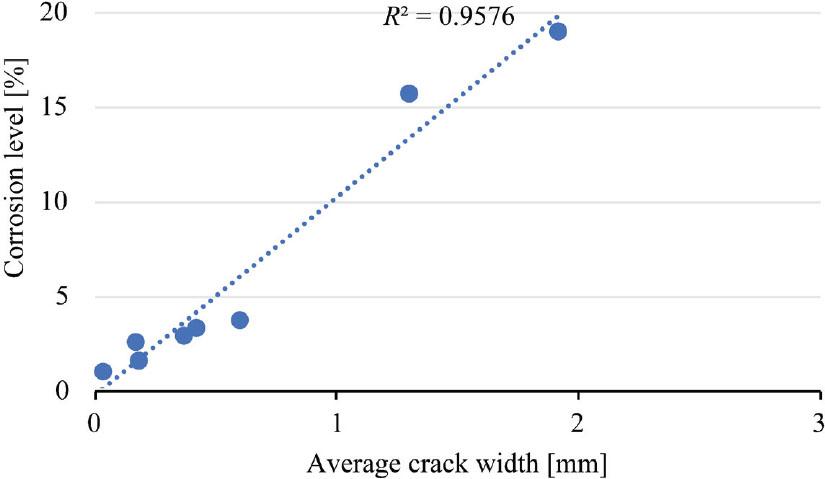
Correlation of corrosion level with crack width
Source: own work.
Biocalcification (microbially induced calcium carbonate precipitation – MICP), facilitated through bacterial biofilm formation, has been shown to enhance mechanical strength and repair concrete cracks by precipitating calcium carbonate. The bacterial biofilm also acts as an effective protective layer, inhibiting steel reinforcement corrosion in corrosive environments (Kanwal et al., 2023).
Figure 10 illustrates the results of ER testing before and after corrosion. The resistivity measurements prior to corrosion categorized the specimens with pozzolan-based admixtures as ranging from negligible to low levels of corrosion risk, with resistivity values between 14.11 kΩ·cm and 20.5 kΩ·cm. In contrast, the control concrete fell into the low-risk category with resistivity values below 20 kΩ·cm. After corrosion, the resistivity values decreased across all specimens. Concrete with pozzolan admixtures shifted to categories ranging from low to moderate, while normal concrete reached the high-risk category (Robles et al., 2022).
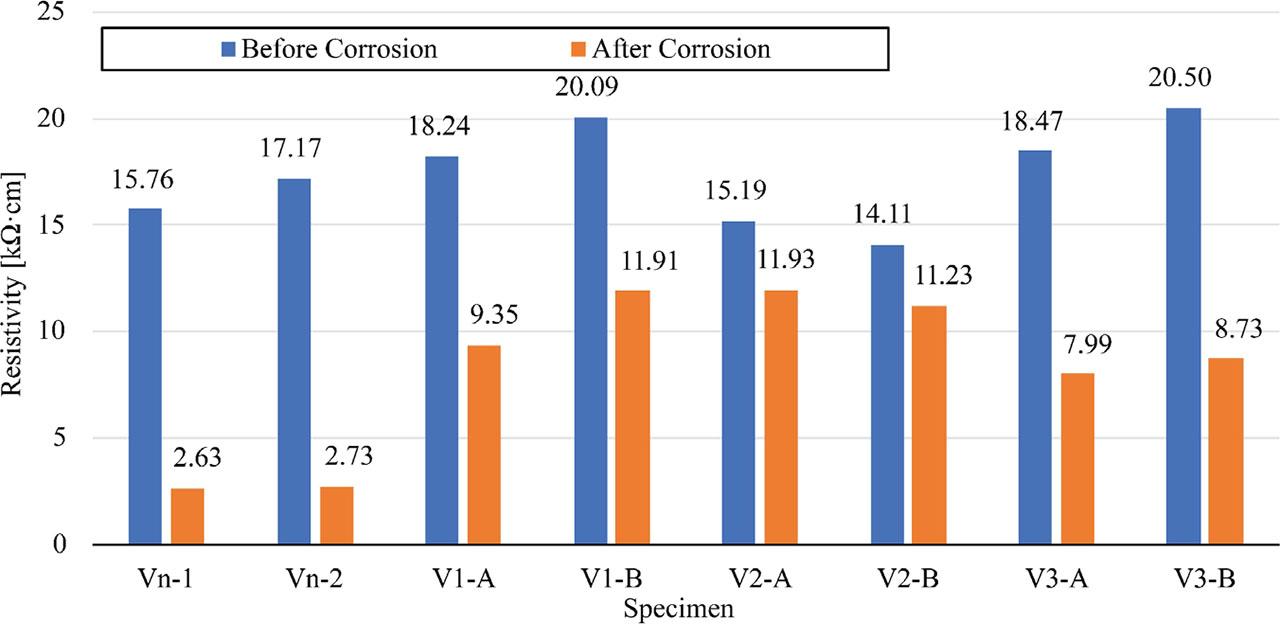
Electrical resistivity result
Source: own work.
Figure 11 shows the differences in wave velocity measured by transducers before and after corrosion. Specimens prior to corrosion demonstrated average wave velocities exceeding 4,500 m·s−1, classified as excellent, while specimens after corrosion exhibited average velocities below 4,500 m·s−1, classified as good (Solís-Carcaño & Moreno, 2008). Specimens containing pozzolan admixtures maintained better structural integrity after corrosion compared to the control concrete. Furthermore, the direct method yielded higher wave velocity values than the semi-direct method, which, in turn, was higher than the indirect method. These findings align with the results reported by Almasaeid et al. (2022). Corrosion-induced microstructural changes in concrete impact wave propagation, with the direct method penetrating deeper into the material and better detecting these changes. This results in higher velocity readings, reflecting a more intact structure compared to the semi-direct and indirect methods, which are more influenced by surface-level damage.
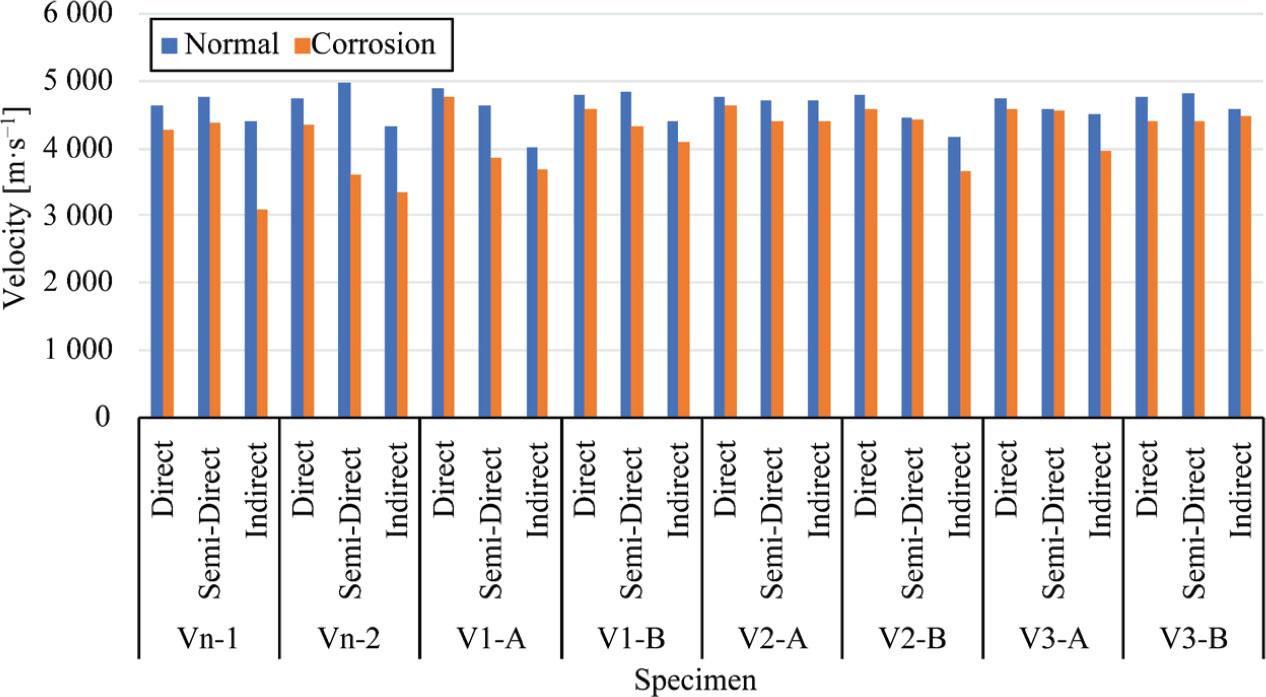
Ultrasonic pulse velocity test results before and after corrosion
Source: own work.
Among all specimens tested using NDT, those with pozzolan-based admixtures exhibited the best corrosion resistance, as evidenced by both ER and UPV results. Although varying degrees of decline were observed in pozzolan specimens, the final ER and UPV readings indicated lower corrosion risks compared to control concrete, aligning with actual corrosion monitoring. This performance is attributed to the positive effects of FA and SF as cement replacements (Anwar et al., 2022) and BA as a sand substitute (Ali et al., 2022), which significantly enhanced corrosion resistance. The test results confirmed that pozzolan-based admixture variations effectively reduced both the risk and rate of corrosion. Figure 12 presents the correlation between UPV testing results (output velocity) and ER testing.
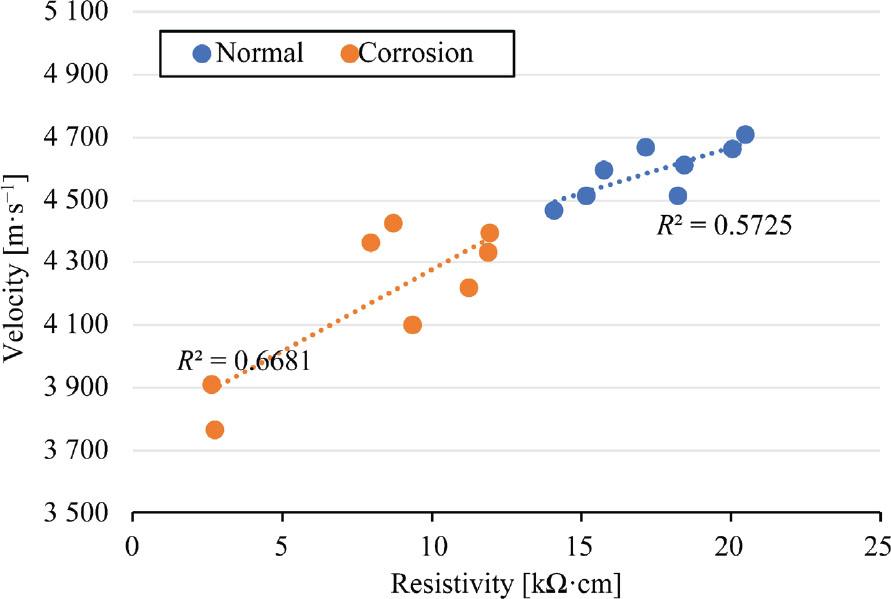
Velocity and resistivity correlation
Source: own work.
The analysis yielded a correlation coefficient of 0.5725 for pre-corrosion testing and 0.6681 for post-corrosion testing. These results indicate that both methods provide comparable parameters for evaluating concrete corrosion.
Compressive strength and flexural strength tests were conducted on specimens aged 28 days. Concrete with a mixture of 25% of FA and 5% of SF achieved the highest average compressive strength, as shown in Figure 13. Similarly, in the flexural strength tests conducted after corrosion acceleration, the same mixture (25% FA and 5% SF) exhibited the highest average flexural strength, as depicted in Figure 14.
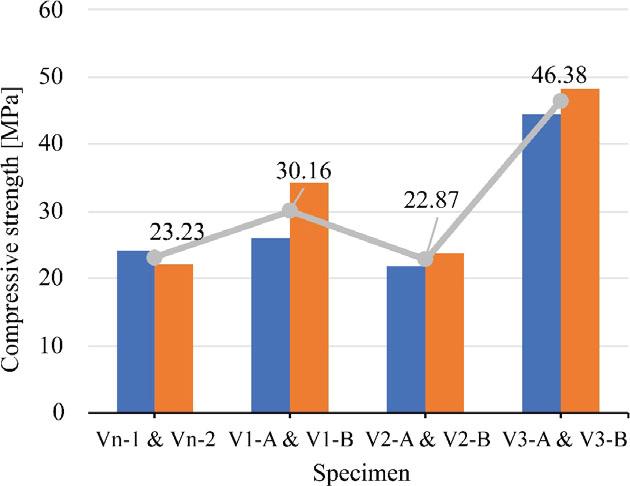
Compressive strength result
Source: own work.
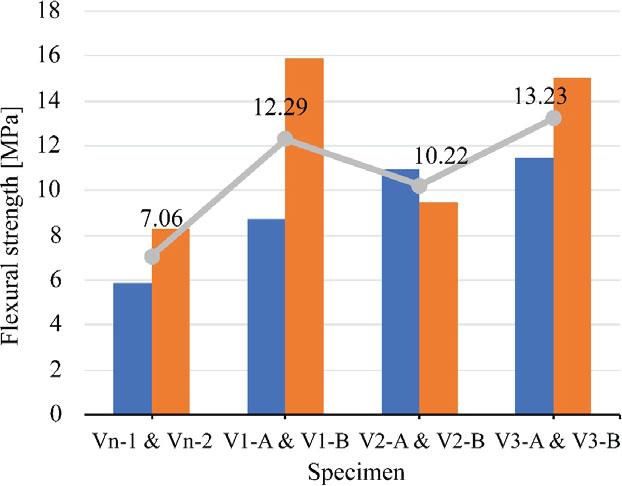
Flexural strength result
Source: own work.
The test results demonstrated that increasing the substitution of FA for cement improves the quality of concrete. SF plays a critical role in enhancing the mechanical properties of concrete through the pozzolanic reaction, while FA minimizes the number of pores and increases concrete density (Falmata et al., 2020). Additionally, the inclusion of Bacillus subtilis bacteria in the concrete mix improved compressive strength and crack resistance. This improvement is attributed to the formation of calcium carbonate, which fills voids and small cracks in the concrete, thereby strengthening the structure (Priyom et al., 2021). Self-compacting concrete (SCC) incorporating up to 20% bottom ash exhibited compressive strength equal to or greater than that of normal concrete. This is due to the fine particles of bottom ash enhancing the density of the concrete (Mh et al., 2020).
Based on the testing results and analysis, the following conclusions can be drawn:
- –
The corrosion acceleration tests demonstrated that specimens incorporating fly ash, bottom ash, silica fume, and Bacillus subtilis bacteria effectively inhibited the rate of corrosion.
- –
Crack dimensions were found to be directly proportional to the current during corrosion acceleration. Control concrete exhibited higher current values compared to concrete with pozzolan admixtures, which corresponded to larger crack sizes.
- –
The resistivity and UPV tests revealed a correlation in estimating the risk of corrosion.
- –
The addition of 15% fly ash, 15% silica fume, 15% bottom ash, 2.5% superplasticizer, and 1% Bacillus subtilis bacteria improved the mechanical properties of the concrete while significantly reducing the rate of corrosion.