
Figure 1:
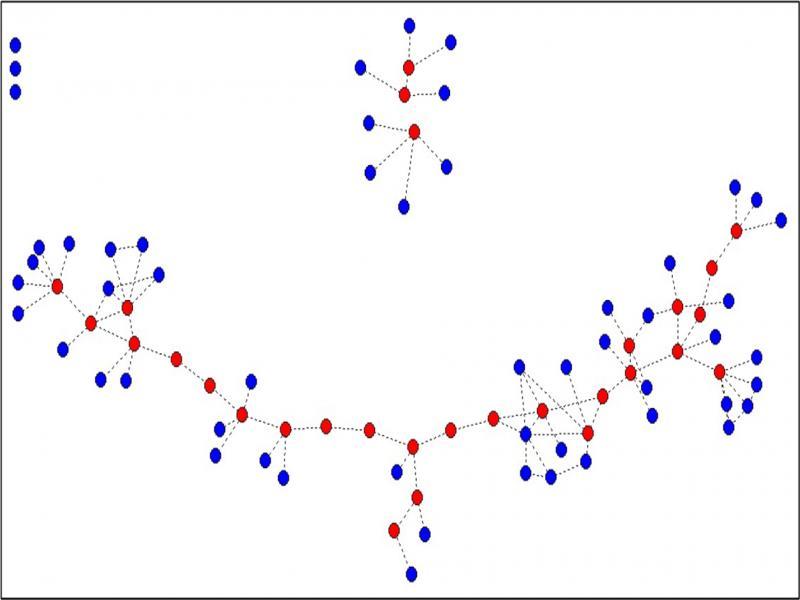
Figure 2:
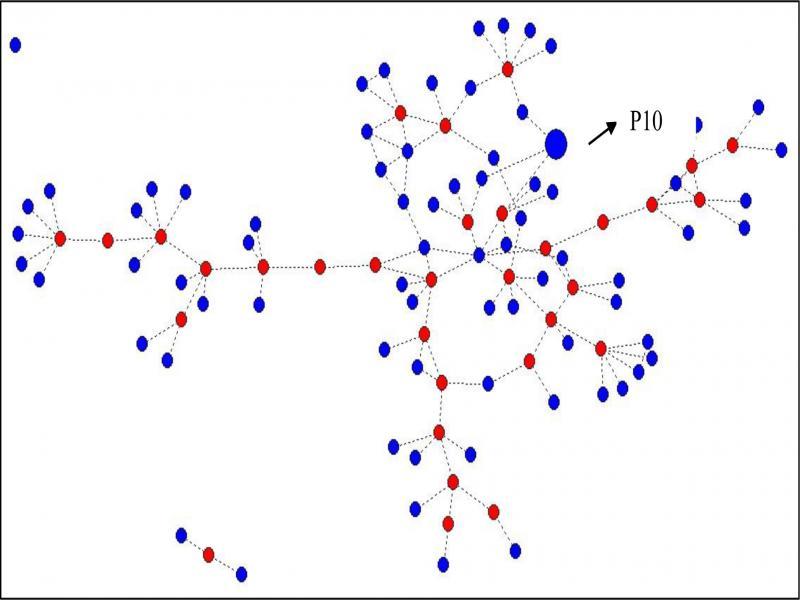
Figure 3:
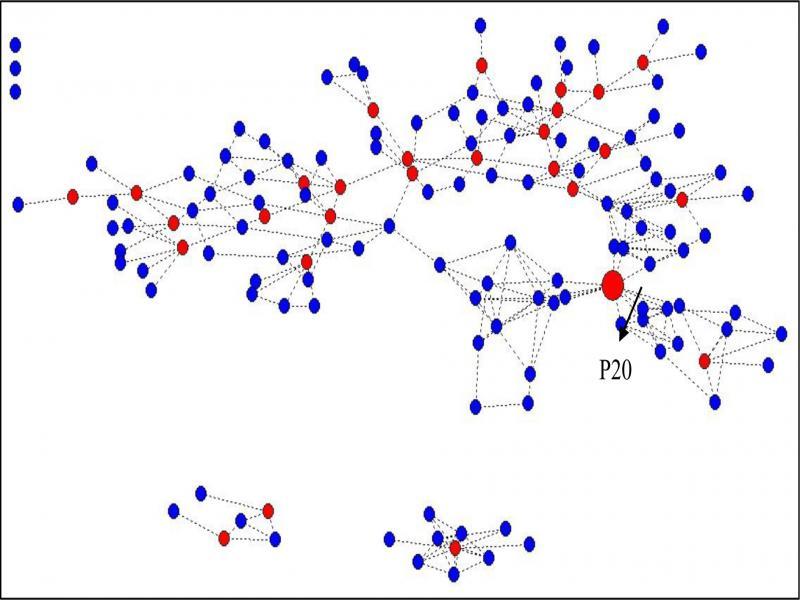
Figure 4:
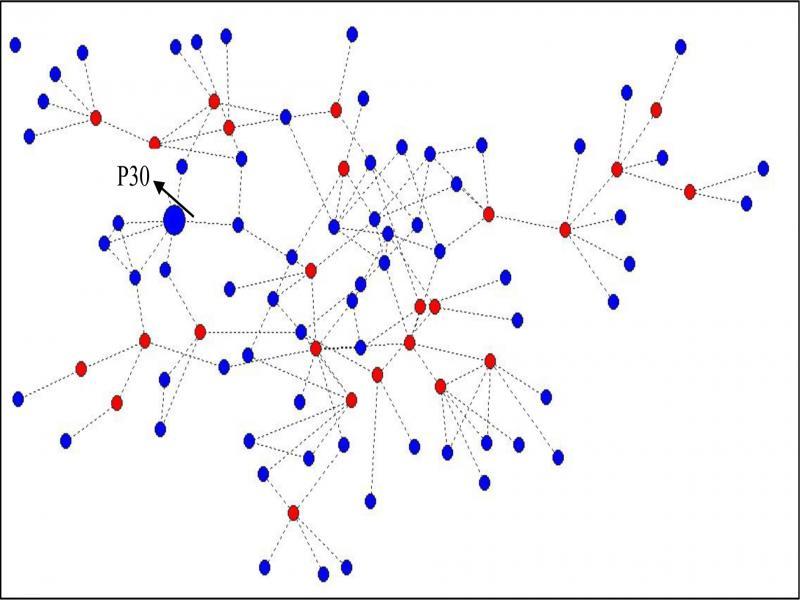
Basic network structure indicators for each cluster
| Government programme | ICDDR,B programme | |||
|---|---|---|---|---|
| Cluster A | Cluster B | Cluster C | Cluster D | |
| Observation | 83 | 106 | 145 | 96 |
| Isolates | 3 | 1 | 3 | 1 |
| Number of components (>2 actors) | 3 | 2 | 3 | 1 |
| Mean no. of connections | 2.2 | 2.3 | 3.5 | 2.7 |
| Proportion of actors with one connection* | 47.0% | 50.0% | 23.4% | 36.5% |
| Density (std. dev.) | 0.3 | 0.2 | 0.4 | 0.2 |
| (0.4) | (0.3) | (0.3) | (0.3) | |
| Total number of bi-components > 2 actors | 5 | 4 | 8 | 4 |
| % of actors in bi-components of > 2 actors | 32.5% | 36.8% | 74.5% | 56.3% |
| No. of nodes acting as cut points in bi-components of > 2 actors | 1 | 1 | 3 | 3 |
| No. of nodes acting as cut points | 29 | 32 | 28 | 25 |
Centrality
| Government programme | ICDDR,B programme | |||
|---|---|---|---|---|
| Cluster A | Cluster B | Cluster C | Cluster D | |
| Degree centrality (std. dev.) | 2.2 (1.6) | 2.3 (1.7) | 3.5 (2.3) | 2.7 (1.8) |
| Max. degree centrality score | 6 | 7 | 12 | 9 |
| Group degree centrality | 4.7% | 4.6% | 3.0% | 6.8% |
Percentage of females in each male social network
| Government programme | % of females | ICDDRB programme | % of females |
|---|---|---|---|
| Cluster A | 2.40% | Cluster C | 22.06% |
| Cluster B | 20.80% | Cluster D | 5.20% |
Homophily
| Government programme | ICDDR,B programme | |||
|---|---|---|---|---|
| Cluster A | Cluster B | Cluster C | Cluster D | |
| Pearson’s correlation between age and social connections | −0.13* | −0.09* | −0.08* | −0.06* |
| Pearson’s correlation between education and social connections | −0.04** | −0.01 | −0.05* | −0.06* |
| Proportion of connections to non-relatives | 66% | 53% | 50% | 64% |
| Proportion of connections outside the village | 29% | 41% | 32% | 33% |
| Pearson’s correlation between a bari residence and social connections | 0.14* | 0.13* | 0.30* | 0.13* |