
Table 1.
Nematicide products used in this study.
| Active ingredient | Concentration (g/L) | Commercial name | Manufacturer | Recommended field rate (ml/l) | Pesticide class | Formulation |
|---|---|---|---|---|---|---|
| Fluopyram | 400 | Velum Prime® SC400 | Bayer CropScience, Germany | 0.6 | Succinate dehydrogenase inhibitor | SC |
| Fosthiazate | 150 | Versus® 150EC | Hektas©, Turkey | 10 | Organophosphate | EC |
| Metam potassium | 510 | Rotabent® | Hektas©, Turkey | 1000 | Dithiocarbamate Salt | SL |
| Fenamiphos | 400 | Nemacur® 400EC | Hektas©, Turkey | 75 | Organophosphate | EC |
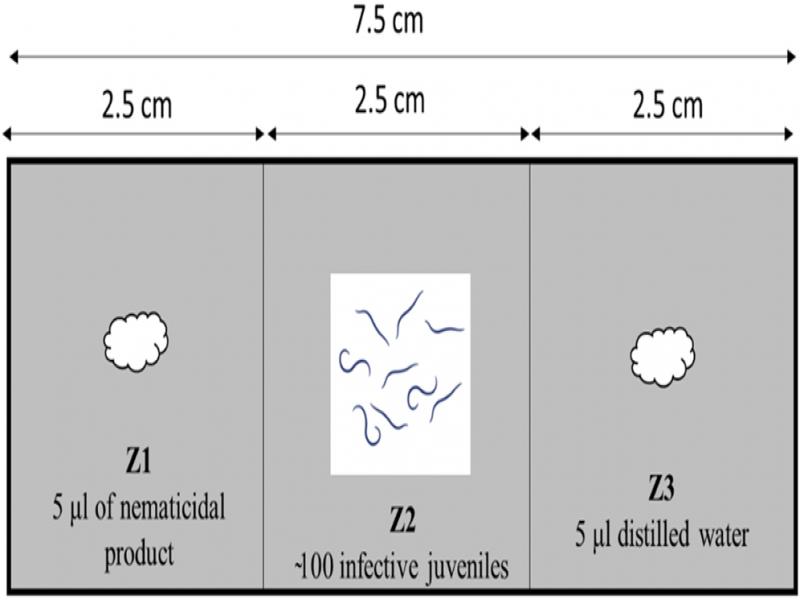
Figure 1:
Experimental design using 7.5 cm glass slides to investigate the response of Heterorhabditis bacteriophora infective juveniles to different concentrations of nematicidal compounds and non-odor control after 3, 6 and 24 h.
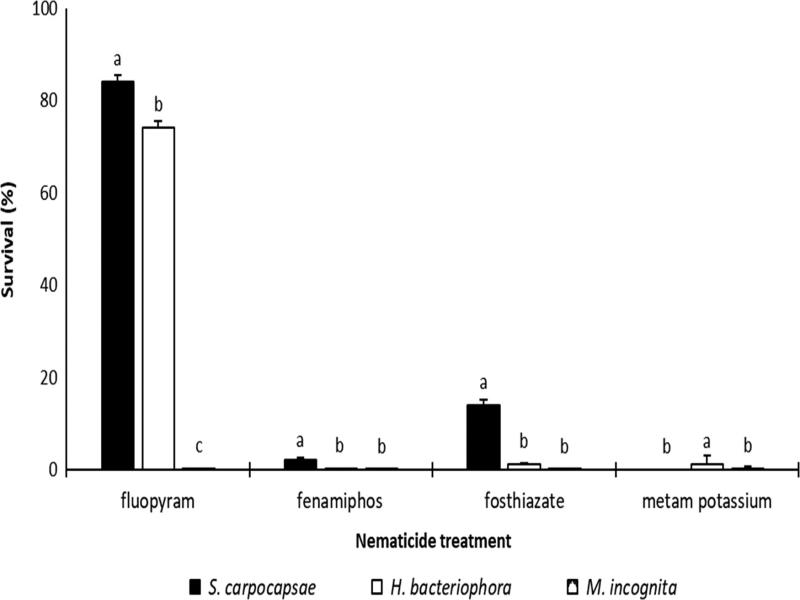
Figure 2:
Comparison of the survival rates (mean ± SE) of different nematode species (Steinernema carpocapsae, Heterorhabditis bacteriophora, and Meloidogyne incognita) after 24-hour exposure to the recommended field rate of the nematicides in 24-well plates. Different letters above bars indicate statistical significance (Tukey’s test P ≤ 0.05).
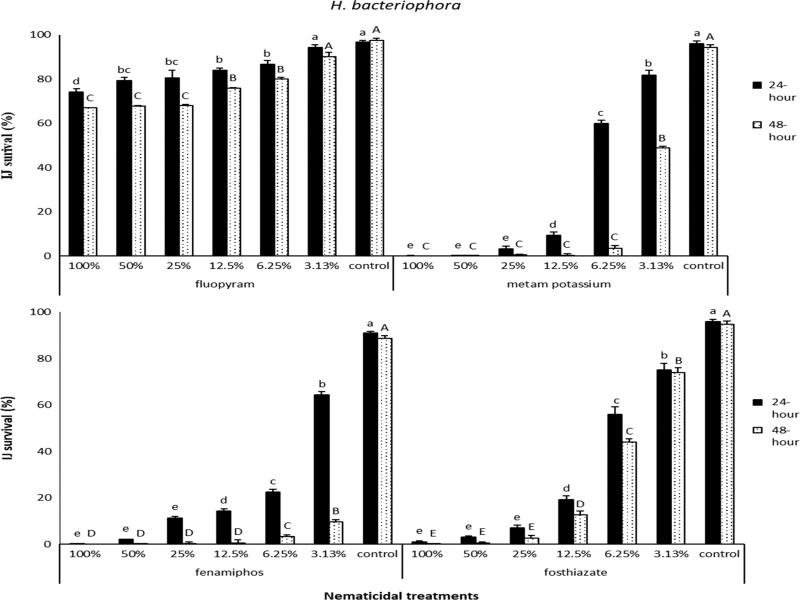
Figure 3:
Survival rates (mean ± SE) of Heterorhabditis bacteriophora infective juveniles (IJ) after 24- and 48-h exposure to each nematicide in wells of 24-well plates. Different letters above bars indicate statistical significance (Tukey’s test P ≤ 0.05). The percentages refer to the rate of the nematicide solutions; that is, 100% is the recommended field rate (see Table 1) and the descending percentages refer to the dilution of the field rate so that 3.13% is the lowest dilution of the nematicide tested.
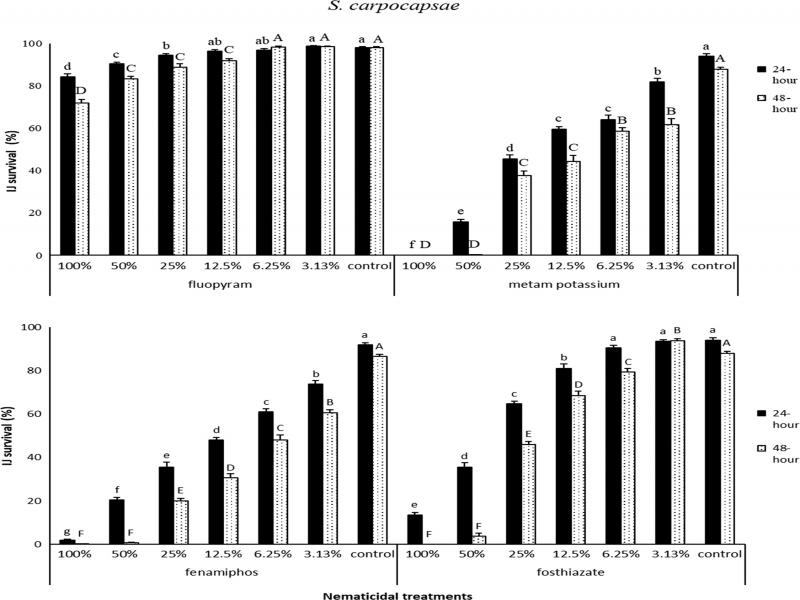
Figure 4:
Survival rates (mean ± SE) of Steinernema carpocapsae infective juveniles (IJ) after 24- and 48-hour exposure to each nematicide in wells of 24-well plates. Different letters above bars indicate statistical significance (Tukey’s test P ≤ 0.05). The percentages refer to the rate of the nematicide solutions; that is, 100% is the recommended field rate (see Table 1) and the descending percentages refer to the dilution of the field rate so that 3.13% is the lowest dilution of the nematicide tested.
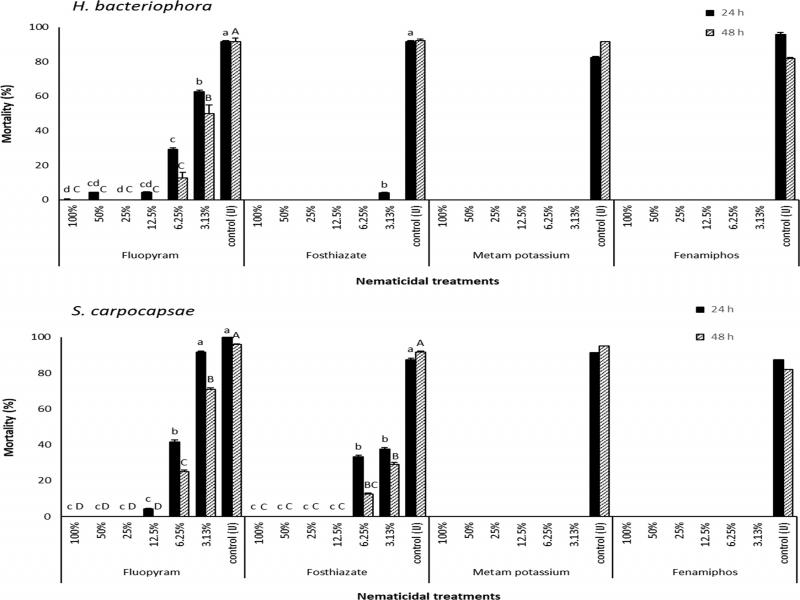
Figure 5:
Mortality of Galleria mellonella (mean ± SE) after exposure to nematicide-treated Heterorhabditis bacteriophora and Steinernema carpocapsae infective juveniles.
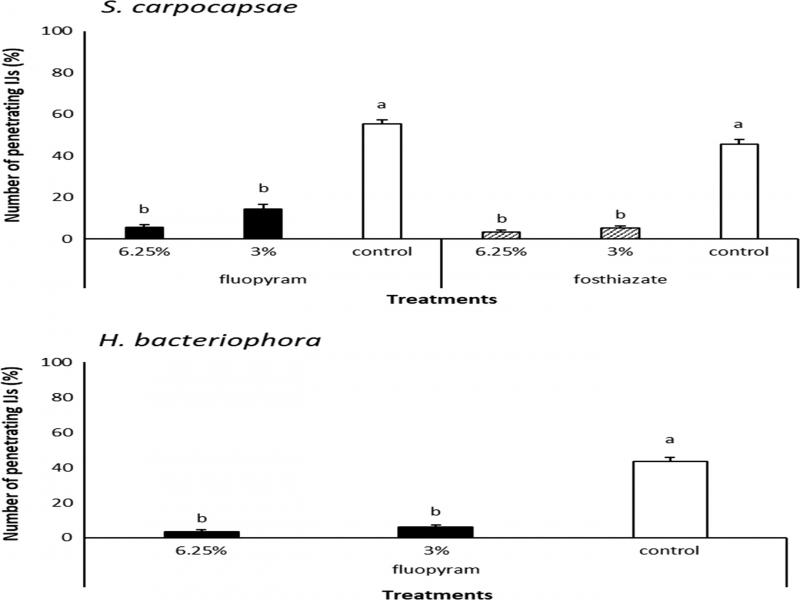
Figure 6:
Percentage (± SE) number of Steinernema carpocapsae and Heterorhabditis bacteriophora infective juveniles (IJ) invading the insect host (Galleria mellonella) after 24-hour exposure to nematicides. Different letters above bars indicate statistical significance (Tukey’s test P ≤ 0.05).
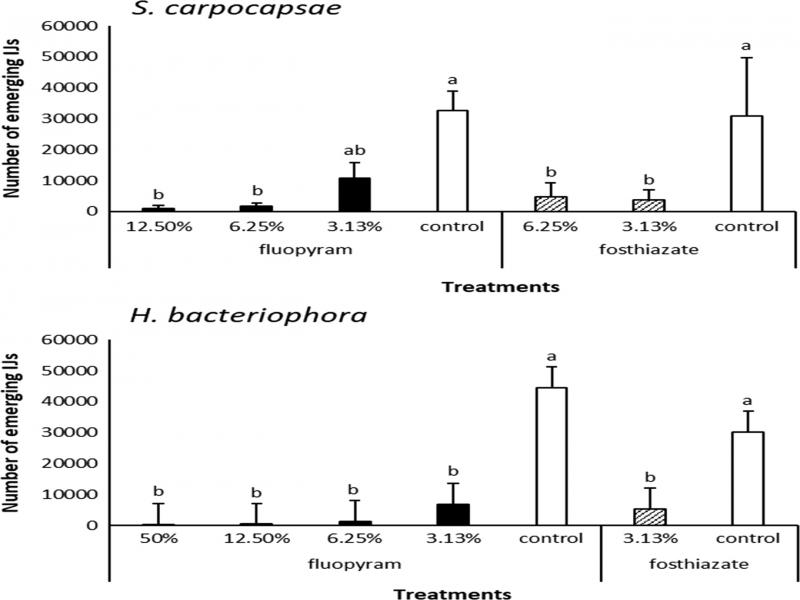
Figure 7:
Mean (± SE) number of Steinernema carpocapsae and Heterorhabditis bacteriophora infective juveniles (IJs) emerging from the insect host (Galleria mellonella) after 24-hour exposure to nematicides. Different letters above bars indicate statistical significance (Tukey’s test P ≤ 0.05).
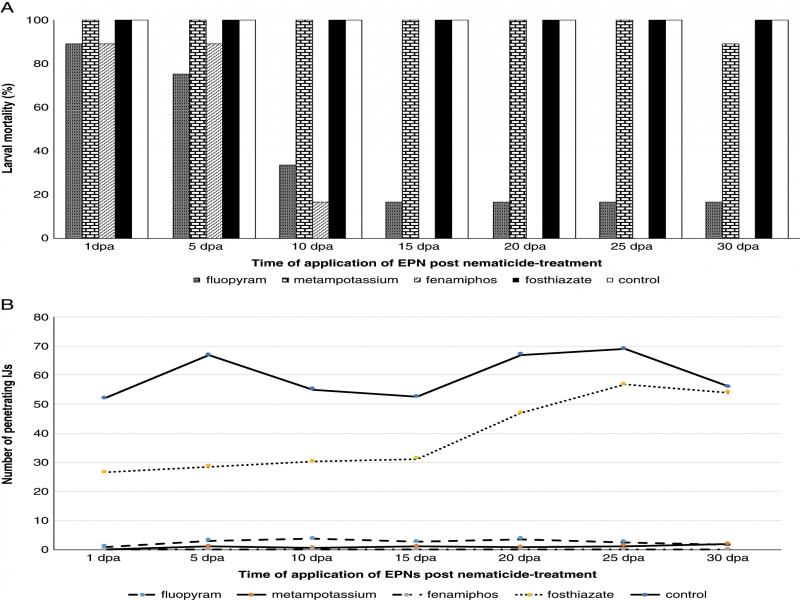
Figure 8:
Mortality of Galleria mellonella (A) and the number of Steinernema carpocapsae infective juveniles (IJs) penetrating the insect host (B) after exposure to nematicides at different time periods.
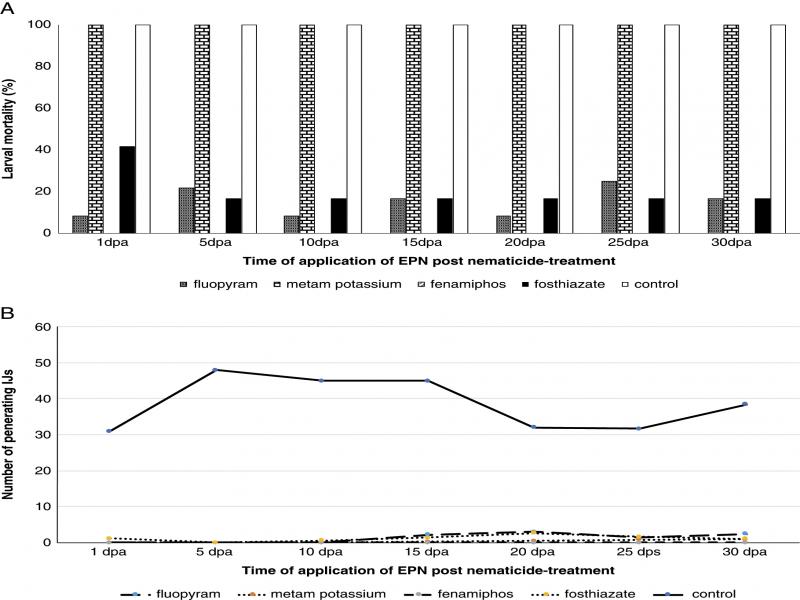
Figure 9:
Mortality of Galleria mellonella (A) and the number of Heterorhabditis bacteriophora infective juveniles (IJs) penetrating the insect host (B) after exposure to nematicides at different time periods.
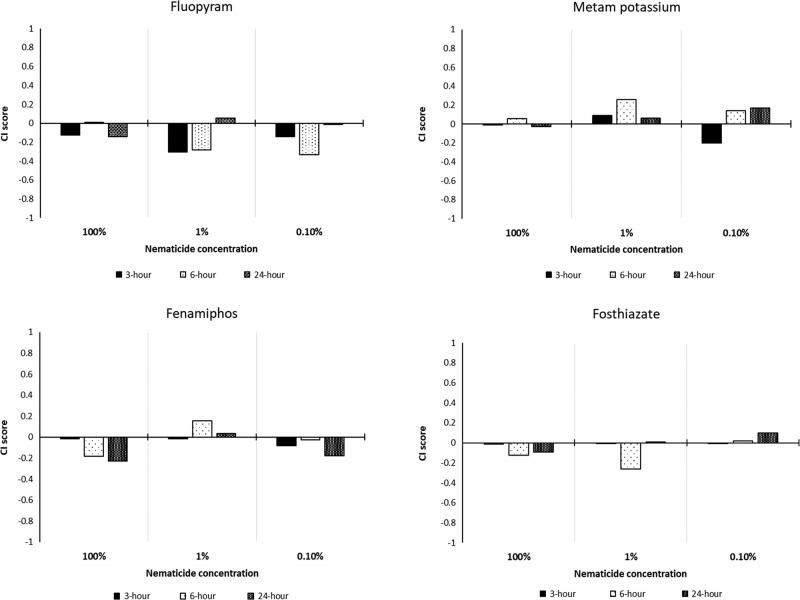
Figure 10:
Response of Heterorhabditis bacteriophora to different concentrations of nematicidal compounds and non-treated control (distilled water) after 3, 6 and 24 h. A CI score close to −1 shows a high aversion, 0 shows neutrality, and + 1 shows a strong attraction.