
Table 1.
EC50 (±S.E.) values of pyrantel, bephenium, and morantel in the presence of GABA and carvacrol.
| Control | GABA 3 μM | GABA 3 μM + Carvacrol 100 μM | Wash | |
|---|---|---|---|---|
| Pyrantel (nM) | 8.44 ± 1.56 | 28.11 ± 1.61**** | 44.62 ± 2.70****++++ | 20.51 ± 2.34***oooo |
| Bephenium (μM) | 0.62 ± 0.11 | 0.96 ± 0.21 | 1.40 ± 0.12*** | 1.32 ± 0.09** |
| Morantel (nM) | 3.72 ± 1.73 | 5.69 ± 2.12 | 7.94 ± 2.35 | 15.81 ± 4.03*+ |
1 Notes: *Statistically significant difference compared to control (***p < 0.0001; ***p = 0.0007; ***p = 0.0008; **p = 0.0032; *p = 0.0108); +statistically significant difference compared to GABA 3 μM (++++ p < 0.0001; + p = 0.0429); ostatistically significant difference compared to GABA 3 μM + Carvacrol 100 μM (oooo p < 0.0001).
Table 2.
R max (g ± S.E.) values of pyrantel, bephenium, and morantel in the presence of GABA and carvacrol.
| Control | GABA 3 μM | GABA 3 μM + Carvacrol 100 μM | Wash | |
|---|---|---|---|---|
| Pyrantel | 1.52 ± 0.12 | 1.38 ± 0.20 | 0.47 ± 0.15****+++ | 0.77 ± 0.17**+ |
| Bephenium | 2.20 ± 0.30 | 2.18 ± 0.34 | 0.89 ± 0.22**++ | 1.15 ± 0.23*+ |
| Morantel | 1.16 ± 0.07 | 0.99 ± 0.11 | 0.39 ± 0.11****+++ | 0.59 ± 0.15***o |
1 Notes: *Statistically significant difference compared to control (****p < 0.0001; ***p = 0.0007; **p = 0.0448; **p = 0.0062; *p = 0.0475); + statistically significant difference compared to GABA 3 μM (+++ p = 0.0008; + p = 0.0429; ++ p = 0.0072; + p = 0.0475; +++ p = 0.0003); ostatistically significant difference compared to GABA 3 μM + Carvacrol 100 μM (o p = 0.0298).
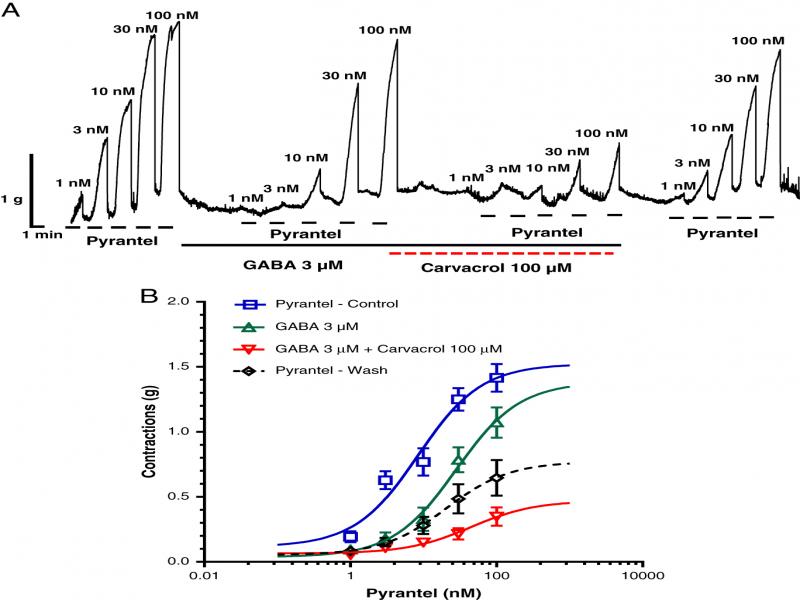
Figure 1:
A Original recording of isometric contractions of A. suum muscle flap induced by increasing concentrations of pyrantel and the effect of GABA (3 μM) and Carvacrol (100 μM) on those contractions; B the concentration-response plot for pyrantel control (n = 6, blue), in the presence of GABA 3 μM (n = 6, green), in the presence of GABA and Carvacrol 100 μM (n = 6, red) and after washing (n = 6, dashed black) (mean ± S.E.).
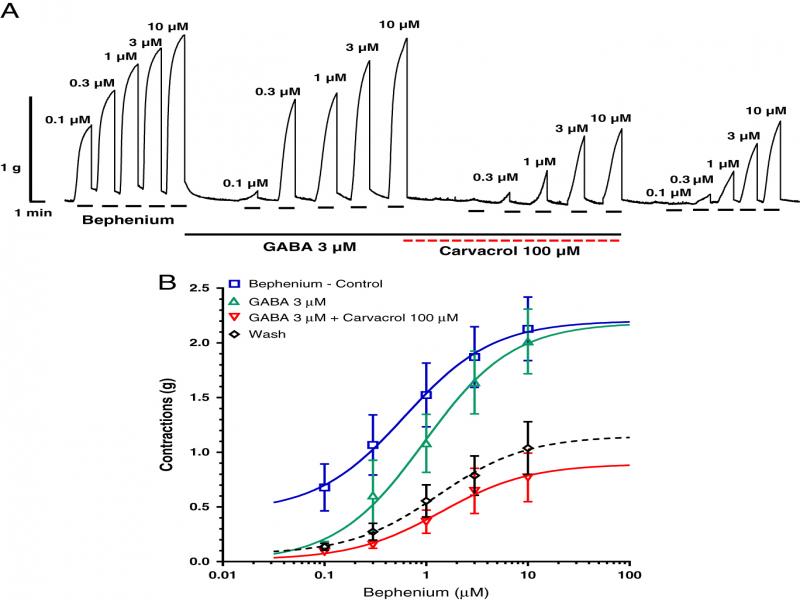
Figure 2:
A Original recording of isometric contractions of A. suum muscle flap induced by increasing concentrations of bephenium and the effect of GABA (3 μM) and Carvacrol (100 μM) on those contractions; B the concentration-response plot for bephenium control (n = 6, blue), in the presence of GABA 3 μM (n = 6, green), in the presence of GABA and Carvacrol 100 μM (n = 6, red) and after washing (n = 6, dashed black) (mean ± S.E.).
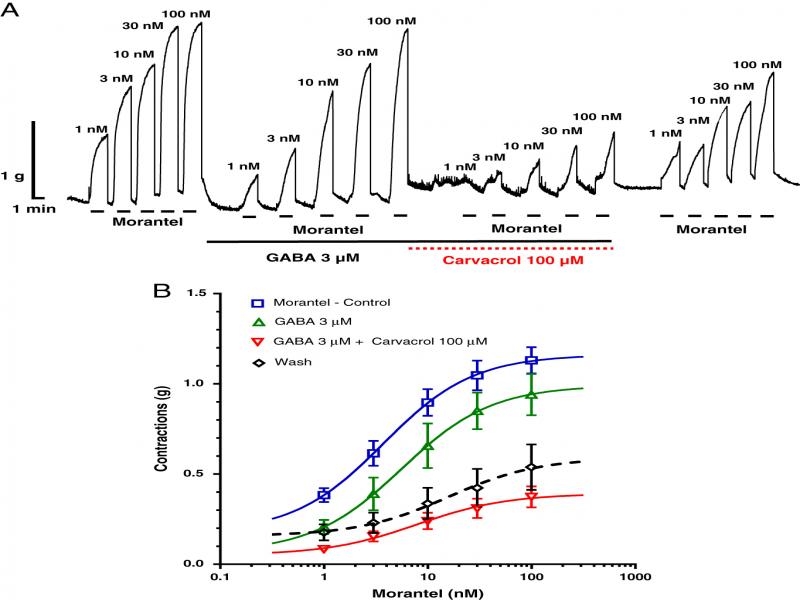
Figure 3:
A Original recording of isometric contractions of A. suum muscle flap induced by increasing concentrations of morantel and the effect of GABA (3 μM) and carvacrol (100 μM) on those contractions; B the concentration-response plot for morantel control (n = 6, blue), in the presence of GABA 3 μM (n = 6, green), in the presence of GABA and carvacrol 100 μM (n = 6, red) and after washing (n = 6, dashed black) (mean ± S.E.).