
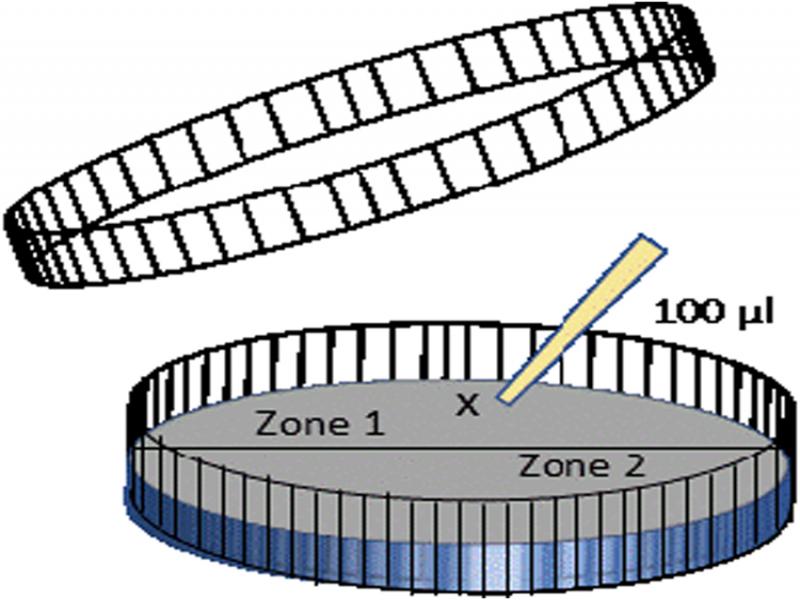
Figure 1:
Scheme of the experimental design used to follow the effect of bacterial grazer displacement. Petri dishes (90 mm diameter) were filled with agarose medium containing 1 mM of sodium phytate or inorganic phosphate. The inoculum (100 µL) was placed at a single point of the dish, marked ‘x’. After three weeks, Petri dishes were open and the agarose was separated in two parts called zones 1 and 2.
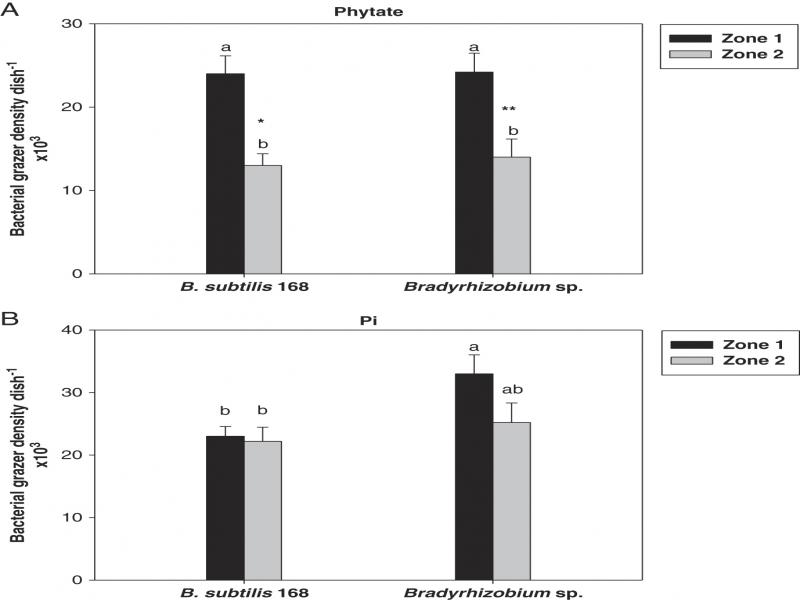
Figure 2:
Bacterial grazer populations of Acrobeloides sp. previously fed on B. subtilis 168 or Bradyrhizobium sp. measured throughout the zones 1 and 2 after inoculation at a single point located at the top of zone 1 and grown either with phytate (A) or Pi (B) as the P source. Data are means (±SE, n = 5). The same lowercase letters indicate a lack of significance (p < 0.05) within the same zone of the Petri dish. Stars above a bar indicate a significant difference between the two P sources (*p < 0.05; **p < 0.01) for the same zone.
Table 1.
The total numbers of Acrobeloides sp. individuals according to the co-inoculated bacterial species, B. subtilis 168 or Bradyrhizobium sp., and the source of P supplied into the medium, phytate or Pi.
| Bacterial strains | |||
|---|---|---|---|
| Parameters | Source of P | B. subtilis 168 | Bradyrhizobium sp. |
| Numbers | Phytate | 38.0 × 10³ ± 2.84 × 10³bA | 39.7 × 10³ ± 1.42 × 10³bB |
| Pi | 45.9 × 10³ ± 2.28 × 10³bA | 62.1 × 10³ ± 4.02 × 10³aA | |
| Ratio | Phy/Pi | 0.83 ± 0.07a | 0.64 ± 0.03b |
1 Notes: The ratio of individuals counted in the phytate and Pi medium for each bacterium is also given. Data are means (SE, n = 5). The letters indicate significant differences of means between the bacterial species (lowercase) or the source of P within a same bacterium treatment (uppercase) at p < 0.05.
Table 2.
Ratio of multiplication of Acrobeloides sp. fed on B. subtilis 168 or Bradyrhizobium sp. and grown with phytate or Pi as the sole source of P, calculated by dividing the total numbers of nematodes counted after three weeks by the initial number inoculated in zone 1 (100 individuals).
| Source of P | ||
|---|---|---|
| Bacterial strains | Phytate | Pi |
| B. subtilis 168 | 379.9 ± 28.4b | 459 ± 22.9b |
| Bradyrhizobium sp. | 396.9 ± 14.2b | 621 ± 40.2a |
| Bacterial effect | *** | |
Table 3.
Evolution of bacterial populations of B. subtilis 168 or Bradyrhizobium sp. throughout the zones 1 and 2 after inoculation at a single point located at the top of zone 1 either in absence (−N) or in presence (+N) of bacterial grazers.
| B. subtilis 168 | Bradyrhizobium sp. | ||||
|---|---|---|---|---|---|
| P source | Bacterial grazers | Zone 1 | Zone 2 | Zone 1 | Zone 2 |
| Phytate | −N | 9.08 × 10⁶ (1.90 × 10⁶)a | 0.60 × 10⁶ (0.04 × 10⁶)b** | 6.42 × 10⁶ (2.90 × 10⁶)a | 0.20 × 10⁶ (0.09 × 10⁶)b** |
| Phytate | +N | 5.50 × 10⁶ (0.85 × 10⁶)a | 3.45 × 10⁶ (0.61 × 10⁶)ab | 1.80 × 10⁶ (0.30 × 10⁶)b | 1.52 × 10⁶ (0.20 × 10⁶)b |
| Pi | −N | 27.2 × 10⁶ (12 × 106)a | 0.07 × 10⁶ (0.04 × 10⁶)b** | 41.9 × 10⁶ (7 × 10⁶)a** | 0.20 × 10⁶ (0.15 × 10⁶)b** |
| Pi | +N | 3.40 × 10⁶ (0.38 × 10⁶)a | 2.20 × 10⁶ (0.41 × 10⁶)ab | 1.59 × 10⁶ (0.18 × 10⁶)b | 1.59 × 10⁶ (0.29 × 10⁶)b |
Table 4.
Total bacterial cells according to the P source (phytate or Pi) and the absence (−N) or the presence (+N) of Acrobeloides sp.
| Bacterial strains | ||||
|---|---|---|---|---|
| Parameters | P source | Bacterial grazers | B. subtilis 168 | Bradyrhizobium sp. |
| Numbers | Phytate | −N | 9.67 × 10⁶ (1.81 × 10⁶)a | 6.62 × 10⁶ (2.13 × 10⁶)b |
| Phytate | +N | 8.92 × 10⁶ (1.01 × 10⁶)a | 3.28 × 10⁶ (0.43 × 10⁶)b | |
| Grazing effect | NS | NS | ||
| Pi | −N | 28.1 × 10⁶ (13.7 × 10⁶)a | 42.2 × 10⁶ (8.87 × 10⁶)a | |
| Pi | +N | 5.44 × 10⁶ (0.51 × 10⁶)a | 2.84 × 10⁶ (0.46 × 10⁶)b | |
| Grazing effect | * | *** | ||
| Ratio | Phytate/Pi | −N | 0.20 ± 0.06b | 0.11 ± 0.04b |
| Phytate/Pi | +N | 1.63 ± 0.12a | 1.35 ± 0.04a | |
| Grazing effect | *** | ** | ||
1 Notes: The ratio of bacteria counted in the phytate and Pi medium with or without nematodes is also given. Data are means (SE, n = 5). The letters indicate significant differences of means between the bacterial species within each condition (p < 0.05); stars (*p < 0.05; **p < 0.01; ***p < 0.001) indicate significant differences between presence and absence of nematodes (grazing effect).
Table 5.
Total amounts of free Pi mineralized by each bacterial strain and expressed in µg of free Pi per million of bacterial cells grown in absence (−N) or in presence (+N) of nematodes.
| Bacterial strains | ||
|---|---|---|
| Bacterial grazers | B. subtilis 168 | Bradyrhizobium sp. |
| −N | 0.95 ± 0.21a | 3.71 ± 1.73a |
| +N | 31.26 ± 3.67a | 18.96 ± 0.86b |
| Grazing effect | *** | *** |
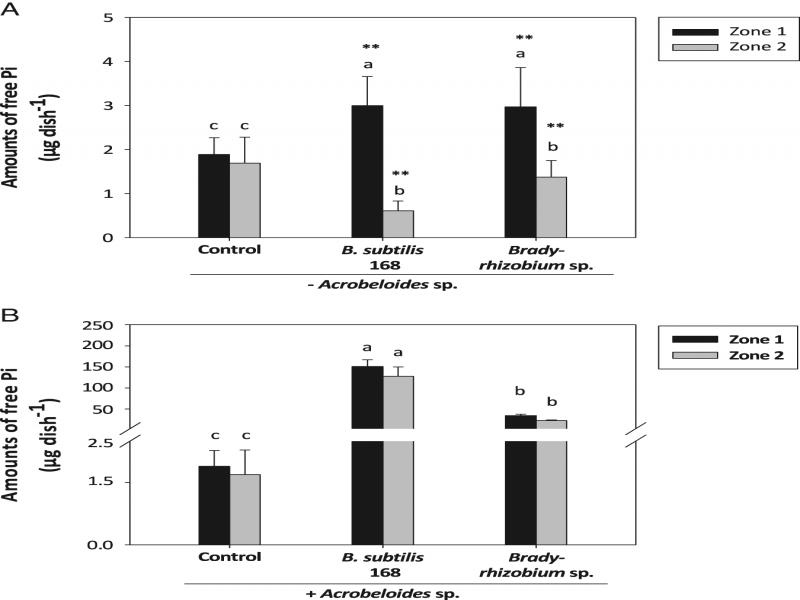
Figure 3:
Effect of grazing activities by Acrobeloides sp. nematodes on phytate mineralization catalyzed either by B. subtilis 168 or Bradyrhizobium sp. Shown are the free Pi amounts extracted from zones 1 or 2 after three weeks of incubation with phytate as the sole source of P in absence (A) or in presence (B) of nematodes. Bacteria (A) or nematodes (B) were inoculated at a single point located at the top of zone 1 with nematodes previously fed on each bacterial strain. Control treatment (Ctrl) consisted of water deposit instead of bacteria or nematodes. Data are means (±SE, n = 5). The same lowercase letters indicate a lack of significance (p < 0.05) within the same zone of the Petri dish. Stars above a bar indicate a significant difference between the absence/presence of Acrobeloides sp. (*p < 0.05; **p < 0.01) within each zone and bacterial strain.