
Table 1.
Trial names, trial year, number of accession lines and types of sugarcane populations screened for root-knot nematode (Meloidogyne javanica) resistance from 2012 to 2019.
| Trial name | Trial year | Number of accession lines | Source |
|---|---|---|---|
| Nem19-1 | 2019 | 42 | Core breeding program |
| Nem18-1 | 2018 | 56 | Core breeding program |
| Nem17-1 | 2017 | 56 | Core breeding program |
| Nem16-2 | 2016 | 95 | Introgression population |
| Nem15-1 | 2015 | 112 | Introgression population |
| Nem13-1 | 2013 | 138 | Introgression population |
| Nem13-2 | 2013 | 155 | Introgression population |
| Nem12-1 | 2012 | 148 | Introgression population |
| Total accession lines | – | 802 | – |
Table 2.
List of 22 sugarcane accession lines used in multiple trials with root biomass, and nematode resistance parameters.
| Accession | Type | No. of trialsa | Root biomass (g) | Relative eggs per plante (%) | Relative eggs per g root (%) | Visual gall rating |
|---|---|---|---|---|---|---|
| IJ76-333 | Erianthus spb | 5 | 25.3±12.5d | 12.4±2.19 | 25.6±18.99 | 1.3±0.06 |
| IJ76-370 | Erianthus sp | 5 | 23.2±11.16 | 10.7±1.19 | 7.8±3.26 | 1.1±0.1 |
| KQ228 | Core | 8 | 21.0±7.66 | 43.2±6.62 | 23.6±9.1 | 2.6±0.17 |
| Q135c | Core | 7 | 12.9±4.78 | 125.2±27.71 | 145.0±67.32 | 3.2±0.2 |
| Q138 | Core | 7 | 15.2±4.61 | 40.0±8.68 | 25.5±10.19 | 2.7±0.35 |
| Q183 | Core | 4 | 6.8±4.14 | 67.8±11.13 | 74.9±37.44 | 3.0±0.19 |
| Q200 | Core | 6 | 10.9±5.07 | 144.2±43.27 | 115.7±40.94 | 2.9±0.2 |
| Q208c | Core | 8 | 16.2±5.02 | 77.9±8.56 | 60.6±28.92 | 3.0±0.23 |
| Q231 | Core | 4 | 17.6±12.07 | 36.4±14.26 | 16.6±10.16 | 3.0±0.51 |
| Q232 | Core | 6 | 14.3±5.13 | 55.5±14.06 | 43.8±21.41 | 2.7±0.31 |
| Q238 | Core | 4 | 16.2±7.96 | 53.5±14.84 | 25.8±12.79 | 3.4±0.18 |
| Q240 | Core | 5 | 20.4±6.38 | 101.4±25.49 | 29.0±13.63 | 2.8±0.3 |
| Q241 | Core | 4 | 8.0±6.59 | 30.8±8.73 | 88.1±49.45 | 3.1±0.43 |
| Q242 | Core | 4 | 11.8±6.31 | 64.6±28.2 | 30.5±14.41 | 3.0±0.57 |
| Q245 | Core | 6 | 9.4±4.78 | 45.7±7.38 | 58.9±28.38 | 2.7±0.25 |
| Q248 | Core | 4 | 16.2±8.99 | 139.2±35.96 | 51.5±24.73 | 3.3±0.28 |
| Q249 | Core | 4 | 13.1±7.65 | 24.6±3.16 | 17.0±10.41 | 3.0±0.34 |
| Q251 | Core | 4 | 12.6±4.82 | 90.1±21.37 | 30.7±11.44 | 2.7±0.37 |
| QBYN05-20563 | Introgression | 4 | 24.1±3.03 | 11.7±3.4 | 3.7±1.83 | 2.6±0.22 |
| SRA1 | Core | 4 | 6.2±3.65 | 43.2±11.22 | 81.7±57.66 | 2.7±0.24 |
| SRA2 | Core | 4 | 3.5±1.66 | 43.9±12.05 | 79.9±46.09 | 2.4±0.14 |
| SRA3 | Core | 4 | 8.5±5.13 | 60.7±14.42 | 89.0±63.14 | 2.9±0.4 |
1 Notes: aNumber of trials the accession was included; bwild relative of sugarcane; csusceptible controls; dMean±SE; erelative eggs/plant or g root = T/S×100, where T is mean eggs per plant or g root for test accession line, and S is mean eggs per plant or g root for two susceptible controls (Q208 and Q135).
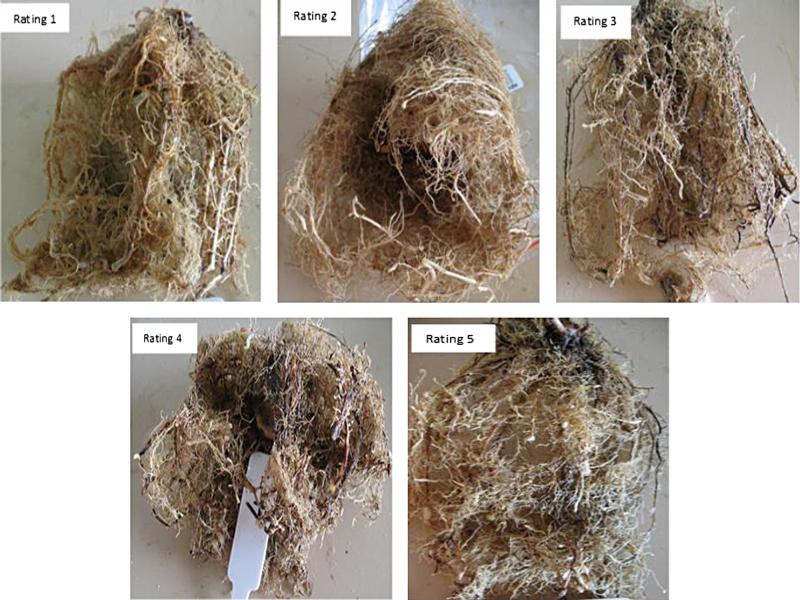
Figure 1:
Examples of root-knot nematode gall ratings for sugarcane based on percentage of root system with galls. 1 = ≤1 to 2%, 2 = 2 to 25%, 3 = 25 to 50%, 4 = 51 to 75%, 5 ≥ 75% (modified from Shepherd 1979).
Table 3.
Coefficient of variance (%) among shoot biomass, root biomass, visual ratings, number of eggs per plant and number of eggs per g of roots in each trial.
| Trial name | Shoot biomass | Root biomass | Visual rating | Eggs per plant | Eggs per g root |
|---|---|---|---|---|---|
| Nem19-1 | 21.5 | 36.3 | 20.5 | 2.3 | 6.4 |
| Nem18-1 | 20.7 | 38.7 | 19.3 | 2.8 | 3.2 |
| Nem17-1 | 27.3 | 48.7 | 20.5 | 2.7 | 9.9 |
| Nem16-2 | - | 38.2 | 22.1 | 6.0 | 8.7 |
| Nem15-1 | 20.9 | 38.3 | 30.0 | 9.2 | 11.9 |
| Nem13-1 | 21.5 | 29.6 | 22.4 | 28.6 | 47.1 |
| Nem13-2 | 27.9 | 37.0 | 22.6 | 25.3 | 27.8 |
| Nem12-1 | 24.0 | 37.5 | 29.3 | 25.0 | 25.5 |
Table 4.
Pearson correlation coefficients among 22 accession lines to measure the repeatability among trials in relation to nematode (Meloidogyne javanica) resistance parameters.
| Trial | by Trial | No. of accession linesa | Eggs per plantb | Eggs per g root | Gall rating |
|---|---|---|---|---|---|
| Nem12-1 | Nem13-1 | 6 | 0.99*** | 0.89* | 0.92** |
| Nem12-1 | Nem13-2 | 6 | 0.98*** | 0.94** | 0.86* |
| Nem12-1 | Nem15-1 | 6 | 0.10 ns | 0.20 ns | 0.56 ns |
| Nem12-1 | Nem16-2 | 7 | 0.98*** | 0.76* | 0.20 ns |
| Nem12-1 | Nem17-1 | 6 | 0.94** | 0.95** | 0.86* |
| Nem12-1 | Nem18-1 | 8 | 0.93** | 0.63 ns | 0.64 ns |
| Nem12-1 | Nem19-1 | 8 | 0.87** | 0.92** | 0.86** |
| Nem13-1 | Nem13-2 | 3 | 0.99 ns | 0.82 ns | – |
| Nem13-1 | Nem15-1 | 12 | 0.47 ns | 0.31 ns | 0.27 ns |
| Nem13-1 | Nem16-2 | 12 | 0.92*** | 0.10 ns | 0.35 ns |
| Nem13-1 | Nem17-1 | 10 | 0.74* | 0.60 ns | 0.72* |
| Nem13-1 | Nem18-1 | 8 | 0.91** | 0.71* | 0.82* |
| Nem13-1 | Nem19-1 | 7 | 0.69 ns | 0.59 ns | 0.89** |
| Nem13-2 | Nem15-1 | 5 | −0.02 ns | 0.33 ns | 0.71 ns |
| Nem13-2 | Nem16-2 | 6 | 0.95** | 0.80 ns | −0.30 ns |
| Nem13-2 | Nem17-1 | 5 | 0.92* | 0.95* | 0.68 ns |
| Nem13-2 | Nem18-1 | 6 | 0.90* | 0.46 ns | 0.68 ns |
| Nem13-2 | Nem19-1 | 6 | 0.86* | 0.83* | 0.87* |
| Nem15-1 | Nem16-2 | 18 | 0.19 ns | 0.29 ns | −0.30 ns |
| Nem15-1 | Nem17-1 | 15 | 0.25 ns | 0.12 ns | 0.19 ns |
| Nem15-1 | Nem18-1 | 10 | 0.51 ns | 0.66* | 0.16 ns |
| Nem15-1 | Nem19-1 | 13 | 0.66* | 0.60* | -0.48 ns |
| Nem16-2 | Nem17-1 | 14 | 0.74** | 0.28 ns | 0.06 ns |
| Nem16-2 | Nem18-1 | 10 | 0.81 ns | 0.63* | −0.38 ns |
| Nem16-2 | Nem19-1 | 12 | 0.43 ns | 0.40 ns | 0.27 ns |
| Nem17-1 | Nem18-1 | 8 | 0.97*** | 0.77* | 0.82** |
| Nem17-1 | Nem19-1 | 13 | 0.92*** | 0.86*** | 0.79** |
| Nem18-1 | Nem19-1 | 10 | 0.93*** | 0.71* | 0.88** |
Table 5.
Pearson correlation coefficients to compare relationships of nematode (Meloidogyne javanica) resistance parameters with sugarcane shoot biomass and root biomass.
| Eggs per plant | Eggs per g root | Visual rating | ||||
|---|---|---|---|---|---|---|
| Trial name | Shoot biomass | Root biomass | Shoot biomass | Root biomass | Shoot biomass | Root biomass |
| Nem19-1 | −0.08 nsa | −0.27 ns | −0.47** | −0.74*** | −0.14 ns | −0.41** |
| Nem18-1 | 0.01 ns | −0.03 ns | −0.36** | −0.45** | 0.01 ns | −0.08 ns |
| Nem17-1 | 0.070 ns | −0.26 ns | −0.42** | −0.65*** | −0.004 ns | −0.26 ns |
| Nem16-2 | – | 0.13 ns | – | −0.44*** | – | 0.11 ns |
| Nem15-1 | −0.093 ns | −0.07 ns | −0.24** | −0.28** | −0.19 ns | −0.12 ns |
| Nem13-1 | 0.15 ns | 0.14 ns | 0.12 ns | −0.06 ns | 0.30** | 0.21* |
| Nem13-2 | 0.19 ns | 0.02 ns | 0.08 ns | −0.19* | −0.10 ns | −0.40*** |
| Nem12-1 | 0.18 ns | 0.06 ns | −0.02 ns | −0.23** | 0.24* | −0.04 ns |
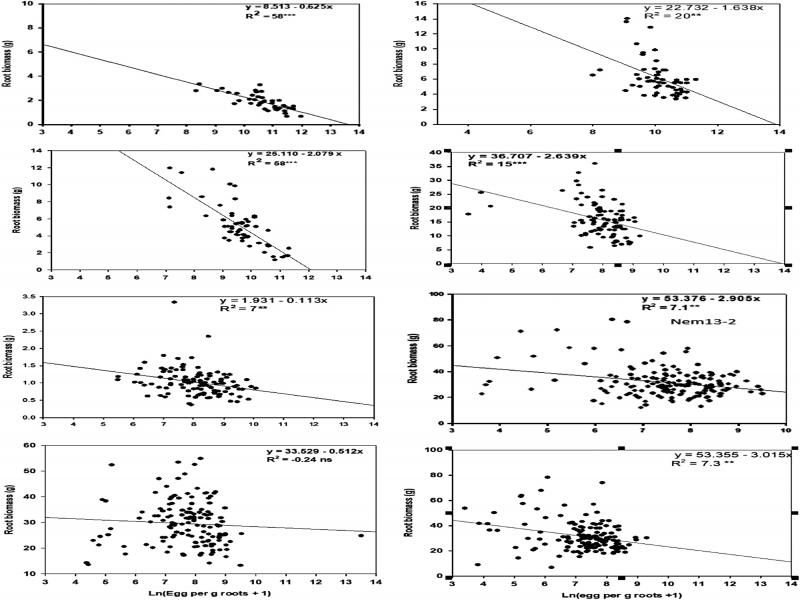
Figure 2:
Regressions to show the relationship between root biomass and ln(eggs per g roots+1) in eight nematode trials.