
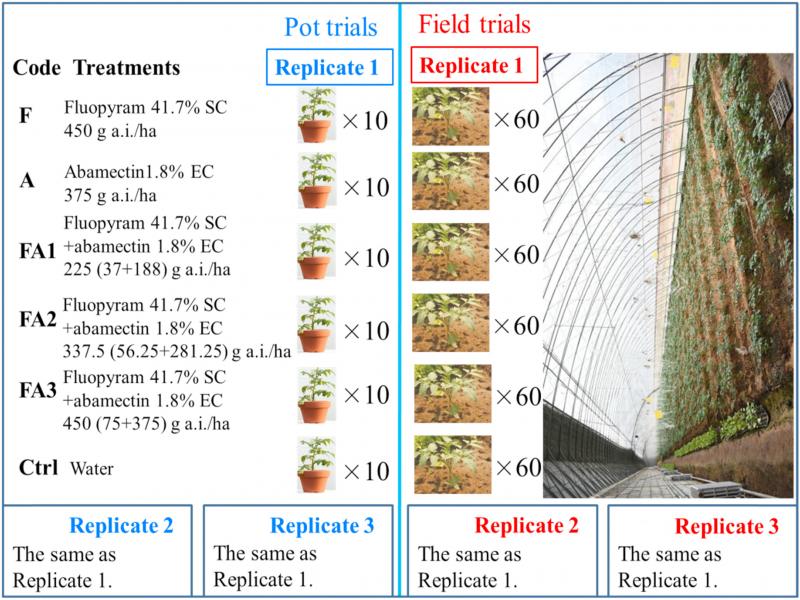
Figure 1:
Experiments design of the pot and field trials.
Table 1.
Toxicities of fluopyram and abamectin against second-stage juveniles (J2) of Meloidogyne incognita (48 h).
| Pesticides | Mass ratio of active ingredient | Slope ± SE | LC50 (mg/L) | 95% Confidence limits (mg/L) | r | p | χ 2 | CTC |
|---|---|---|---|---|---|---|---|---|
| Fluopyram | – | 1.43 ± 0.22 | 2.53 | 1.41–4.52 | 0.96 | 0.0082 | 120.28 | – |
| Abamectin | – | 1.56 ± 0.14 | 1.62 | 1.34–1.95 | 0.98 | 0.0017 | 49.69 | – |
| Fluopyram:Abamectin | 1:1 | 1.65 ± 0.26 | 0.99 | 0.71–1.40 | 0.96 | 0.0084 | 139.20 | 198 |
| 1:3 | 2.04 ± 0.40 | 0.78 | 0.50–1.24 | 0.95 | 0.0150 | 92.22 | 227 | |
| 1:5 | 1.29 ± 0.29 | 0.64 | 0.37–1.12 | 0.93 | 0.0212 | 321.94 | 268 | |
| 3:1 | 1.89 ± 0.18 | 1.99 | 1.64–2.42 | 0.98 | 0.0021 | 79.68 | 111 | |
| 5:1 | 1.81 ± 0.22 | 3.16 | 2.42–4.11 | 0.98 | 0.0038 | 100.36 | 73 |
Table 2.
Effects of the different treatments on the physiological growth indicators of tomato in pot trials (60 DAT).
| Growth rate (%) | |||||
|---|---|---|---|---|---|
| Code | Plant height | Stem diameter | Fresh root weight | Fresh shoot weight | Root length |
| F | 17.44 ± 5.23 ab | 9.84 ± 3.24 ab | 28.71 ± 9.09 ab | 29.51 ± 10.29 a | 15.51 ± 6.38 a |
| A | 10.62 ± 6.26 ab | 3.48 ± 9.68 b | 22.30 ± 4.90 b | 14.34 ± 8.82 abc | 11.23 ± 1.91 a |
| FA1 | 8.66 ± 4.35 b | 2.50 ± 6.63 b | 7.93 ± 1.77 c | 8.83 ± 8.39 c | 5.62 ± 5.11 a |
| FA2 | 13.51 ± 7.34 ab | 6.71 ± 3.36 ab | 27.57 ± 9.01 ab | 24.14 ± 13.95 ab | 15.51 ± 1.59 a |
| FA3 | 20.84 ± 4.71 a | 14.89 ± 6.73 a | 40.30 ± 4.34 a | 29.78 ± 2.56 a | 21.57 ± 8.34 a |
| Ctrl | – | – | – | – | – |
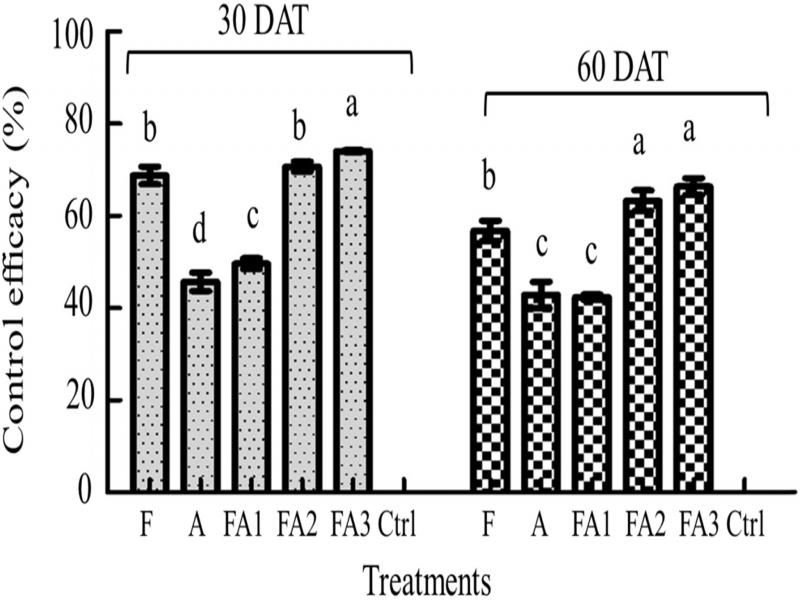
Figure 2:
Control efficacy of the different treatments based on the number of M. incognita in pot trials. DAT was days after transplanting. Data are expressed as the mean ± SE. Different lowercase letters indicate significant differences (p < 0.05). The abbreviations of the capital letters were the same as those in Table 2.
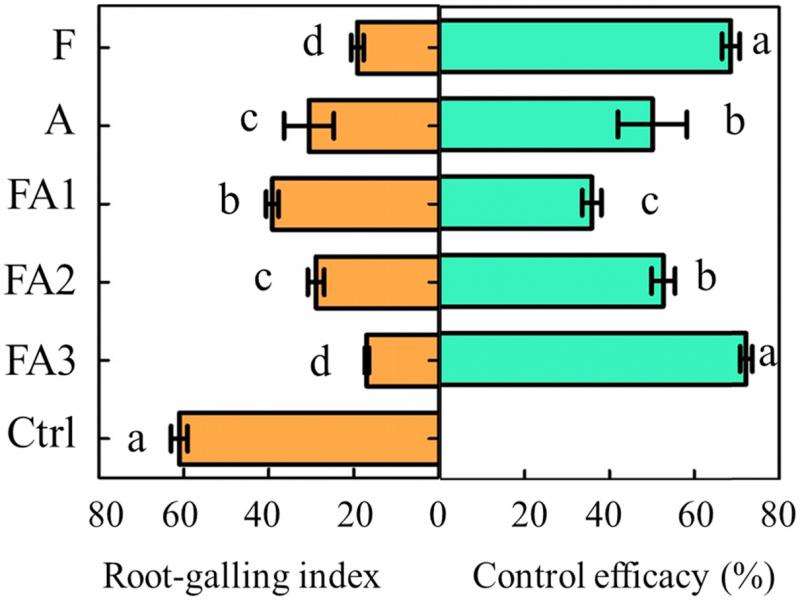
Figure 3:
Control efficacy of the different treatments based on the root-galling index in pot trials (60 DAT). Data are expressed as the mean ± SE. Different lowercase letters indicate significant differences (p < 0.05). The abbreviations of the capital letters were the same as those in Table 2.
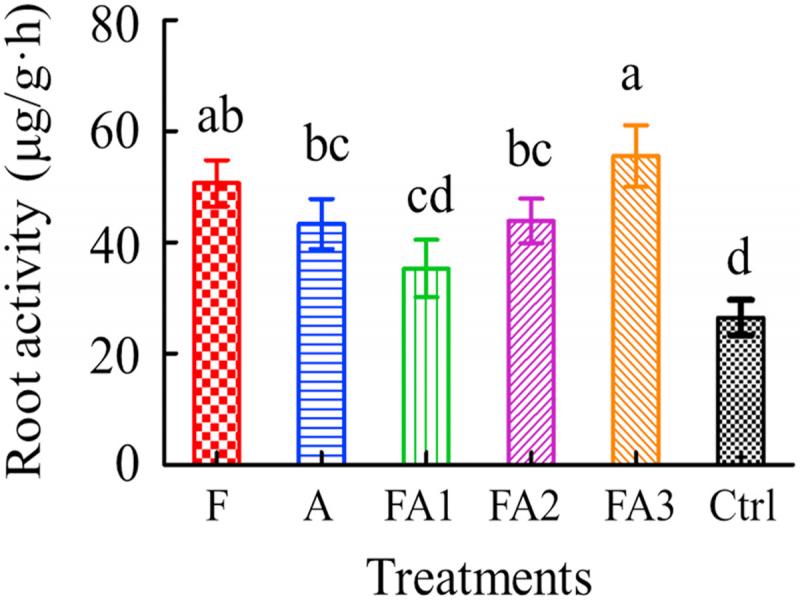
Figure 4:
Root activity of tomato in the different treatments in pot trials. Data are expressed as the mean ± SE. Different lowercase letters indicate significant differences (p < 0.05). The abbreviations of the capital letters were the same as those in Table 2.
Table 3.
Control efficacy of the different treatments based on the number of Meloidogyne incognita in field soil.
| Control efficacy (%) | ||||
|---|---|---|---|---|
| Site/year | Code | Initial no. of nematodes (nematodes/100 g soil) | 30 DAT | 60 DAT |
| LW/2018 | F | 1780.88 ± 203.11 a | 29.52 ± 1.60 b | 37.31 ± 7.09 b |
| A | 1439.19 ± 201.26 a | 15.43 ± 3.76 c | 29.77 ± 1.73 b | |
| FA1 | 1520.80 ± 573.47 a | 12.86 ± 3.04 c | 17.75 ± 4.75 c | |
| FA2 | 1441.61 ± 124.94 a | 35.12 ± 1.89 b | 53.19 ± 1.75 a | |
| FA3 | 1658.66 ± 277.33 a | 53.04 ± 5.27 a | 58.13 ± 3.75 a | |
| Ctrl | 1638.89 ± 411.11 a | – | – | |
| DY/2019 | F | 1288.33 ± 223.45 a | 31.50 ± 1.80 b | 38.67 ± 3.79 b |
| A | 1457.41 ± 159.75 a | 14.67 ± 2.51 c | 30.67 ± 2.52 b | |
| FA1 | 1523.16 ± 188.47 a | 15.70 ± 2.25 c | 22.46 ± 3.50 c | |
| FA2 | 1287.33 ± 182.67 a | 38.33 ± 2.30 b | 52.53 ± 4.10 a | |
| FA3 | 1461.12 ± 160.25 a | 57.50 ± 3.61 a | 59.73 ± 1.60 a | |
| Ctrl | 1314.16 ± 110.32 a | – | – | |
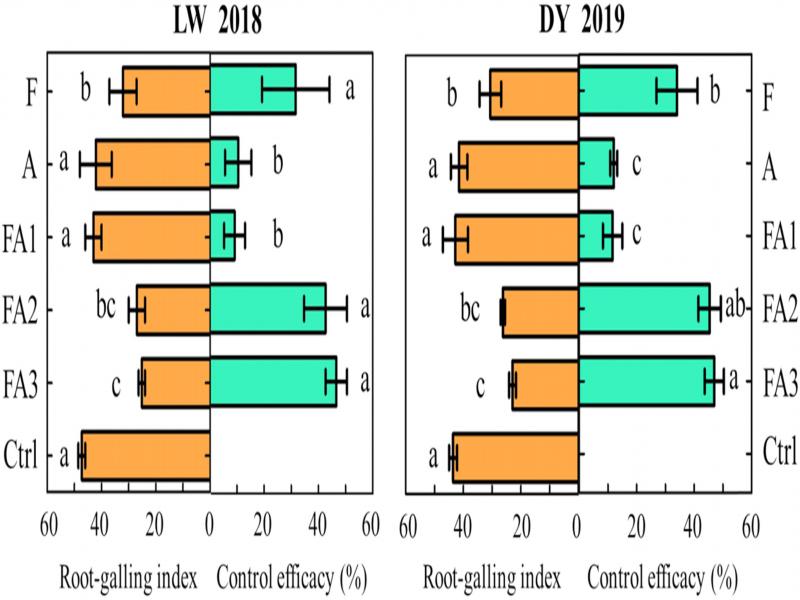
Figure 5:
Control efficacy of the different treatments on the root-galling index in field trials (at the end of tomato production, LW 2018 and DY 2019). LW and DY were the area of Laiwu in Jinan City and Daiyue in Tai’an City, Shandong Province, China. Data are expressed as the mean ± SE. Different lowercase letters indicate significant differences (p < 0.05). The abbreviations of the capital letters were the same as those in Table 3.
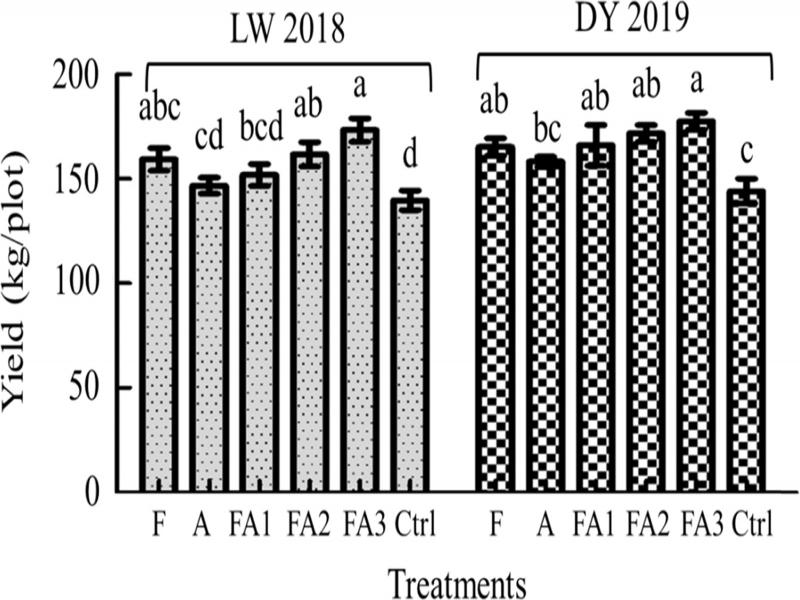
Figure 6:
Yield of the different treatments in field trials (LW 2018 and DY 2019). LW and DY were the area of Laiwu in Jinan City and Daiyue in Tai’an City, Shandong Province, China. Data are expressed as the mean ± SE. Different lowercase letters indicate significant differences (p < 0.05). The abbreviations of the capital letters were the same as those in Table 3.