
Nematodes occupy most terrestrial habitats on earth (Liu et al., 2019), even the furthest reaches of caves (Du Preez et al., 2017) and deep underground mines (Borgonie et al., 2011). Estimates also indicate that nematodes represent 80% of all multicellular organisms (Eisenhauer and Guerra, 2019; Van Den Hoogen et al., 2019). However, despite their omnipresent distribution and dominating abundance, many nematode communities are poorly studied with the majority of species remaining undescribed (Archidona-Yuste et al., 2016). This is especially true for many habitats in South Africa since most nematode-related studies are focused on agricultural systems and nematodes of economic importance (i.e. crop pests) (Procter, 2012; Fourie et al., 2017).
Grasslands, for example, host diverse soil ecosystems, represent more than 40% of Earth’s terrestrial surface area and provide essential ecosystem services including the provision of food, storage of carbon, mitigating droughts and floods, and erosion control (Hewins et al., 2018; Bengtsson et al., 2019; Gibson and Newman, 2019). However, although the structure and ecological status of grassland nematode communities have been investigated in some parts of the world (Ekschmitt et al., 2001; Biederman and Boutton, 2009; Kergunteuil et al., 2016), a literature survey revealed no ecological reports on the nematode communities of South African grasslands.
Studying the nematode communities of grasslands is not only relevant from an ecological perspective, but also from a conservation perspective. Nematodes are valuable indicators of soil ecosystem disturbance affected by, for example, agricultural activities and climate change (Ferris and Bongers, 2009; Zhong et al., 2017; Zhang et al., 2020). Therefore, studying the nematode communities of natural, undisturbed grasslands will generate valuable baseline data for monitoring disturbance and implementing conservation policies. This would be especially valuable for South Africa as the country’s grasslands are under continuous threat from overgrazing, cultivation, and urban expansion (Haddad and Butler, 2018). Woody (or bush) encroachment, driven by rising temperatures and increasing atmospheric carbon dioxide levels, also presents a major threat (Skowno et al., 2017). This while only 2.0 to 2.8% of South Africa’s grasslands are protected within conserved areas (Carbutt et al., 2011; Haddad and Butler, 2018).
When studying terrestrial ecosystems, it is also important to consider seasonal variation as water availability, temperature, and vegetative growth can have an important effect on the structure and functioning of soil ecosystems (Bongers and Ferris, 1999; Cardoso et al., 2016; Song et al., 2016; Siebert et al., 2020). Song et al. (2016), for example, showed that higher precipitation rates significantly increased nematode abundance and richness in a grassland ecosystem. Bakonyi et al. (2007), in turn, found that the effects of soil drying and warming on nematode communities were dependant on the presence of vegetation with the smallest effect recorded in grasses. Ultimately, understanding how seasonal variation affects soil ecosystems is necessary in order to accurately assess and monitor the potential threats posed by anthropogenic activities and climate change.
For these reasons, this study was undertaken and aimed at (i) studying the nematode community structure in the open grassland, shrubland with rocky outcrops and riparian zone habitats of the Telperion Nature Reserve and (ii) investigating the effect of seasonal-induced changes on the condition, food web status and functioning of the soil ecosystems.
Materials and methods
Site description
The study was conducted in the Telperion Nature Reserve (Mpumalanga province, South Africa) (Fig. 1) that has a total surface area of 9,061.3 ha. This reserve is located in the Rand Highveld Grassland (of which only 1% is conserved) and is dominated by grassy plains interspersed with rocky outcrops and woody plant species (Grobler, 1999). The greater region is characterized by strong summer rainfall (570-730 mm per annum) and dry and cold winters (frost may occur frequently). This is a fire prone ecosystem with high lightning flash densities making lightning-induced fires common. The lithology of Telperion Nature Reserve is dominated by Arenite-Conglomerate, producing dystrophic or mesotrophic soils with some red soils, as well as rocky areas with miscellaneous soils (Grobler, 1999). Three streams flow through the reserve that originates from higher lying wetlands and sponge areas.
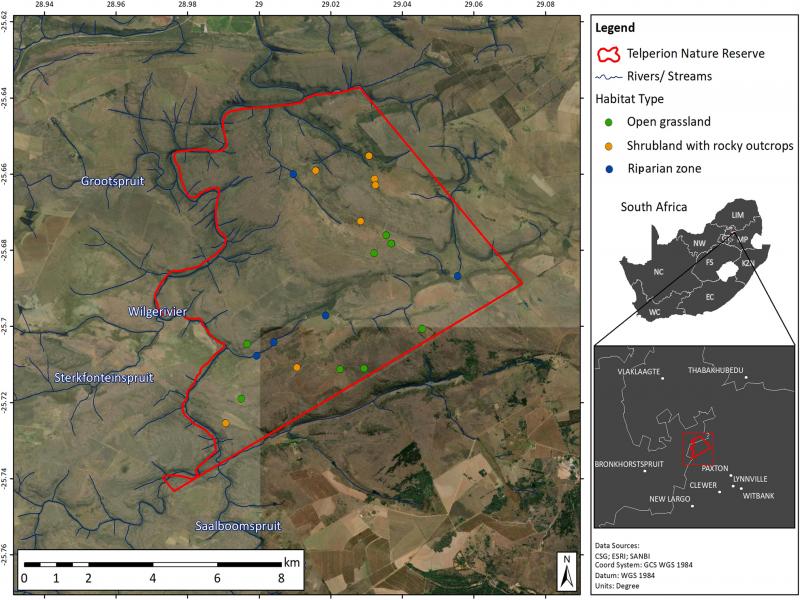
Figure 1:
Satellite image of Telperion Nature Reserve (South Africa) indicating the sampling locations associated with the open grassland, shrubland with rocky outcrops and riparian zone habitats.
Rainfall and temperature data
Climatic data (rainfall and temperature) from January 2014 to December 2016 were obtained from the South African Weather Service (www.weathersa.co.za). The total amount of rain for 90 days prior to each sampling event (as listed in the following section) was calculated, while the mean, minimum, and maximum daily temperatures were extracted for the same period. Since sampling was based on climatic factors (as listed in the following section) and thus not evenly dated over 1 year, this 90-day period was considered before each sampling event.
Site selection and sample collections
Within Telperion Nature Reserve three main terrestrial habitats, namely, (i) open grassland (OG), (ii) shrubland with rocky outcrops (SRO), and (iii) riparian zone (RZ) were identified for investigation. Sites within each habitat were selected based on accessibility as some areas were restricted and/or not accessible by vehicle or foot. The elevation of the sites in the each habitat ranged as follows: OG: 1333 to 1482 m, SRO: 1361 to 1480 m, and RZ: 1304 to 1383 m above sea level. Ultimately, 26 sampling sites (Fig. 1) were selected and included: 11 OG, 10 SRO sites, and 5 RZ sites.
In total, 104 soil samples (one per site per season) were collected from the three terrestrial habitats during four consecutive seasons [Winter (11 June 2015), Spring (30 November 2015), Summer (24 February 2016), and Autumn (19 April 2016)]. These sampling dates were selected based on climatic patterns through consultation with the reserve manager. Winter samples were the first to be collected when frost was at its peak. Spring sampling followed the first rains, which due to a drought in South Africa came later than normally expected. Summer sampling was undertaken when grasses reached maturity and produced seeds, while Autumn samples were collected before the first frost occurred.
Multiple discrete soil samples (500 cm3 each) for the analysis of nematode community structure were collected from each site up to a depth of 20 cm using a garden trowel, which was cleaned between sampling sites to prevent contamination. Samples were collected beneath plants (if present). For the analysis of selected soil properties (soil texture and total organic carbon), a sub-sample was collected from each site. The latter was performed only during the summer (February 2016) sampling interval as the selected soil properties were unlikely to change significantly during the sampling period. All the collected samples were labeled and transported in cool boxes to the Nematology Unit of the Agricultural Research Council – Plant Health and Protection (Roodeplaat, South Africa). Samples were stored at 10°C until further analysis.
Nematode extraction, preservation, and identification
Nematodes were extracted from 250 cm3 soil samples using an adapted decanting and sieving method, followed by a sugar flotation method (Marais et al., 2017). The nematodes were then fixed in a heated 4% formaldehyde and 1% propionic acid (FPG) solution (Netscher and Seinhorst, 1969), dehydrated in a glycerin solution (Seinhorst, 1962), and mounted in glycerin on permanent glass slides using a wax ring (Marais et al., 2017). Nematodes were counted using a De Grisse counting dish (De Grisse, 1963) and identified to genus level using an Olympus BX53F microscope. Taxonomic classification was based on Maggenti et al. (1988) and Geraert (2019) for Tylenchina; Kleynhans et al. (1996) for Heteroderidae; Hunt (1993) for Aphelenchida; Decraemer (1995) and Duarte et al. (2010) for Trichodoridae; Andrássy (2009) for Dorylaimidae; and Andrássy (2005, 2007) for other free-living nematodes. Feeding groups were assigned, based on Yeates et al. (1993), as herbivores (He), bacterivores (Ba), fungivores (Fu), omnivores (Om), or predators (Pr). Nematodes were also assigned a cp-value based on Bongers and Bongers (1998).
Physical and biological properties of soil samples
The selected physical and biological properties were analyzed by Eco-Analytica (North-West University, South Africa) as follows: total organic carbon (C) content of the soil samples were determined using the loss-on-ignition method (Donkin, 1991) and the soil texture as described by Laker and Dupreez (1982).
Statistical analysis
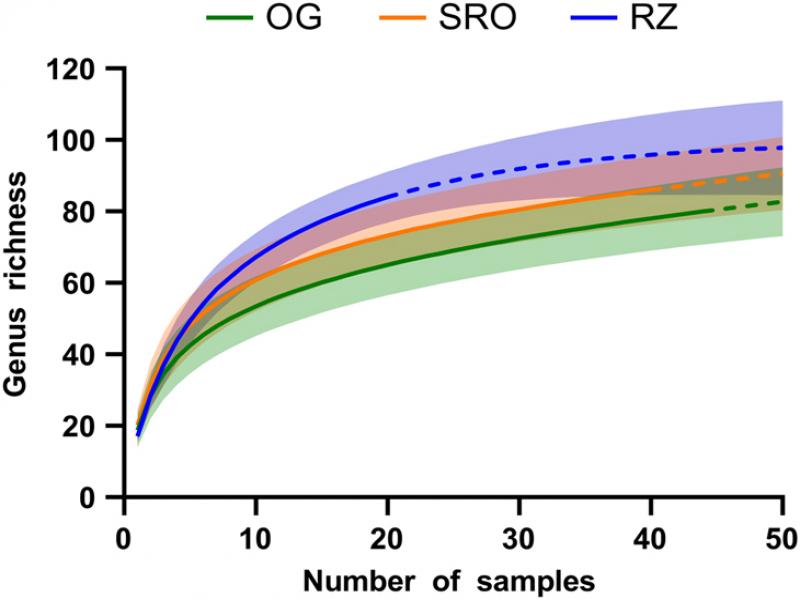
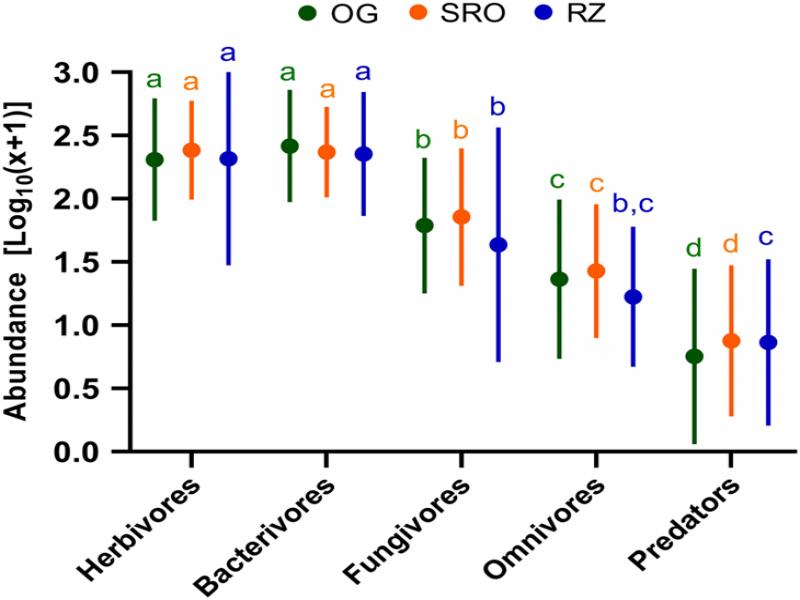
Rarefaction curves were used to compare taxa richness between habitats. This was achieved by calculating the sample-based Mao Tau estimator (with inter- and extrapolation) using Estimate S 9.1 Software Package. Furthermore, differences in the abundance of nematode trophic groups between habitats were investigated by pooling samples from across seasons. Abundance values were log10(x + 1) transformed and visualized, while statistical significance between trophic groups and habitats was inferred using two-way analysis of variance (ANOVA) and Tukey’s multiple comparisons tests. These analyses were performed using Graphpad Prism 6 Software Package.
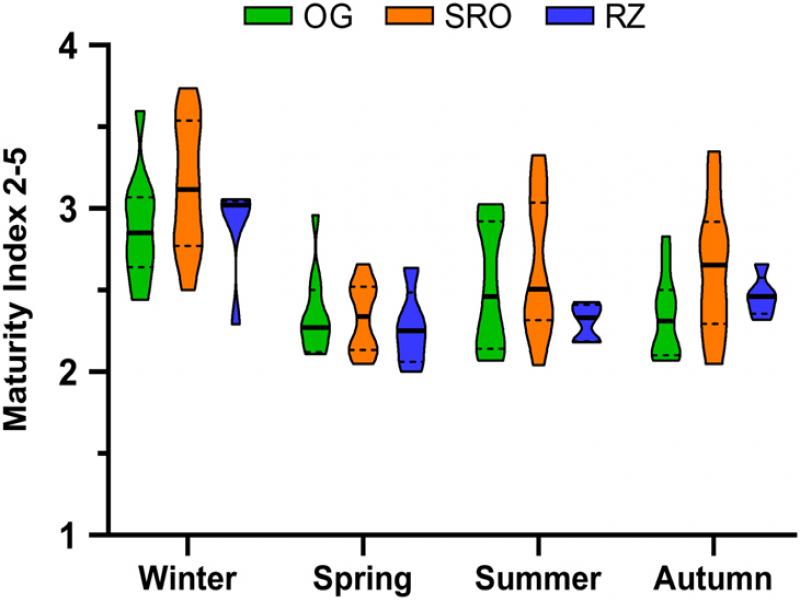
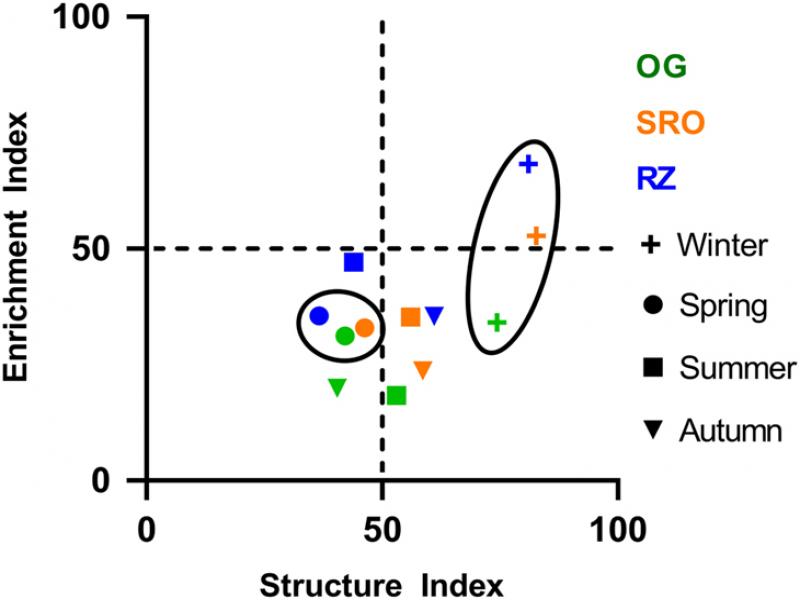
Selected nematode-based indices (i.e. maturity index 2-5, enrichment index, structure index, channel index, basal index, and metabolic footprints) were used to quantify the condition, food web status, and functioning of soil ecosystems (Ferris et al., 2001; Ferris and Bongers, 2009; Ferris, 2010). These indices were calculated using the Nematode Indicator Joint Analyses (NINJA) online tool (Sieriebriennikov et al., 2014). The Graphpad Prism 6 Software Package was used to create a violin plot of the maturity index 2-5, a measure of soil ecosystem condition. Also, values of the structure and enrichment indices were used to plot a faunal analysis and characterize the food web status of the studied soil ecosystems (Ferris et al., 2001). Furthermore, linear mixed models with pairwise comparisons were used to determine if the independent variables, i.e. season (Winter, Spring, Summer, and Autumn) and habitat (OG, SRO, and RZ) significantly affected (singularly and interactively) the calculated nematode-based indices. Prior to this analysis the nematode-based indices were log transformed (where needed). All linear mixed models were performed using SPSS Statistics 25 Software Package.
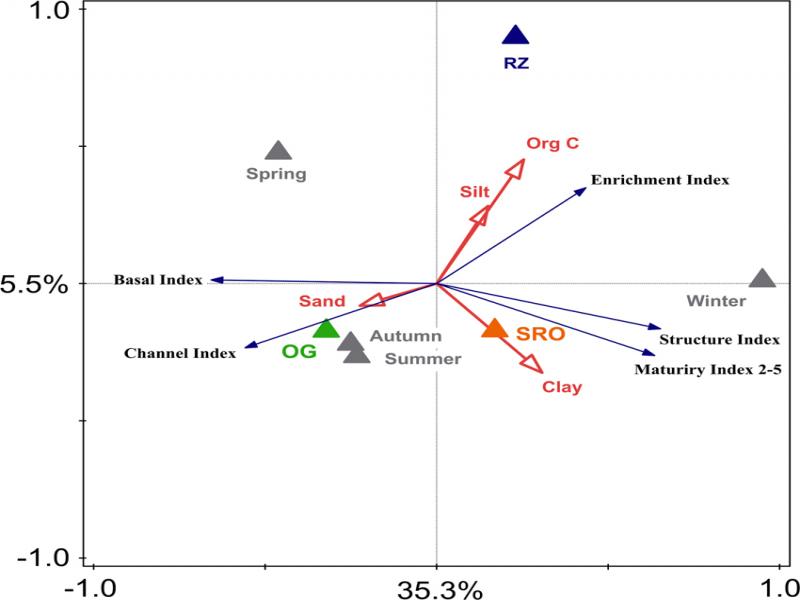
Lastly, a redundancy analysis (RDA) was used to investigate the relationship between the response (nematode-based indices) and explanatory variables [(factors (seasons and habitats) and numeric variables (soil texture and total organic carbon)]. Predictor effects of the listed explanatory variables were calculated using a Monte-Carlo permutation test (Šmilauer and Lepš, 2014). These multivariate analyses were performed and illustrated on a biplot using Canoco 5 Software Package. Significance for all univariate and multivariate analyses was regarded at p < 0.05.
Results
Environmental conditions
The total rainfall for 90 days prior to each sampling event is illustrated in Figure 2A. This shows a general increase over time with the lowest and highest rainfall recorded prior to the Winter and Autumn sampling events, respectively. However, it is important to note that South Africa experienced a drought in 2015. According to the South African Weather Service (www.weathersa.co.za), the Telperion Nature Reserve region received only 388 mm from January to December 2015. By contrast, the recorded annual rainfall in 2014 and 2016 were 794 and 748 mm, respectively.
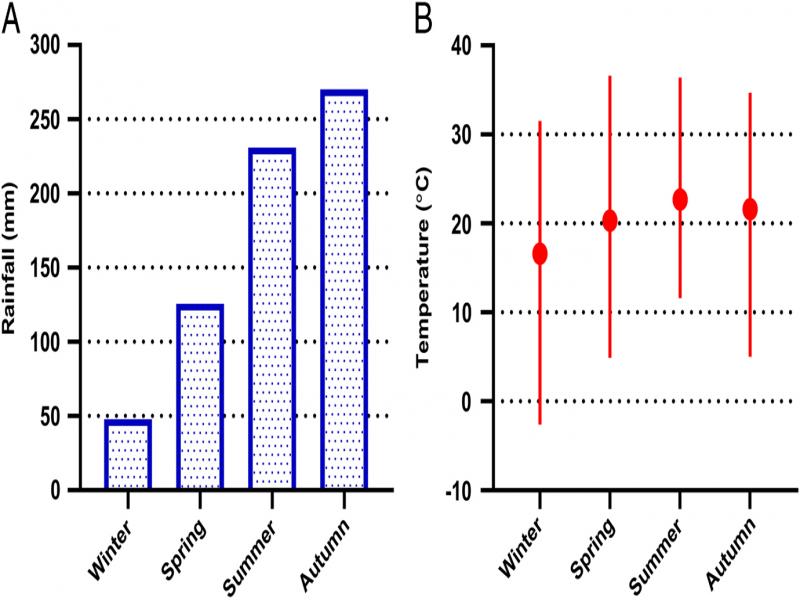
Figure 2:
The (A) total rainfall and (B) temperature (mean, minimum, and maximum) for the 90 days prior to each sampling event at Telperion Nature Reserve (South Africa).
Temperature (mean, minimum, and maximum) values are illustrated in Figure 2B with the lowest and highest mean temperatures recorded, as expected, prior to the Winter and Summer sampling events, respectively. The largest range between minimum (−2.6°C) and maximum (31.5°C) values were recorded before Winter sampling. Finally, the soil texture and organic carbon content of the collected and analyzed soil samples are provided as Supplementary material (Table S1).
Table S1.
Investigated soil properties measured at the open grassland, shrubland with rocky outcrops and riparian zone habitats in the Telperion Nature Reserve (Mpumalanga province, South Africa).
| Habitat | Sand (%) | Silt (%) | Clay (%) | Organic carbon (%) | |||||||||
|---|---|---|---|---|---|---|---|---|---|---|---|---|---|
| Open grassland | 91.77 ± 3.03 | 3.75 ± 2.33 | 4.47 ± 0.94 | 0.78 ± 0.24 | |||||||||
| Shrubland with rocky outcrops | 86.45 ± 4.44 | 6.99 ± 3.13 | 6.54 ± 2.08 | 1.65 ± 0.84 | |||||||||
| Riparian zone | 86.48 ± 7.18 | 8.18 ± 5.16 | 5.33 ± 2.24 | 1.59 ± 1.26 | |||||||||
| Open grassland | Shrubland with rocky outcrops | Riparian zone | |||||||||||
|---|---|---|---|---|---|---|---|---|---|---|---|---|---|
| Family | Genus or Family | Winter | Spring | Summer | Autumn | Winter | Spring | Summer | Autumn | Winter | Spring | Summer | Autumn |
| Anguinidae (He1) | Subanguina | 1.36 ± 4.52 | 0 | 2.73 ± 9.05 | 0.45 ± 1.51 | 0 | 0 | 0 | 0 | 0 | 1.00 ± 2.24 | 0 | 1.00 ± 2.24 |
| Belondiridae (He5) | Axonchium | 0.91 ± 3.02 | 3.64 ± 4.52 | 0 | 0.91 ± 3.02 | 0 | 5.00 ± 12.69 | 3.00 ± 7.89 | 0.50 ± 1.58 | 0 | 0 | 1.00 ± 2.24 | 0 |
| Belonolaimidae (He3) | Tylenchorhynchus | 1.82 ± 6.03 | 0 | 0 | 30.91 ± 65.91 | 18.00 ± 56.92 | 0.50 ± 1.58 | 25.00 ± 36.82 | 8.00 ± 13.98 | 0 | 0 | 0 | 0 |
| Criconematidae (He3) | Criconematidaea | 1.82 ± 4.62 | 5.00 ± 13.42 | 0.91 ± 3.02 | 0.91 ± 3.02 | 3.00 ± 3.50 | 3.00 ± 6.32 | 1.00 ± 3.16 | 4.50 ± 9.56 | 1.00 ± 2.24 | 0 | 1.00 ± 2.24 | 0 |
| Criconema | 0.91 ± 3.02 | 0 | 0 | 0 | 0 | 0 | 0 | 0 | 0 | 0 | 0 | 2.00 ± 4.47 | |
| Criconemoides | 6.36 ± 15.67 | 10.45 ± 17.24 | 7.27 ± 11.91 | 8.18 ± 22.39 | 0.50 ± 1.58 | 9.00 ± 21.19 | 5.00 ± 14.14 | 0 | 5.00 ± 11.18 | 5.00 ± 11.18 | 1.00 ± 2.24 | 0 | |
| Hemicriconemoides | 0 | 1.82 ± 6.03 | 0 | 0 | 0 | 1.00 ± 3.16 | 0 | 0 | 0 | 1.00 ± 2.24 | 0 | 0 | |
| Hemicycliophora | 5.91 ± 19.60 | 2.27 ± 7.54 | 0.45 ± 1.51 | 1.82 ± 6.03 | 1.50 ± 4.74 | 0.50 ± 1.58 | 0 | 1.00 ± 3.16 | 165.00 ± 301.58 | 13.00 ± 29.07 | 69.00 ± 154.29 | 1.00 ± 2.24 | |
| Dorylaimellidae (He5) | Dorylaimellus | 58.18 ± 98.82 | 6.36 ± 13.80 | 8.64 ± 18.04 | 11.36 ± 31.23 | 21.50 ± 25.28 | 12.50 ± 20.85 | 8.50 ± 16.51 | 12.00 ± 25.19 | 0 | 5.00 ± 11.18 | 1.00 ± 2.24 | 55.00 ± 122.98 |
| Heteroderidae (He3) | Meloidogyne | 4.09 ± 10.68 | 2.27 ± 7.54 | 1.82 ± 4.05 | 25.45 ± 71.40 | 154.50 ± 350.55 | 13.00 ± 19.32 | 11.50 ± 16.67 | 8.00 ± 17.03 | 0 | 162.00 ± 342.90 | 45.00 ± 81.70 | 54.00 ± 120.98 |
| Hoplolaimidae (He3) | Hoplolaimidaea | 6.36 ± 10.51 | 7.27 ± 16.94 | 0 | 2.27 ± 4.10 | 15.50 ± 26.29 | 14.00 ± 26.01 | 10.50 ± 31.49 | 0 | 2.00 ± 4.47 | 0 | 1.00 ± 2.24 | 0 |
| Helicotylenchus | 38.64 ± 43.25 | 139.09 ± 246.41 | 42.27 ± 112.37 | 40.45 ± 64.67 | 52.00 ± 82.27 | 67.50 ± 102.29 | 31.50 ± 57.40 | 61.50 ± 12.83 | 6.00 ± 13.42 | 83.00 ± 185.59 | 3.00 ± 6.71 | 73.00 ± 139.45 | |
| Rotylenchulus | 34.55 ± 71.57 | 50.91 ± 128.78 | 31.82 ± 47.29 | 55.91 ± 125.89 | 34.50 ± 92.87 | 46.00 ± 143.72 | 53.00 ± 139.92 | 96.00 ± 275.77 | 2.00 ± 4.47 | 28.00 ± 59.85 | 3.00 ± 6.71 | 1.00 ± 2.24 | |
| Rotylenchus | 29.55 ± 42.51 | 21.36 ± 38.61 | 0 | 16.36 ± 22.59 | 18.50 ± 35.04 | 5.50 ± 11.65 | 0.50 ± 1.58 | 7.00 ± 10.59 | 15.00 ± 28.28 | 0 | 0 | 8.00 ± 7.89 | |
| Scutellonema | 110.45 ± 131.25 | 172.73 ± 231.38 | 38.64 ± 71.91 | 35.45 ± 36.77 | 44.00 ± 51.47 | 64.00 ± 92.04 | 131.00 ± 343.24 | 21.00 ± 23.78 | 19.00 ± 26.55 | 40.00 ± 58.74 | 35.00 ± 57.77 | 137.00 ± 275.83 | |
| Leptonchidae (He4) | Xiphinemella | 6.82 ± 22.61 | 0 | 1.36 ± 3.23 | 5.45 ± 9.34 | 4.50 ± 14.23 | 2.50 ± 7.91 | 0.50 ± 1.58 | 5.50 ± 12.57 | 0 | 0 | 1.00 ± 2.24 | 2.00 ± 4.47 |
| Longidoridae (He5) | Longidorus | 0 | 0 | 0 | 0 | 0 | 0 | 0 | 0 | 0 | 3.00 ± 6.71 | 0 | 0 |
| Xiphinema | 6.82 ± 13.65 | 2.27 ± 4.10 | 7.27 ± 10.81 | 5.91 ± 10.68 | 20.22 ± 31.09 | 3.00 ± 5.37 | 11.50 ± 16.17 | 11.00 ± 16.96 | 3.00 ± 4.47 | 2.00 ± 2.74 | 6.00 ± 13.42 | 1.00 ± 2.24 | |
| Pratylenchidae (He3) | Pratylenchus | 10.45 ± 19.42 | 22.73 ± 44.74 | 2.27 ± 3.44 | 5.91 ± 13.38 | 27.00 ± 34.50 | 16.00 ± 35.81 | 15.50 ± 29.67 | 5.50 ± 10.66 | 0 | 0 | 0 | 0 |
| Psilenchidae (He2) | Psilenchus | 0.91 ± 2.02 | 0 | 0 | 0 | 0 | 0 | 3.00 ± 9.49 | 0 | 31.00 ± 69.32 | 7.00 ± 15.65 | 15.00 ± 33.54 | 0 |
| Trichodoridae (He4) | Nanidorus | 0 | 2.73 ± 9.05 | 0 | 0 | 0 | 2.50 ± 5.40 | 1.50 ± 4.74 | 0.50 ± 1.58 | 5.00 ± 7.07 | 18.00 ± 28.42 | 313.00 ± 683.17 | 28.00 ± 49.32 |
| Paratrichodorus | 0 | 0 | 0 | 0 | 2.00 ± 6.32 | 0 | 0 | 0 | 0 | 6.00 ± 13.42 | 0 | 0 | |
| Trichodoridaea | 0 | 0.45 ± 1.51 | 0 | 0 | 0 | 0 | 0 | 0 | 0 | 0 | 0 | 0 | |
| Trichodorus | 0 | 0 | 0 | 0 | 0 | 0.50 ± 1.58 | 0 | 0 | 0 | 0 | 0 | 0 | |
| Tylenchidae (He2) | Filenchus | 0 | 0 | 0 | 0 | 0 | 0 | 0 | 0 | 0 | 41.00 ± 80.96 | 0 | 0 |
| Coslenchus | 0 | 2.73 ± 9.05 | 0.45 ± 1.51 | 0 | 0 | 0.50 ± 1.58 | 0 | 0 | 0 | 0 | 0 | 0 | |
| Tylenchidaea | 0.45 ± 1.51 | 1.36 ± 3.23 | 0 | 0 | 0 | 2.50 ± 7.91 | 0 | 0.50 ± 1.58 | 1.00 ± 2.24 | 16.00 ± 30.50 | 0 | 0 | |
| Tylenchus | 77.73 ± 73.33 | 33.64 ± 40.38 | 15.91 ± 36.53 | 21.82 ± 24.21 | 121.50 ± 65.75 | 18.00 ± 18.59 | 14.00 ± 11.01 | 26.00 ± 27.37 | 139.00 ± 144.80 | 85.00 ± 100.93 | 246.00 ± 222.64 | 189.00 ± 263.71 | |
| Tylencholaimidae (He4) | Chitwoodius | 0 | 0 | 0 | 0.45 ± 1.51 | 0.50 ± 1.58 | 0 | 0 | 0 | 0 | 0 | 0 | 0 |
| Tylenchulidae (He3) | Meloidoderita | 3.64 ± 12.06 | 0 | 0 | 0 | 0 | 0 | 0 | 0 | 0 | 0 | 0 | 0 |
| Tylenchulus | 0 | 0 | 0.45 ± 1.51 | 0 | 0 | 2.00 ± 6.32 | 0 | 0 | 0 | 0 | 0 | 0 | |
| Total herbivores | 407.73 ± 194.43 | 489.09 ± 476.05 | 162.27 ± 214.97 | 270.00 ± 206.95 | 539.00 ± 383.70 | 289.00 ± 240.71 | 326.50 ± 363.48 | 268.50 ± 289.86 | 394.00 ± 353.77 | 516.00 ± 496.61 | 741.00 ± 922.38 | 552.00 ± 734.72 | |
| Open grassland | Shrubland with rocky outcrops | Riparian zone | |||||||||||
|---|---|---|---|---|---|---|---|---|---|---|---|---|---|
| Family (functional guild) | Genus or Family | Winter | Spring | Summer | Autumn | Winter | Spring | Summer | Autumn | Winter | Spring | Summer | Autumn |
| Alaimidae (Ba4) | Alaimus | 98.64 ± 91.33 | 17.73 ± 19.15 | 2.27 ± 11.07 | 12.73 ± 19.02 | 92.00 ± 57.07 | 21.50 ± 22.74 | 18.50 ± 22.61 | 57.50 ± 63.56 | 10.00 ± 14.14 | 22.00 ± 49.19 | 1.00 ± 2.24 | 0 |
| Amphidelus | 0 | 0 | 0 | 0 | 0 | 0.51 ± 1.58 | 5.50 ± 7.62 | 5.00 ± 11.55 | 0 | 0 | 0 | 1.00 ± 2.24 | |
| Aphanolaimidae (Ba3) | Aphanolaimus | 0 | 0 | 0 | 0 | 0 | 0 | 0 | 0 | 1.00 ± 2.24 | 0 | 0 | 0 |
| Cephalobidae (Ba2) | Cephalobidaea | 0 | 13.18 ± 18.07 | 87.73 ± 192.33 | 113.64 ± 198.92 | 0 | 19.00 ± 45.26 | 32.00 ± 38.82 | 36.50 ± 45.03 | 0 | 0 | 3.00 ± 2.74 | 10.00 ± 14.14 |
| Acrobeles | 122.27 ± 112.48 | 69.09 ± 103.46 | 36.82 ± 55.51 | 160.45 ± 192.57 | 51.50 ± 69.76 | 52.50 ± 123.52 | 18.00 ± 39.24 | 24.50 ± 36.40 | 3.00 ± 6.71 | 47.00 ± 64.58 | 32.00 ± 54.15 | 13.00 ± 16.43 | |
| Acrobeloides | 60.45 ± 41.44 | 20.45 ± 21.62 | 25.00 ± 53.06 | 23.64 ± 23.67 | 24.00 ± 43.83 | 66.50 ± 152.19 | 43.00 ± 103.98 | 21.50 ± 39.86 | 25.00 ± 30.00 | 52.00 ± 52.51 | 62.00 ± 107.62 | 63.00 ± 105.69 | |
| Cephalobus | 3.18 ± 9.02 | 42.27 ± 59.22 | 54.09 ± 47.21 | 97.73 ± 171.37 | 18.00 ± 50.01 | 64.50 ± 118.75 | 116.00 ± 272.01 | 63.50 ± 76.52 | 0 | 75.00 ± 148.66 | 58.00 ± 57.07 | 26.00 ± 28.59 | |
| Cervidellus | 0 | 8.64 ± 15.51 | 7.27 ± 15.55 | 7.73 ± 10.09 | 0 | 8.00 ± 15.67 | 3.50 ± 5.30 | 4.50 ± 6.43 | 0 | 50.00 ± 111.80 | 1.00 ± 2.24 | 5.00 ± 8.66 | |
| Chiloplacus | 20.45 ± 22.52 | 4.09 ± 6.25 | 3.18 ± 10.55 | 0.91 ± 3.02 | 13.00 ± 15.49 | 13.50 ± 17.49 | 2.00 ± 6.32 | 16.00 ± 44.02 | 60.00 ± 128.65 | 4.00 ± 8.94 | 1.00 ± 2.24 | 0 | |
| Eucephalobus | 0 | 0.91 ± 3.02 | 1.82 ± 4.62 | 0 | 0 | 121.00 ± 380.88 | 8.50 ± 16.34 | 5.50 ± 11.17 | 0 | 9.00 ± 20.12 | 167.00 ± 365.10 | 40.00 ± 61.64 | |
| Heterocephalo-bellus | 0 | 0 | 0 | 0.45 ± 1.51 | 0 | 0 | 0 | 0.50 ± 1.58 | 0 | 0 | 0 | 0 | |
| Seleborca | 53.64 ± 90.11 | 57.73 ± 84.42 | 89.55 ± 186.83 | 57.73 ± 71.39 | 8.00 ± 22.01 | 18.50 ± 46.19 | 7.50 ± 6.35 | 14.50 ± 16.24 | 0 | 17.00 ± 30.33 | 6.00 ± 10.84 | 1.00 ± 2.24 | |
| Zeldia | 28.18 ± 32.96 | 35.45 ± 77.05 | 2.73 ± 5.18 | 13.18 ± 16.17 | 6.00 ± 7.38 | 8.00 ± 12.74 | 8.50 ± 13.75 | 4.00 ± 6.58 | 3.00 ± 6.71 | 22.00 ± 49.19 | 2.00 ± 4.47 | 4.00 ± 8.94 | |
| Chromadoridae (Ba3) | Punctodora | 0 | 0 | 0 | 0 | 0 | 1.00 ± 3.16 | 0 | 0 | 9.00 ± 12.45 | 0 | 0 | 0 |
| Chronogasteridae (Ba3) | Chronogaster | 0 | 0 | 0 | 0.45 ± 1.51 | 0.50 ± 1.58 | 0 | 2.00 ± 4.83 | 0.50 ± 1.58 | 279.00 ± 509.20 | 12.00 ± 14.40 | 95.00 ± 212.43 | 28.00 ± 57.18 |
| Cyatholaimidae (Ba4) | Achromadora | 0 | 0 | 4.55 ± 15.08 | 0 | 0 | 0 | 0 | 0 | 9.00 ± 15.17 | 2.00 ± 2.74 | 18.00 ± 40.25 | 0 |
| Diplogasteridae (Ba1) | Butlerius | 0 | 0 | 0 | 0 | 1.50 ± 3.37 | 4.50 ± 14.23 | 0 | 0 | 3.00 ± 6.71 | 2.00 ± 4.47 | 0 | 0 |
| Diplogasteroididae (Ba1) | Diplogasteroididaea | 0 | 0 | 0 | 0 | 0 | 0 | 0 | 0 | 0 | 0 | 14.00 ± 31.30 | 1.00 ± 2.24 |
| Elaphonematidae (Ba3) | Elaphonema | 8.64 ± 17.76 | 1.82 ± 4.62 | 8.64 ± 15.51 | 12.73 ± 42.21 | 6.50 ± 11.56 | 0 | 7.00 ± 22.14 | 1.50 ± 3.37 | 0 | 0 | 0 | 0 |
| Mesorhabditidae (Ba1) | Mesorhabditis | 0 | 3.18 ± 10.55 | 0 | 8.18 ± 27.14 | 0 | 12.50 ± 32.68 | 1.50 ± 3.37 | 2.00 ± 6.32 | 0 | 14.00 ± 21.91 | 2.00 ± 4.47 | 0 |
| Metateratocepha-lidae (Ba3) | Euteratocephalus | 0 | 0 | 0 | 0 | 0 | 0 | 0 | 0 | 5.00 ± 8.66 | 0 | 0 | 0 |
| Monhysteridae (Ba2) | Monhystera | 1.82 ± 6.03 | 0 | 0 | 0 | 2.50 ± 4.86 | 2.00 ± 6.32 | 0 | 0 | 8.00 ± 13.04 | 4.00 ± 6.52 | 3.00 ± 4.47 | 6.00 ± 10.84 |
| Monhystrella | 0 | 0 | 0 | 0 | 00 | 0 | 0 | 0 | 0 | 0 | 2.00 ± 4.47 | ||
| Neodiplogastridae (Ba1) | Fictor | 0 | 0 | 0 | 0 | 0 | 0 | 0 | 0.50 ± 1.58 | 2.00 ± 4.47 | 0 | 0 | 0 |
| Koerneria | 0 | 0 | 0 | 0 | 2.00 ± 6.32 | 0 | 0 | 0 | 0 | 1.00 ± 2.24 | 3.00 ± 6.71 | 0 | |
| Odontolaimidae (Ba3) | Odontolaimus | 0 | 0 | 0 | 0 | 0 | 0 | 0 | 0 | 2.00 ± 4.47 | 0 | 0 | 0 |
| Osstellidae (Ba2) | Drilocephalobus | 0 | 0 | 18.18 ± 50.71 | 37.73 ± 71.46 | 0 | 0 | 3.50 ± 4.74 | 12.00 ± 14.57 | 0 | 0 | 0 | 1.00 ± 2.24 |
| Panagrolaimidae (Ba1) | Panagrolaimus | 26.36 ± 25.31 | 15.00 ± 23.02 | 0.91 ± 3.02 | 17.27 ± 35.31 | 17.50 ± 14.19 | 17.50 ± 39.32 | 12.50 ± 23.83 | 4.00 ± 7.38 | 39.00 ± 39.12 | 15.00 ± 21.21 | 19.00 ± 21.33 | 6.00 ± 6.52 |
| Plectidae (Ba2) | Anaplectus | 0 | 0 | 0 | 0 | 0 | 0 | 0 | 0.50 ± 1.58 | 0 | 0 | 0 | 0 |
| Ceratoplectus | 0 | 0 | 0 | 0.91 ± 2.02 | 10.50 ± 33.20 | 4.50 ± 11.17 | 2.50 ± 7.91 | 11.00 ± 25.03 | 0 | 2.00 ± 4.47 | 0 | 0 | |
| Plectus | 5.45 ± 12.34 | 0 | 0 | 0 | 4.00 ± 12.65 | 0 | 1.50 ± 2.42 | 3.50 ± 11.07 | 4.00 ± 4.18 | 1.00 ± 2.24 | 2.00 ± 4.47 | 1.00 ± 2.24 | |
| Wilsonema | 3.18 ± 7.83 | 0.45 ± 1.51 | 0 | 1.36 ± 2.34 | 6.50 ± 10.55 | 1.50 ± 2.42 | 2.50 ± 5.40 | 6.50 ± 17.17 | 0 | 6.00 ± 13.42 | 1.00 ± 2.24 | 1.00 ± 2.24 | |
| Prismatolaimidae (Ba3) | Prismatolaimus | 0.91 ± 2.02 | 0.91 ± 2.02 | 0.91 ± 3.02 | 3.18 ± 10.55 | 6.50 ± 11.80 | 7.00 ± 11.35 | 7.50 ± 13.99 | 7.00 ± 12.52 | 3.00 ± 2.74 | 5.00 ± 11.18 | 6.00 ± 13.42 | 3.00 ± 4.47 |
| Rhabditidae (Ba1) | Cruznema | 0 | 0 | 0 | 0 | 0 | 0 | 0 | 0.50 ± 1.58 | 0 | 0 | 0 | 0 |
| Rhabditidaea | 0.45 ± 1.51 | 0 | 0 | 0 | 0 | 0 | 0 | 0 | 0 | 0 | 0 | 0 | |
| Rhabditis | 1.36 ± 3.23 | 2.27 ± 4.67 | 0 | 3.18 ± 5.13 | 18.00 ± 31.55 | 12.50 ± 34.42 | 2.00 ± 4.22 | 5.00 ± 11.55 | 7.00 ± 13.04 | 6.00 ± 8.94 | 0 | 0 | |
| Rhabdolaimidae (Ba3) | Rhabdolaimus | 0 | 0 | 0.45 ± 1.51 | 0 | 0 | 0 | 0.50 ± 1.58 | 0 | 0 | 0 | 0 | 0 |
| Teratocephalidae (Ba3) | Teratocephalus | 0.45 ± 1.51 | 0.45 ± 1.51 | 0 | 0 | 0 | 4.00 ± 11.01 | 0 | 0 | 4.00 ± 6.52 | 0 | 0 | 0 |
| Total bacterivores | 435.45 ± 275.30 | 293.64 ± 291.33 | 349.09 ± 507.99 | 573.18 ± 517.51 | 288.50 ± 147.82 | 460.50 ± 719.66 | 306.00 ± 435.38 | 308.00 ± 126.34 | 476.00 ± 506.13 | 368.00 ± 364.02 | 496.00 ± 603.15 | 212.00 ± 129.79 | |
| Open grassland | Shrubland with rocky outcrops | Riparian zone | |||||||||||
|---|---|---|---|---|---|---|---|---|---|---|---|---|---|
| Family | Genus or Family | Winter | Spring | Summer | Autumn | Winter | Spring | Summer | Autumn | Winter | Spring | Summer | Autumn |
| Anguinidae (Fu2) | Ditylenchus | 8.64 ± 13.98 | 29.55 ± 40.28 | 28.18 ± 33.86 | 10.91 ± 13.75 | 1.50 ± 4.74 | 20.50 ± 38.18 | 19.00 ± 19.97 | 23.50 ± 30.56 | 0 | 25.00 ± 34.64 | 130.00 ± 144.27 | 110.00 ± 186.38 |
| Aphelenchidae (Fu2) | Aphelenchus | 15.91 ± 16.71 | 133.18 ± 190.56 | 86.36 ± 246.80 | 24.55 ± 35.67 | 12.50 ± 13.59 | 51.50 ± 63.20 | 80.00 ± 161.57 | 9.00 ± 9.66 | 0 | 19.00 ± 26.08 | 72.00 ± 102.02 | 68.00 ± 141.01 |
| Aphelenchoididae (Fu2) | Aphelenchoides | 8.64 ± 15.34 | 10.45 ± 15.72 | 21.36 ± 61.08 | 5.91 ± 7.01 | 13.00 ± 23.12 | 284.50 ± 887.40 | 16.00 ± 30.26 | 4.00 ± 6.58 | 15.00 ± 23.98 | 13.00 ± 13.04 | 21.00 ± 20.74 | 12.00 ± 21.39 |
| Diphtherophoridae (Fu3) | Diphtherophora | 23.18 ± 22.28 | 8.64 ± 13.62 | 5.00 ± 7.42 | 0.91 ± 2.02 | 24.00 ± 19.55 | 3.00 ± 6.32 | 23.50 ± 67.37 | 32.50 ± 86.35 | 9.00 ± 15.17 | 6.00 ± 13.42 | 34.00 ± 73.26 | 32.00 ± 35.81 |
| Leptonchidae (Fu4) | Leptonchus | 0 | 1.36 ± 3.23 | 0.91 ± 3.02 | 0.91 ± 3.02 | 0 | 1.00 ± 2.11 | 0 | 0.50 ± 1.58 | 0 | 1.00 ± 2.24 | 0 | 0 |
| Proleptonchus | 0 | 0 | 3.18 ± 10.55 | 0 | 0 | 0 | 0 | 0.50 ± 1.58 | 0 | 0 | 0 | 0 | |
| Neotylenchidae (Fu2) | Neotylenchidaea | 5.91 ± 10.20 | 3.64 ± 5.05 | 8.64 ± 15.02 | 10.00 ± 13.04 | 5.00 ± 15.81 | 11.50 ± 20.15 | 12.50 ± 18.45 | 18.50 ± 19.87 | 0 | 17.00 ± 28.20 | 23.00 ± 51.43 | 10.00 ± 17.32 |
| Paraphelenchidae (Fu2) | Paraphelenchus | 0 | 0 | 0 | 0 | 2.00 ± 6.32 | 0 | 0 | 0 | 1.00 ± 2.24 | 0 | 9.00 ± 20.12 | 0 |
| Tylencholaimellidae (Fu4) | Tylencholaimellus | 6.36 ± 11.85 | 0 | 0.45 ± 1.51 | 0.45 ± 1.15 | 3.50 ± 8.18 | 0.50 ± 1.58 | 2.00 ± 6.32 | 0 | 0 | 0 | 0 | 1.00 ± 2.24 |
| Tylencholaimidae (Fu4) | Tylencholaimidaea | 2.73 ± 9.05 | 0 | 0 | 0 | 0 | 0 | 0 | 0 | 1.00 ± 2.24 | 0 | 0 | 0 |
| Tylencholaimus | 7.27 ± 24.12 | 1.82 ± 4.05 | 24.09 ± 65.83 | 1.36 ± 4.52 | 7.00 ± 14.76 | 0 | 9.00 ± 28.46 | 0 | 2.00 ± 4.47 | 0 | 8.00 ± 15.25 | 0 | |
| Total fungivores | 78.64 ± 54.13 | 188.64 ± 229.54 | 178.18 ± 342.99 | 55.00 ± 41.23 | 68.50 ± 35.83 | 372.50 ± 863.64 | 162.00 ± 179.20 | 88.50 ± 120.21 | 28.00 ± 22.53 | 81.00 ± 93.10 | 297.00 ± 341.31 | 233.00 ± 360.60 | |
| Open grassland | Shrubland with rocky outcrops | Riparian zone | |||||||||||
|---|---|---|---|---|---|---|---|---|---|---|---|---|---|
| Family | Genus or Family | Winter | Spring | Summer | Autumn | Winter | Spring | Summer | Autumn | Winter | Spring | Summer | Autumn |
| Dorylaimidae (Om4) | Dorylaimidaea | 55.91 ± 22.89 | 20.45 ± 23.07 | 11.36 ± 19.25 | 17.27 ± 21.14 | 49.00 ± 29.23 | 14.00 ± 14.10 | 17.50 ± 29.65 | 16.00 ± 16.96 | 15.00 ± 12.75 | 15.00 ± 14.14 | 6.00 ± 6.52 | 18.00 ± 40.25 |
| Dorylaimus | 0.45 ± 1.51 | 0.45 ± 1.51 | 0 | 0 | 0.50 ± 1.58 | 0 | 1.00 ± 3.16 | 0 | 3.00 ± 6.71 | 0 | 0 | 0 | |
| Mesodorylaimus | 0 | 0 | 0 | 0 | 3.00 ± 9.49 | 1.50 ± 4.74 | 0 | 2.50 ± 7.91 | 1.00 ± 2.24 | 3.00 ± 4.47 | 1.00 ± 2.24 | 2.00 ± 4.47 | |
| Tylencholaimidae (Om4) | Discomyctus | 0 | 0 | 0 | 0 | 0 | 0 | 0 | 0 | 0 | 0 | 0 | 6.00 ± 13.42 |
| Mydonomidae (Om4) | Dorylaimoides | 0.91 ± 3.02 | 0 | 0 | 0 | 0 | 0 | 0 | 0 | 0 | 0 | 0 | 0 |
| Total omnivores | 57.27 ± 23.60 | 20.91 ± 23.00 | 11.36 ± 19.25 | 17.27 ± 21.14 | 52.50 ± 31.38 | 15.50 ± 14.990 | 18.50 ± 29.160 | 18.50 ± 20.010 | 19.00 ± 9.62 | 18.00 ± 16.81 | 7.00 ± 5.70 | 26.00 ± 52.73 | |
| Open grassland | Shrubland with rocky outcrops | Riparian zone | |||||||||||
|---|---|---|---|---|---|---|---|---|---|---|---|---|---|
| Family | Genus or Family | Winter | Spring | Summer | Autumn | Winter | Spring | Summer | Autumn | Winter | Spring | Summer | Autumn |
| Actinolaimidae (Pr5) | Neoactinolaimus | 0 | 0 | 0 | 0 | 0 | 0 | 0 | 0 | 0 | 0 | 2.00 ± 4.47 | 0 |
| Anatonchidae (Pr4) | Iotonchus | 4.09 ± 7.01 | 0.45 ± 1.51 | 0.45 ± 1.51 | 0 | 9.50 ± 12.79 | 1.50 ± 2.42 | 3.00 ± 4.22 | 1.00 ± 3.16 | 2.00 ± 4.47 | 0 | 14.00 ± 31.30 | 4.00 ± 8.94 |
| Aphelenchoididae (Pr2) | Seinura | 0 | 0 | 0 | 0 | 0 | 0 | 0 | 0 | 0 | 0 | 0 | 44.00 ± 98.39 |
| Aporcelaimidae (Pr5) | Aporcelaimidaea | 1.36 ± 4.52 | 0 | 0 | 1.82 ± 4.62 | 0 | 1.00 ± 3.16 | 0 | 0.50 ± 1.58 | 0 | 0 | 0 | 3.00 ± 6.71 |
| Aporcelaimellus | 16.36 ± 16.75 | 0.91 ± 3.02 | 5.91 ± 9.95 | 1.36 ± 4.52 | 3.50 ± 11.07 | 3.50 ± 4.12 | 9.50 ± 13.83 | 4.50 ± 9.56 | 2.00 ± 4.47 | 0 | 0 | 0 | |
| Aporcelaimus | 1.36 ± 3.23 | 5.00 ± 9.49 | 5.00 ± 9.22 | 4.09 ± 12.00 | 0 | 3.50 ± 5.80 | 3.50 ± 11.07 | 0 | 1.00 ± 2.24 | 2.00 ± 2.74 | 6.00 ± 13.42 | 19.00 ± 39.75 | |
| Makatinus | 0 | 0.91 ± 3.02 | 0 | 0 | 0 | 0 | 1.50 ± 4.74 | 0.50 ± 1.58 | 0 | 0 | 0 | 0 | |
| Ironidae (Pr4) | Ironus | 0 | 0 | 0 | 0 | 0 | 0 | 0 | 0 | 4.00 ± 8.94 | 0 | 0 | 0 |
| Mononchidae (Pr4) | Mononchidaea | 0.45 ± 1.51 | 0.45 ± 1.51 | 0 | 0 | 0 | 0 | 1.00 ± 3.16 | 0 | 0 | 2.00 ± 2.74 | 0 | 0 |
| Cobbonchus | 0 | 0 | 0 | 0 | 0 | 0 | 0 | 0 | 3.00 ± 4.47 | 0 | 0 | 0 | |
| Granonchulus | 0 | 0 | 0 | 0 | 0 | 1.50 ± 4.74 | 0 | 0 | 0 | 0 | 0 | 0 | |
| Mononchus | 0.45 ± 1.51 | 0.45 ± 1.51 | 0 | 1.82 ± 6.03 | 14.00 ± 29.04 | 0.50 ± 1.58 | 0 | 0 | 2.00 ± 2.74 | 0 | 0 | 0 | |
| Mylonchulidae (Pr4) | Mylonchulus | 0 | 0 | 0.91 ± 3.02 | 0 | 2.00 ± 4.83 | 0 | 0 | 0 | 0 | 0 | 0 | 0 |
| Paraxonchiidae (Pr5) | Paraxhonchium | 4.55 ± 10.60 | 1.36 ± 3.23 | 3.64 ± 12.06 | 0 | 1.50 ± 4.74 | 0 | 3.00 ± 7.89 | 6.00 ± 14.49 | 0 | 0 | 0 | 0 |
| Qudsianematidae (Pr4) | Discolaiminaea | 1.36 ± 4.52 | 0 | 0 | 0 | 2.00 ± 4.83 | 0 | 0 | 4.00 ± 8.76 | 0 | 0 | 0 | 0 |
| Discolaimoides | 9.09 ± 14.80 | 2.73 ± 5.18 | 12.73 ± 25.43 | 20.91 ± 27.28 | 1.50 ± 3.37 | 0 | 1.00 ± 3.16 | 9.00 ± 12.87 | 2.00 ± 2.74 | 0 | 0 | 3.00 ± 6.71 | |
| Discolaimus | 0.91 ± 3.02 | 0.45 ± 1.51 | 0 | 1.36 ± 4.52 | 0.50 ± 1.58 | 2.50 ± 5.40 | 0.50 ± 1.58 | 0.50 ± 1.58 | 0 | 1.00 ± 2.24 | 1.00 ± 2.24 | 2.00 ± 2.74 | |
| Eudorylaimus | 0 | 0 | 0 | 0 | 0 | 0.50 ± 1.58 | 0 | 0 | 0 | 0 | 2.00 ± 4.47 | 0 | |
| Labronema | 0 | 1.82 ± 6.03 | 0 | 0 | 0.50 ± 1.58 | 0.50 ± 1.58 | 1.00 ± 3.16 | 0.50 ± 1.58 | 0 | 0 | 6.00 ± 8.94 | 0 | |
| Tobrilidae (Pr4) | Tobrilus | 0 | 0 | 0 | 0 | 1.00 ± 3.16 | 0 | 0 | 0 | 2.00 ± 2.74 | 1.00 ± 2.24 | 1.00 ± 2.24 | 1.00 ± 2.24 |
| Tripylidae (Pr3) | Tripyla | 0 | 0 | 0 | 0.45 ± 1.51 | 1.50 ± 4.74 | 0.50 ± 1.58 | 1.00 ± 3.16 | 0 | 0 | 0 | 0 | 0 |
| Total predators | 40.00 ± 28.81 | 14.55 ± 20.30 | 28.64 ± 24.40 | 31.82 ± 27.04 | 37.5 ± 34.56 | 15.5 ± 11.20 | 24.5 ± 21.67 | 26.5 ± 24.23 | 18.00 ± 13.51 | 6.00 ± 4.18 | 32.00 ± 39.15 | 76.00 ± 131.79 | |
| Variable | Source | F ratio | p value | Variable | Source | F ratio | p value | |||||
|---|---|---|---|---|---|---|---|---|---|---|---|---|
| Maturity index 2–5 | Habitat | 3.66 | 0.04 | Bacterivore footprint | Habitat | 0.04 | 0.96 | |||||
| Season | 14.73 | <0.001 | Season | 2.46 | 0.07 | |||||||
| Habitat × Season | 0.42 | 0.86 | Habitat × Season | 0.58 | 0.75 | |||||||
| Channel index | Habitat | 2.49 | 0.11 | Fungivore footprint | Habitat | 0.35 | 0.71 | |||||
| Season | 11.67 | <0.001 | Season | 1.52 | 0.22 | |||||||
| Habitat × Season | 1.38 | 0.24 | Habitat × Season | 1.01 | 0.42 | |||||||
| Basal index | Habitat | 4.96 | 0.01 | Omnivore footprint | Habitat | 0.76 | 0.48 | |||||
| Season | 11.08 | <0.001 | Season | 2.54 | 0.06 | |||||||
| Habitat × Season | 0.35 | 0.91 | Habitat × Season | 0.29 | 0.94 | |||||||
| Enrichment index | Habitat | 8.77 | <0.001 | Predator footprint | Habitat | 1.45 | 0.26 | |||||
| Season | 7.65 | <0.001 | Season | 4.53 | <0.01 | |||||||
| Habitat × Season | 1.08 | 0.38 | Habitat × Season | 0.71 | 0.65 | |||||||
| Structure index | Habitat | 2.00 | 0.16 | Enrichment footprint | Habitat | 1.49 | 0.25 | |||||
| Season | 13.33 | <0.001 | Season | 0.29 | 0.83 | |||||||
| Habitat × Season | 0.64 | 0.70 | Habitat × Season | 0.84 | 0.54 | |||||||
| Herbivore footprint | Habitat | 0.56 | 0.58 | Structure footprint | Habitat | 0.11 | 0.90 | |||||
| Season | 1.60 | 0.20 | Season | 4.73 | <0.01 | |||||||
| Habitat × Season | 1.34 | 0.25 | Habitat × Season | 0.52 | 0.79 | |||||||
| Open grassland (OG) | Shrubland with rocky outcrops (SRO) | Riparian zone (RZ) | ||||||||||
|---|---|---|---|---|---|---|---|---|---|---|---|---|
| Winter | Spring | Summer | Autumn | Winter | Spring | Summer | Autumn | Winter | Spring | Summer | Autumn | |
| Herbivore footprint | 120 ± 70 | 118 ± 119 | 53 ± 63 | 168 ± 265 | 682 ± 1,326 | 116 ± 111 | 124 ± 117 | 116.11 ± 134 | 97 ± 81 | 683 ± 1,300 | 331 ± 326 | 289 ± 434 |
| Bacterivore footprint | 84 ± 49 | 56 ± 62 | 50 ± 74 | 99 ± 87 | 85 ± 63 | 91 ± 156 | 47 ± 52 | 57.21 ± 30 | 89 ± 62 | 66 ± 58 | 65 ± 67 | 29 ± 12 |
| Fungivore footprint | 14 ± 11 | 23 ± 26 | 25 ± 39 | 9 ± 7 | 11 ± 6 | 34 ± 60 | 23 ± 23 | 17.56 ± 22 | 4 ± 4 | 16 ± 18 | 49 ± 58 | 37 ± 55 |
| Omnivore footprint | 179 ± 97 | 103 ± 110 | 89 ± 94 | 91 ± 155 | 123 ± 67 | 78 ± 69 | 102 ± 124 | 58 ± 50 | 63 ± 34 | 54 ± 53 | 89 ± 150 | 241 ± 477 |
| Predator footprint | 12 ± 11 | 3 ± 4 | 6 ± 10 | 11 ± 11 | 31 ± 26 | 7 ± 9 | 7 ± 8 | 8 ± 8 | 15 ± 14 | 4 ± 3 | 22 ± 42 | 15 ± 13 |
| Enrichment footprint | 16 ± 8 | 30 ± 40 | 19 ± 38 | 21 ± 18 | 46 ± 65 | 68 ± 147 | 24 ± 21 | 23.46 ± 25 | 28 ± 26 | 35 ± 34 | 51 ± 44 | 33 ± 55 |
| Structure footprint | 217 ± 109 | 114 ± 112 | 103 ± 94 | 107 ± 153 | 178 ± 62 | 91 ± 78 | 122 ± 140 | 86 ± 62 | 123 ± 47 | 66 ± 61 | 132 ± 140 | 266 ± 481 |