
Table 1.
Pearson correlation coefficients† resulting from linear correlation of data parameters from 2018 and 2019 Meloidogyne incognita infested bermudagrass microplots in Auburn, AL.
| 2018 | 2019 | |||||
|---|---|---|---|---|---|---|
| July | August | September | July | August | September | |
| Turf visual quality a | ||||||
| NDVIb | 0.59** | NS | NS | NS | NS | 0.63*** |
| NDREc | NS | NS | NS | NS | NS | 0.66*** |
| NDRE | ||||||
| NDVI | NS | 0.72*** | 0.93*** | 0.60*** | 0.72*** | 0.95*** |
| Meloidogyne incognita | ||||||
| Turf visual quality | NS | −0.39* | NS | −0.64* | −0.39* | −0.59** |
| NDVI | NS | −0.48* | −0.76*** | NS | −0.37* | −0.82*** |
| NDRE | NS | NS | −0.61** | NS | NS | −0.76*** |
1 Notes: †NS, *,**,***Tests of linear correlation between variables were not significant (NS) or were significant at P ≤ 0.05, P ≤ 0.01, or P ≤ 0.001, respectively. aTurf visual quality ratings were assigned on a 1 to 9 scale, where 1 = poorest turf quality, 6 = minimally acceptable turf quality, and 9 = exceptional turf quality; bNDVI (Normalized Difference Vegetation Index) collected using a MicaSense Rededge-M (MicaSense, Inc.; Seattle, WA) sensor; cNDRE (Normalized Difference RedEdge Index) collected using a MicaSense Rededge-M (MicaSense, Inc.; Seattle, WA) sensor.
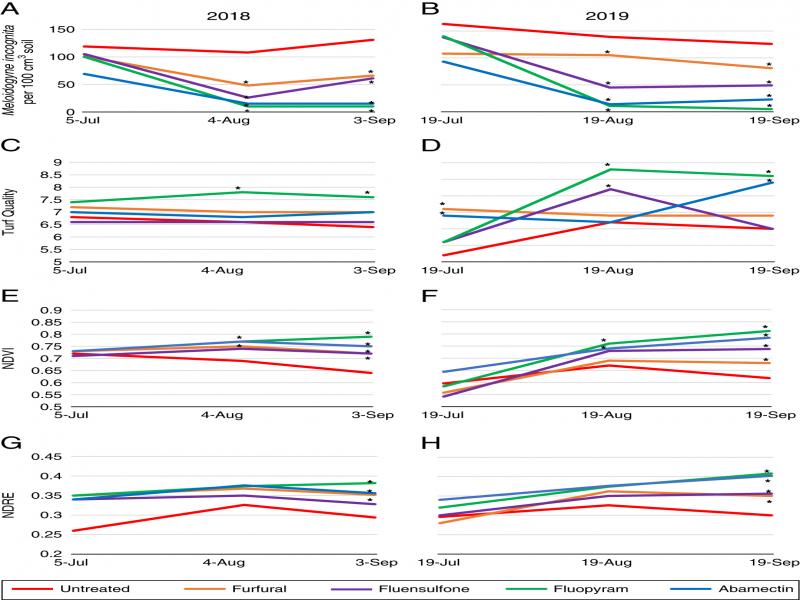
Figure 1:
Auburn University Meloidogyne incognita nematicide microplot trials for 2018 and 2019 showing M. incognita population density for 2018 (A) and 2019 (B), visual turf quality ratings for 2018 (C) and 2019 (D), NDVI ratings for 2018 (E) and 2019 (F), and NDRE values for 2018 (G) and 2019 (H). *Different from the untreated control according to the pairwise comparison of each treatment to the untreated (Tukey’s, P ≤ 0.05).
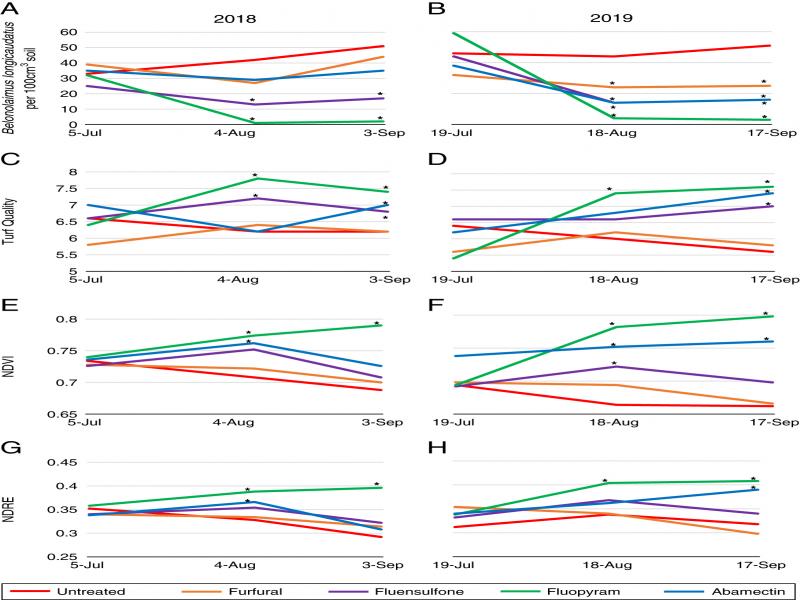
Figure 2:
Auburn University Belonolaimus longicaudatus nematicide microplot trials for 2018 and 2019 showing B. longicaudatus population density for 2018 (A) and 2019 (B), visual turf quality ratings for 2018 (C) and 2019 (D), NDVI ratings for 2018 (E) and 2019 (F), and NDRE values for 2018 (G) and 2019 (H). *Different from the untreated control according to the pairwise comparison of each treatment to the untreated (Tukey’s, P ≤ 0.05).
Table 2.
Pearson correlation coefficients† resulting from linear correlation of data parameters from 2018 and 2019 Belanolaimus lonigcaudatus infested bermudagrass microplots in Auburn, AL.
| 2018 | 2019 | |||||
|---|---|---|---|---|---|---|
| July | August | September | July | August | September | |
| Turf visual quality a | ||||||
| NDVIb | NS | NS | 0.63*** | NS | 0.43* | 0.41* |
| NDREc | NS | NS | 0.66*** | NS | 0.45* | 0.56** |
| NDRE | ||||||
| NDVI | 0.60** | 0.72*** | 0.96*** | 0.91*** | 0.96*** | 0.84*** |
| Belonolaimus longicaudatus | ||||||
| Turf visual quality | −0.64*** | NS | −0.56** | NS | −0.56** | −0.54** |
| NDVI | NS | NS | −0.57** | −0.51** | −0.57*** | −0.56** |
| NDRE | NS | NS | −0.61** | −0.53** | −0.61*** | −0.63** |
1 Notes: †NS, *,**,***Tests of linear correlation between variables were not significant (NS) or were significant at P ≤ 0.05, P ≤ 0.01, or P ≤ 0.001, respectively. aTurf visual quality ratings were assigned on a 1 to 9 scale, where 1 = poorest turf quality, 6 = minimally acceptable turf quality, and 9 = exceptional turf quality; bNDVI (Normalized Difference Vegetation Index) collected using a MicaSense Rededge-M (MicaSense, Inc.; Seattle, WA) sensor; cNDRE (Normalized Difference RedEdge Index) collected using a MicaSense Rededge-M (MicaSense, Inc.; Seattle, WA) sensor.
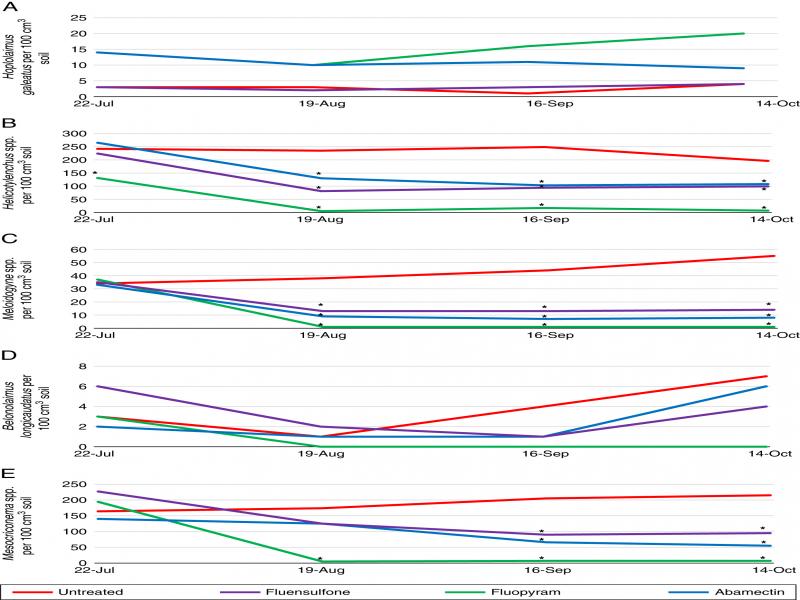
Figure 3:
Plant-parasitic nematode genera identified at Montevallo Golf Course, Montevallo, AL in 2019. Genera include Hoplolaimus spp. (A), Helicotylenchulus spp. (B), Meloidogyne spp. (C), Belonolaimus longicaudatus (D), and Criconemoides spp. (E). *Different from the untreated control according to the pairwise comparison of each treatment to the untreated (Tukey’s, P ≤ 0.05).
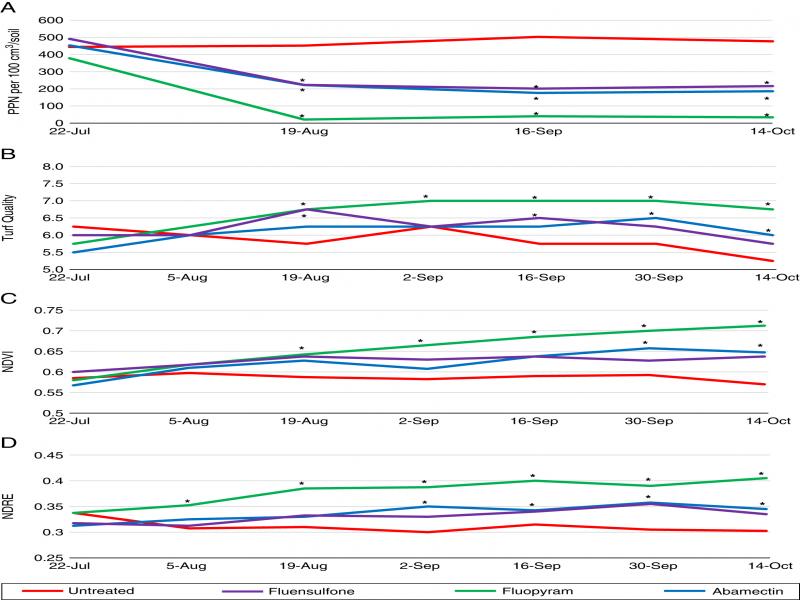
Figure 4:
Nematicide effects on total plant-parasitic nematode population density (A), visual turf quality (B), NDVI (C), and NDRE (D) at Montevallo Golf Course, Montevallo AL, 2019. *Different from the untreated control according to the pairwise comparison of each treatment to the untreated (Tukey’s, P ≤ 0.05).
Table 3.
Pearson correlation coefficients† resulting from linear correlation of vigor ratings and plant-parasitic nematode density from four bermudagrass putting greens treated with three different nematicides in 2019 in Montevallo, AL.
| July 22 | August 5 | August 19 | September 3 | September 16 | September 30 | October 14 | |
|---|---|---|---|---|---|---|---|
| Turf visual quality a | |||||||
| NDVIb | NS | NS | 0.63** | 0.70** | 0.62** | 0.78*** | 0.80*** |
| NDREc | NS | NS | NS | 0.59* | 0.51* | 0.67** | 0.60** |
| NDVI | |||||||
| NDRE | NS | NS | 0.49* | 0.76*** | 0.93*** | 0.79*** | 0.68** |
| Total plant-parasitic nematodes | |||||||
| Turf visual quality | −0.64** | −0.81*** | −0.85*** | −0.84*** | |||
| NDVI | −0.47* | −0.84*** | −0.80*** | −0.82*** | |||
| NDRE | NS | −0.59* | −0.70** | −0.70** | |||
1 Notes: †NS, *,**,***Tests of linear correlation between variables were not significant (NS) or were significant at P ≤ 0.05, P ≤ 0.01, or P ≤ 0.001, respectively. aTurf visual quality ratings were assigned on a 1 to 9 scale, where 1 = poorest turf quality, 6 = minimally acceptable turf quality, and 9 = exceptional turf quality; bNDVI (Normalized Difference Vegetation Index) collected using a MicaSense Rededge-M (MicaSense, Inc.; Seattle, WA) sensor; cNDRE (Normalized Difference RedEdge Index) collected using a MicaSense Rededge-M (MicaSense, Inc.; Seattle, WA) sensor.