
Figure 1:
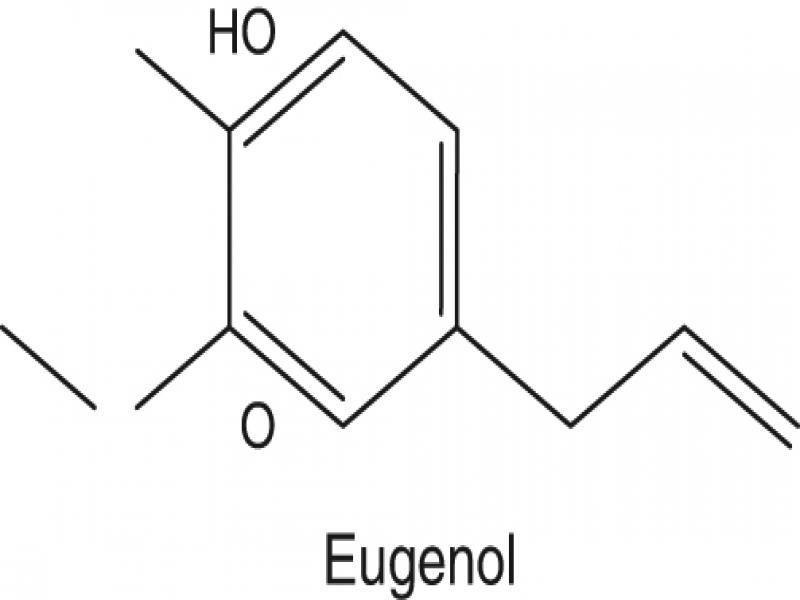
Figure 2:
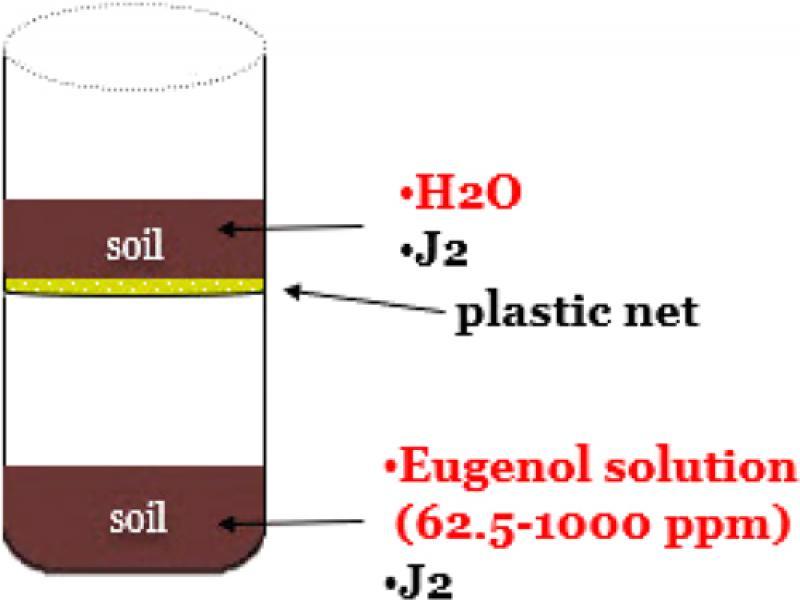
Figure 3:
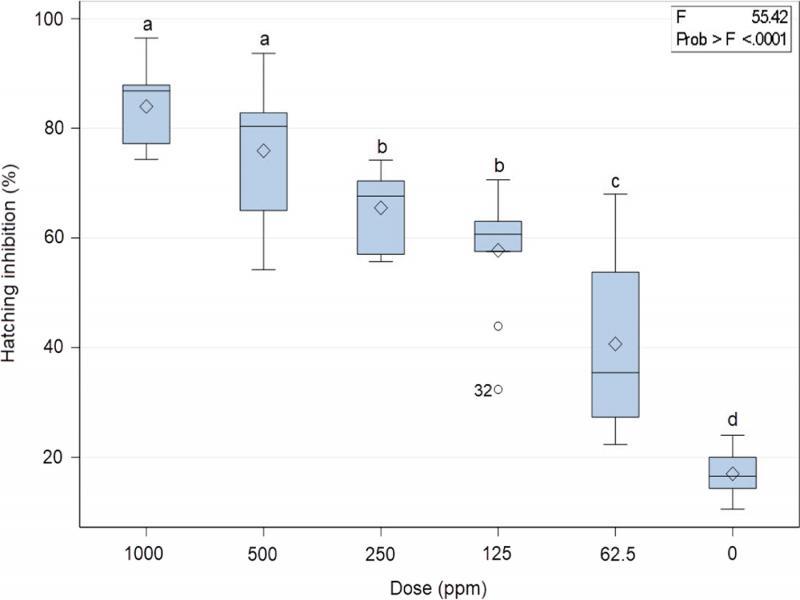
Figure 4:
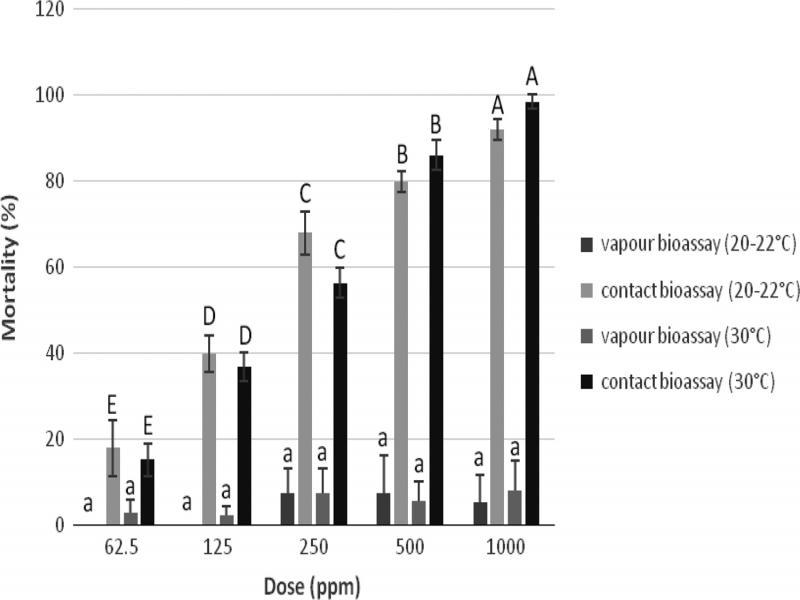
Figure 5:
Effect of eugenol on the motility of Meloidogyne javanica J2 after immersion in test solutions at the doses of 1,000, 500, 250, 125, 62_5, and 0 ppm for 12, 24, 48, and 96 hr_
| Exposure time (hr) | ||||
|---|---|---|---|---|
| 12 | 24 | 48 | 96 | |
| Dose (ppm) | Dead J2 (%) | Dead J2 (%) | Dead J2 (%) | Dead J2 (%) |
| 0 | 0 d | 0.8 d | 1.3 d | 4.7 e |
| 62.5 | 0.4 d | 1.6 d | 2.4 d | 10.7 d |
| 125 | 0.7 d | 2 d | 6.4 c | 19.8 c |
| 250 | 6.5 c | 6.9 c | 24.5 b | 80.8 b |
| 500 | 74.1 b | 92.2 b | 99.8 a | 100 a |
| 1000 | 99.5 a | 100 a | 100 a | 100 a |
Effect of eugenol on the differentiation of Meloidogyne javanica eggs, after immersion of undifferentiated eggs at different doses of 1,000, 500, 250, 125, 62_5, and 0 ppm_
| Exposure time (21 days) | |
|---|---|
| Dose (ppm) | Eggs differentiation (%) |
| 0 | 92.1 a |
| 62.5 | 90.6 a |
| 125 | 90.5 a |
| 250 | 82.1 a |
| 500 | 66.2 b |
| 1000 | 21.4 c |