
Table 1.
Statistical analysis of the effect of three factors (adjuvants, temperature and time of storage) and their interactions (GLM, P < 0.05) in the infective juvenile (IJ) survival measured as percentage of live IJ, and its virulence measured as larval mortality and number of days to kill the insects.
| Fixed factors | % Live IJs | % Dead larvae | No. days to die |
|---|---|---|---|
| Adjuvant (Adj) | F 2, 1,125 = 1.53; P = 0.217 | F 2, 1,125 = 15.31; P < 0.001 | F 2,786 = 0.69; P = 0.513 |
| Incubation temperature (Temp) | F 4, 1,125 = 228.95; P < 0.001 | F 4, 1,125 = 49.31; P < 0.001 | F 4,786 = 9.24; P < 0.001 |
| Incubation time (Time) | F 4, 1,125 = 2,309.61; P < 0.001 | F 4, 1,125 = 274.73; P < 0.001 | F 4,786 = 185.90; P < 0.001 |
| Adj × Temp | F 8, 1,125 = 17.40; P < 0.001 | F 8, 1,125 = 2.67; P = 0.007 | F 8, 786 = 1.86; P = 0.063 |
| Adj × Time | F 8, 1,125 = 2.31; P = 0.018 | F 8, 1,125 = 7.39; P < 0.001 | F 8, 786 = 3.26; P = 0.001 |
| Tem × Time | F 16, 1,125 = 136.59; P < 0.001 | F 16, 1,125 = 19.43; P < 0.001 | F 16, 786 = 10.89; P < 0.001 |
| Adj × Temp × Time | F 32, 1,125 = 5.52; P < 0.001 | F 32, 1,125 = 1.42; P = 0.061 | F 32, 786 = 2.11; P = 0.001 |
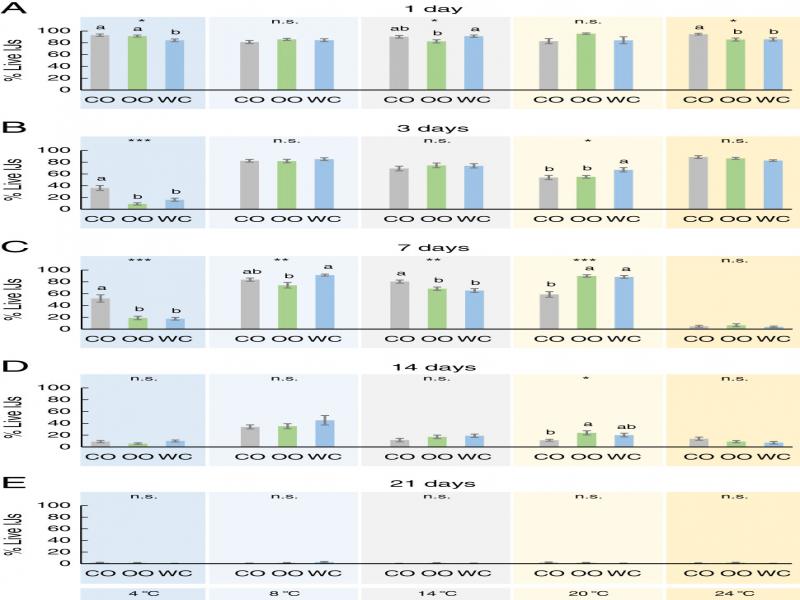
Figure 1:
Effect of three adjuvants employed in Steinernema colombiense combination, coconut oil (CO), olive oil (OO), and distilled water (WC), on the percentage of live (mobile) infective juveniles (IJs) previously incubated at five different temperatures (4-24°C) and for five different times (1-21 days). Asterisks indicate significant differences within treatment comparisons at *P < 0.05; **P < 0.01; ***P < 0.001, and n.s., not significant. Different letters indicate significant differences in Tukey’s test (HSD). Values are least-square means ± SE.
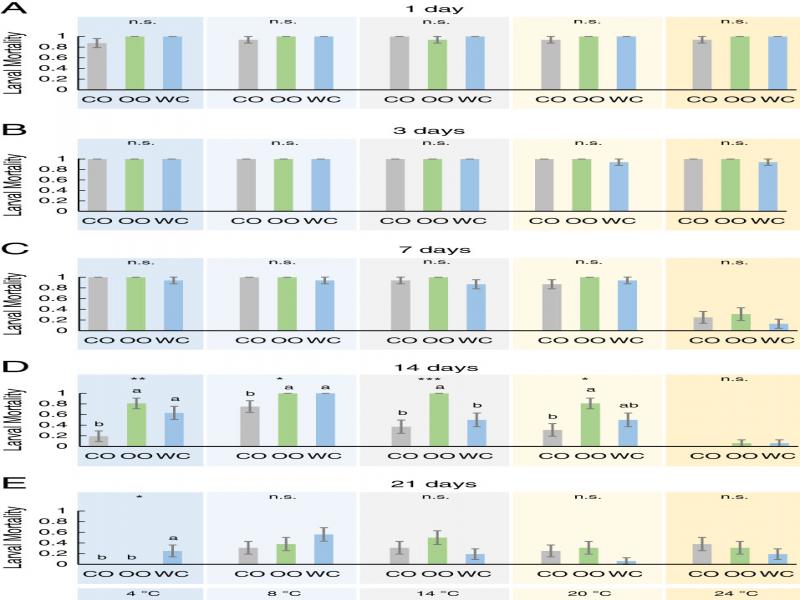
Figure 2:
Effect of three adjuvants employed in Steinernema colombiense combinations, coconut oil (CO), olive oil (OO), and distilled water (WC), on the frequency of larval mortality of last instar Galleria mellonella previously incubated at five different temperatures (4-24°C) and for five different times (1-21 days). Asterisks indicate significant differences within treatment comparisons at *P < 0.05; **P < 0.01; ***P < 0.001, and n.s., not significant. Different letters indicate significant differences in Tukey’s test (HSD). Values are least-square means ± SE.
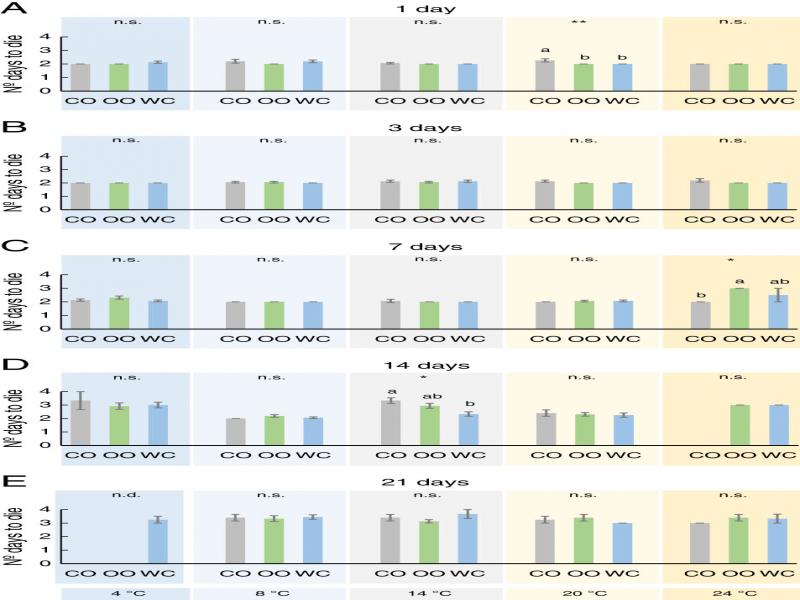
Figure 3:
Effect of three adjuvants employed in Steinernema colombiense combinations, coconut oil (CO), olive oil (OO), and distilled water (WC), on the number of days needed to kill last instar Galleria mellonella larvae previously incubated at five different temperatures (4-24°C) and for five different times (1-21 days). Asterisks indicate significant differences within treatment comparisons at *P < 0.05; **P < 0.01; ***P < 0.001, and n.s., not significant. Different letters indicate significant differences in Tukey’s test (HSD). Values are least-square means ± SE.
Table 2.
Interactions of the co-application of entomopathogenic nematodes and entomopathogenic fungi formulated in different adjuvants for the suppression of Galleria mellonella larvae after.
| Adjuvant | Observed mortalitya | Expected mortalityb | χ 2 | Interaction |
|---|---|---|---|---|
| Distilled water | 81.3 | 76.6 | 0.28 | Additive |
| Cocoa oil | 81.5 | 76.6 | 0.31 | Additive |
| Olive oil | 87.8 | 76.6 | 1.58 | Additive |
1 Notes: aObserved mortality (%), average of 16 replicates in two trials (32 total); bexpected mortality (%), calculated M E = M T1 + M T2 × (1 − M T1) for combination of two organisms applied on the larvae, where M T1 and M T2 are the mortalities from Steinernema colombiense and Beauveria bassiana single applied, respectively.
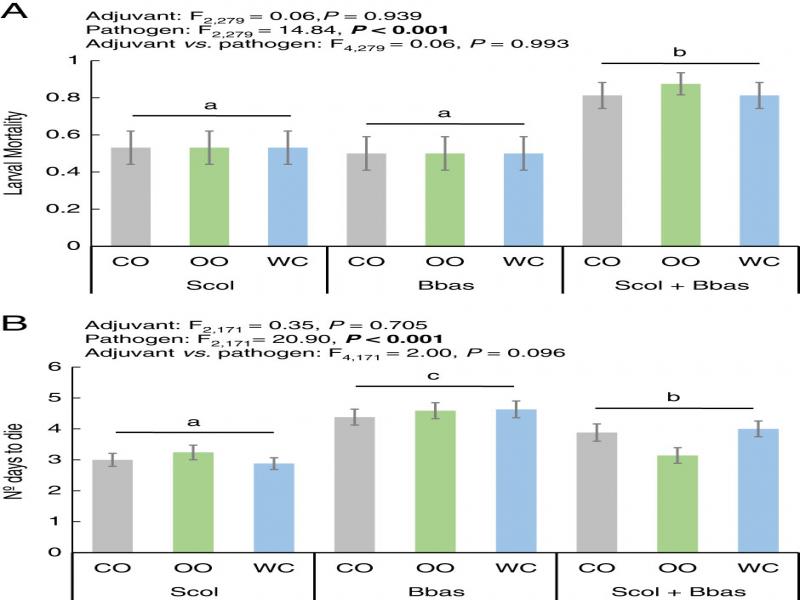
Figure 4:
Virulence of Steinernema colombiense (Scol) and Beauveria bassiana (Bbas), single applied or combined (Scol+Bbas), combined with coconut oil (CO), olive oil (OO), and distilled water (WC). A: Frequency of last instar Galleria mellonella larval mortality. B: Number of days needed to kill the insect larva. Different letters indicate significant differences in Tukey’s test (HSD). Values are least-square means ± SE. Significant differences for GLM analysis (P < 0.05) are highlighted in bold.