
Table 1.
Correlation coefficient between the density of R. reniformis, the percentage of yellowing leaves, dry rot rhizomes, and rhizome weight.
| Correlations | R. reniformis | Yellowing leaves | Dry rot rhizome |
|---|---|---|---|
| Yellowing leaves | |||
| Pearson (RP) | 0.355 | ||
| Spearman (RS) | 0.640* | ||
| Dry rot rhizome | |||
| Pearson (RP) | 0.781** | 0.601 | |
| Spearman (RS) | 0.506 | 0.838** | |
| Rhizome weight | |||
| Pearson (RP) | −0.623 | −0.480 | −0.600 |
| Spearman (RS) | −0.841** | −0.502 | −0.519 |
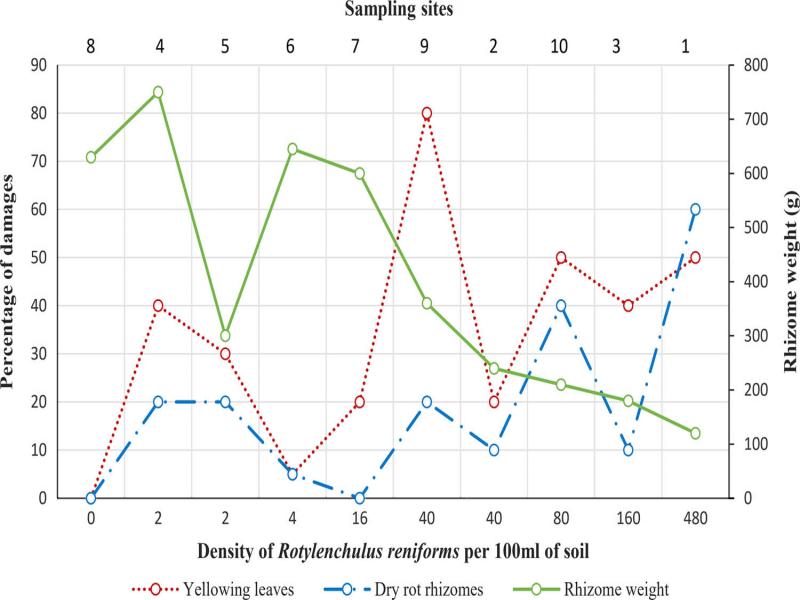
Figure 1:
Graph showing the relationship between the density of R. reniformis and rhizome weight, and percentage of yellowing leaves and dry rot rhizomes.
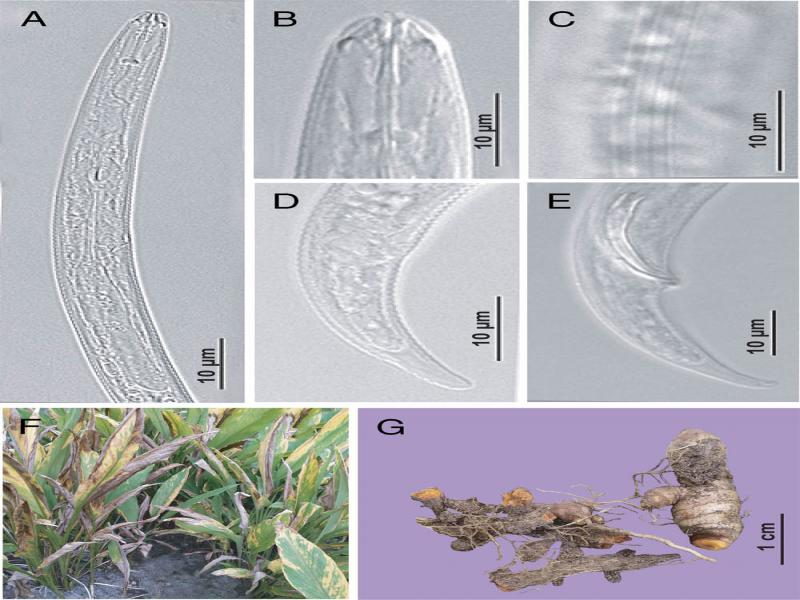
Figure 2:
LM pictures of R. reniformis and disease symptoms of turmeric in studied growing area. A−D: Immature female. A: Pharyngeal region; B: Labial region; C: Lateral field; D: Tail region of immature female; E: Tail region of male; F: Aerial part; G: Underground part.