
Table 1.
Schedule for data collection and trial maintenance.
| Task | 2017 | 2018 |
|---|---|---|
| Preplant soil samples | 10 April (39) | 29 March (52) |
| 1,3-D applied | 5 May (14) | 4 May (16) |
| Peanuts planted/in-furrow aldicarb and fluopyram applied | 19 May | 20 May |
| Midseason soil samples | 20 July (62) | 26 July (67) |
| Harvest soil and root samples | 19 September (122) | 24 September (126) |
| Peanuts inverted | 2 October (135) | 15 October (147) |
| Peanuts combined | 5 October (138) | 21 October (153) |
Table 2.
Total herbivore and root-knot nematode abundances/100 cm3 soil as affected by nematicide application.
| Pi a | Pm | Pf | |
|---|---|---|---|
| Herbivores | |||
| Nematicide | |||
| Control | 606 | 348 | 1,506 |
| Aldicarb | 310 | 370 | 1,428 |
| Fluopyram | 321 | 375 | 1,779 |
| 1,3-Dichloropropene | 326 | 350 | 1,088 |
| ANOVA b | |||
| Nematicide (N) | ns | ns | ns |
| Year × Nematicide | ns | ns | ns |
| Root-knot nematodes−2017 | |||
| Nematicide | |||
| Control | 30 | 64 | 1,755 |
| Aldicarb | 26 | 69 | 1872 |
| Fluopyram | 58 | 72 | 2,284 |
| 1,3-Dichloropropene | 7 | 33 | 1,041 |
| ANOVA | |||
| Nematicide (N) | ns | ns | ns |
| Root-knot nematodes−2018 | |||
| Nematicide | |||
| Control | 725 | 12 | 348 |
| Aldicarb | 437 | 11 | 35 |
| Fluopyram | 403 | 13 | 281 |
| 1,3-Dichloropropene | 549 | 0 | 26 |
| ANOVA | |||
| Nematicide (N) | ns | ns | ns |
1 Notes: Herbivores are displayed for 2017 and 2018 trials combined. Root-knot nematode values are displayed for 2017 and 2018 separately. aPi, Pm, and Pf are mean values prior to planting, at midseason (62 and 67 days after planting in 2017 and 2018), and at harvest, respectively. bns represents not significant at P > 0.05.
Table 3.
Fungivores abundances/100 cm3 soil as affected by nematicide application for 2017 and 2018 trials combined.
| Pi a | Pm b | Pf | |||
|---|---|---|---|---|---|
| Fungivores | |||||
| Nematicide | |||||
| Control | 198 | 159 | a | 245 | ab |
| Aldicarb | 214 | 82 | ab | 229 | ab |
| Fluopyram | 217 | 130 | a | 323 | a |
| 1,3-Dichloropropene | 203 | 29 | b | 168 | b |
| ANOVAc | |||||
| Nematicide (N) | ns | * | * | ||
| Year × Nematicide | ns | ns | ns | ||
| Filenchus | |||||
| Nematicide | |||||
| Control | 42 | 31 | a | 58 | |
| Aldicarb | 27 | 19 | ab | 46 | |
| Fluopyram | 37 | 40 | a | 65 | |
| 1,3-Dichloropropene | 23 | 6 | b | 46 | |
| ANOVA | |||||
| Nematicide (N) | ns | * | ns | ||
| Year × Nematicide | ns | ns | ns | ||
| Aphelenchus | |||||
| Nematicide | |||||
| Control | 55 | 33 | a | 48 | |
| Aldicarb | 52 | 19 | ab | 51 | |
| Fluopyram | 63 | 27 | ab | 63 | |
| 1,3-Dichloropropene | 66 | 11 | b | 23 | |
| ANOVA | |||||
| Nematicide (N) | ns | * | ns | ||
| Year × Nematicide | * | ns | ns | ||
| Aphelenchoides | |||||
| Nematicide | |||||
| Control | 85 | 34 | 135 | ||
| Aldicarb | 121 | 20 | 126 | ||
| Fluopyram | 104 | 27 | 185 | ||
| 1,3-Dichloropropene | 109 | 11 | 92 | ||
| ANOVA | |||||
| Nematicide (N) | ns | ns | ns | ||
| Year × Nematicide | ns | ns | ns | ||
1 aPi, Pm, and Pf are mean values prior to planting, at midseason (62 and 67 days after planting in 2017 and 2018), and at harvest, respectively. bValues followed by different letters in the same column for the same variable are significantly different according to Fischer’s LSD at P < 0.05. *Represent significant effects at P ≤ 0.05; ns represents not significant at P > 0.05.
Table 4.
Bacterivore abundances/100 cm3 soil as affected by nematicide application for 2017 and 2018 trials combined.
| Pia | Pm | Pf | |
|---|---|---|---|
| Bacterivores | |||
| Nematicide | |||
| Control | 515 | 356 | 360 |
| Aldicarb | 508 | 305 | 360 |
| Fluopyram | 540 | 337 | 484 |
| 1,3-Dichloropropene | 555 | 351 | 395 |
| ANOVAb | |||
| Nematicide (N) | ns | ns | ns |
| Year × Nematicide | ns | ns | ns |
| Cephalobus | |||
| Nematicide | |||
| Control | 274 | 123 | 148 |
| Aldicarb | 228 | 97 | 153 |
| Fluopyram | 257 | 115 | 184 |
| 1,3-Dichloropropene | 261 | 123 | 144 |
| ANOVA | |||
| Nematicide (N) | ns | ns | ns |
| Year × Nematicide | ns | ns | ns |
| Eucephalobus | |||
| Nematicide | |||
| Control | 50 | 56 | 46 |
| Aldicarb | 79 | 57 | 47 |
| Fluopyram | 63 | 59 | 82 |
| 1,3-Dichloropropene | 94 | 69 | 68 |
| ANOVA | |||
| Nematicide (N) | ns | ns | ns |
| Year × Nematicide | ns | ns | ns |
| Acrobeles | |||
| Nematicide | |||
| Control | 72 | 70 | 24 |
| Aldicarb | 92 | 66 | 35 |
| Fluopyram | 83 | 75 | 36 |
| 1,3-Dichloropropene | 74 | 91 | 44 |
| ANOVA | |||
| Nematicide (N) | ns | ns | ns |
| Year × Nematicide | ns | ns | ns |
Table 5.
Omnivore-predator abundances/100 cm3 soil and diversity as affected by nematicide application for 2017 and 2018 trials combined.
| Pi a | Pm | Pf | |
|---|---|---|---|
| Omnivore-predators | |||
| Nematicide | |||
| Control | 37 | 19 | 33 |
| Aldicarb | 50 | 24 | 29 |
| Fluopyram | 38 | 11 | 19 |
| 1,3-Dichloropropene | 40 | 27 | 45 |
| ANOVA b | |||
| Nematicide (N) | ns | ns | ns |
| Year × Nematicide | ns | ns | ns |
| Aporcelaimellus | |||
| Nematicide | |||
| Control | 22 | 9 | 12 |
| Aldicarb | 27 | 11 | 15 |
| Fluopyram | 16 | 6 | 6 |
| 1,3-Dichloropropene | 16 | 14 | 17 |
| ANOVA | |||
| Nematicide (N) | ns | ns | ns |
| Year × Nematicide | ns | ns | ns |
| Hill’s N1 Genera Diversity | |||
| Nematicide | |||
| Control | 6.9 | 7.7 | 5.6 |
| Aldicarb | 8.8 | 7.9 | 5.6 |
| Fluopyram | 8.9 | 7.3 | 5.6 |
| 1,3-Dichloropropene | 8.1 | 5.9 | 6.2 |
| ANOVA | |||
| Nematicide (N) | ns | ns | ns |
| Year × Nematicide | ns | ns | ns |
| Hill’s N1 Guild Diversity | |||
| Nematicide | |||
| Control | 3.9 | 4.2 | 2.9 |
| Aldicarb | 4.6 | 4.3 | 3.0 |
| Fluopyram | 4.5 | 4.1 | 2.9 |
| 1,3-Dichloropropene | 4.2 | 3.6 | 3.2 |
| ANOVA | |||
| Nematicide (N) | ns | ns | ns |
| Year × Nematicide | ns | ns | ns |
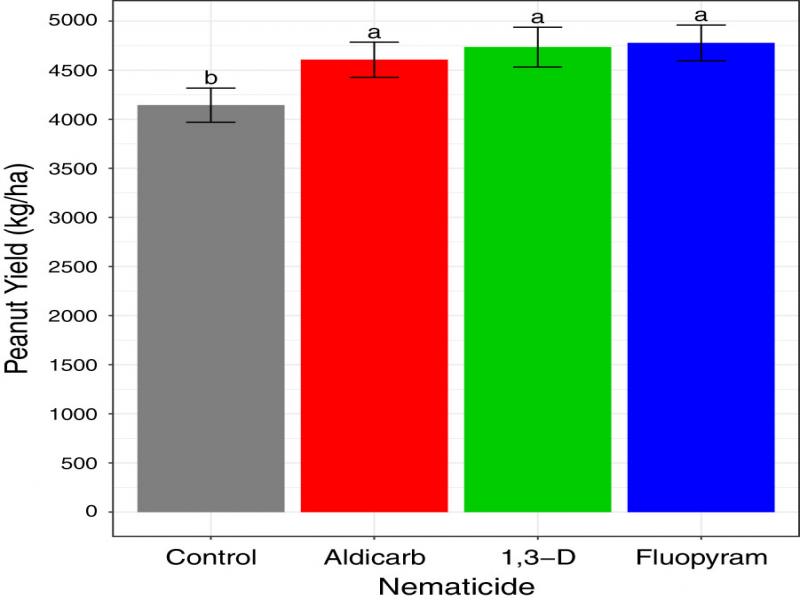
Figure 1:
2017 peanut yield as affected by nematicide treatments. Different letters indicate significantly different means based on Fisher’s protected LSD at α = 0.05.