Entomopathogenic nematodes (EPNs) species belonging to the genera Steinernema Travassos, 1927 and Heterorhabditis Poinar, 1975 and their symbiotic bacteria from genera Xenorhabdus and Photorhabdus, respectively, are lethal parasites of soil inhibiting insects (Shapiro-Ilan et al., 2017). Globally, EPNs are being widely researched as promising biocontrol agents for wide range of agricultural pests (Lacey et al., 2015). Because of the increasing awareness of EPN as an effective non-chemical alternative to control insect pests, many surveys have been and are being carried out across the globe to isolate new species and/or population of these nematodes that are either more virulent and/or locally adapted to the region’s environmental conditions (Yan et al., 2016; Tarasco et al., 2015). Interest has also been shown in isolating novel species and strains that have characteristic traits, for example species with: improved heat tolerance (Shapiro et al., 1996; Wetchayunt et al., 2009), desiccation tolerance (Salame et al., 2010; Solomon et al., 1999), high reproductive potential (Salame et al., 2010), foraging ability (Noosidum et al., 2010), virulence (Shapiro-Ilan et al., 2009; Yu et al., 2010) and cold tolerance (Ivanova et al., 2001; Wright and Jackson, 1988) have been found in recent surveys. Discovery of new isolates/strains and species has substantially bolstered the commercial success of EPN biocontrol agents against pests (Lacey and Georgis, 2012; Shapiro-Ilan et al., 2002).
In Fiji, there are several coleopteran, dipteran, lepidopteran and isopteran species that are serious agricultural pests and cause great economic losses (Furlong, 2010; Moxon et al., 2008; Waterhouse, 1997). Fiji has a long history of biocontrol of insect pests which began in early 1910s (Kamath, 1979). However, by 1960s, farmers started using pesticides to control insect pests (Autar, 2000) which has resulted in emergence of issues like development of insect resistance to chemical pesticides (Atumurirava and Furlong, 2011) and rise in health problems in the farmers that rely on chemical pesticides for crop protection (Szmedra, 2002) forcing the policy makers to shift their focus from chemical intensive pest management to alternative control strategies or integrated pest control methods. Since the 1980s, focus has been shifted to more integrated approach with greater emphasis to the use of biocontrol agents together with the use of safer pesticides (Autar, 2000). Various biocontrol agents are being increasingly explored by Fiji, e.g. parasitoids (Bale et al., 2008), virus (Jackson, 2009), predators (Upadhyay et al., 2012) and fungus (Day et al., 2013; Pene et al., 2007) and have been successfully employed to control insect pests and weeds. However, in Fiji, little or no attention has been given to EPNs in biocontrol programs due to the lack of awareness about EPNs and of local expertise in this field. There are several target pests in Fiji that can be potentially managed with EPNs and this area of research remains largely unexplored. Therefore, the exploration of indigenous EPN species was carried out for the first time to acquire a new resource for biological control of insect pests.
Material and methods
Site description
The Fiji Islands (Fig. 1) lie in the South Pacific Ocean between 174°E and 178°W longitude and 12° and 22°S latitude (Morrison et al., 1990). The Fiji archipelago consists of 330 islands covering a land area of 18,376 km2 (Mataki et al., 2006). Out of 330 islands only 100 are inhabited. Most of the islands belonging to this archipelago are of volcanic origin. Viti Levu (10.642 km2) is the oldest and the largest island of this Archipelago, and makes 57% of the land area. Around 65% of the Viti Levu is characterized by steep mountainous terrain with slope of 18° to 70°, whereas 20% is covered by gentle slope and 15% by flat land which is restricted only to the lowland valleys (Ash and Ash, 1984; Morrison et al., 1990). In Viti Levu, plains and plateau have elevation ranging between 100 and 500 m above sea level (a.s.l.) (Morrison et al., 1990), whereas the mountain height ranges between 900 and 1,320 m a.s.l. These mountains divide the island of Viti Levu into a windward south-eastern side and a leeward western side (Manueli et al., 1999; Neall and Trewick. 2008). Due to the orographic effect of these mountains, moisture laden southeast trade winds cause average annual rainfall between 305 and 345 cm on the “wet” windward side, whereas the western leeward side remains dry with average annual rainfall between 165 and 229 cm. Wet windward side of the island is covered with moist tropical forest, whereas the dry leeward side is dominated by grass, fern and introduced invasive elements (Evenhuis and Bickel, 2005). Fiji’s climate is humid tropical and experiences two seasons: winter (between May and October) and summer (between November and April). The winters are cool and dry with average temperature range of 19°C to 22°C while summers are hot and humid with average temperature range of 31°C to 34°C.
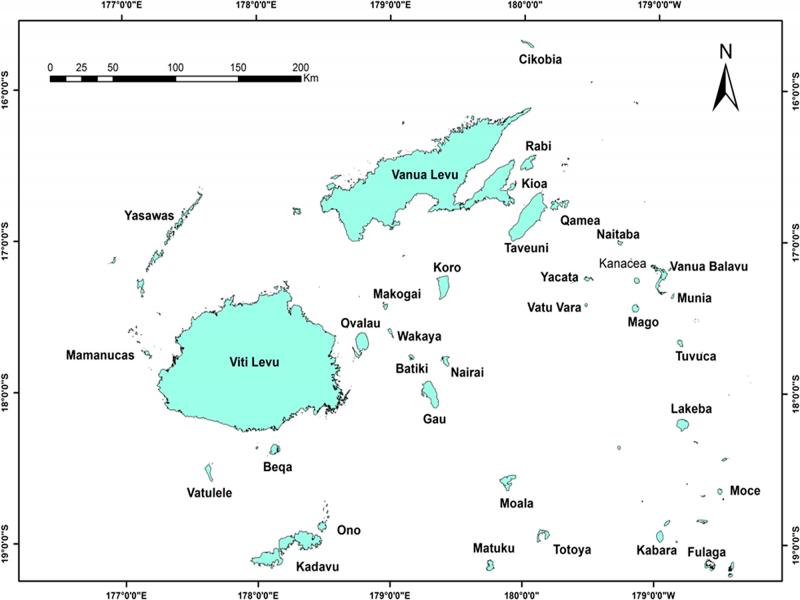
Figure 1:
Map of Fiji Islands.
Sampling method
The survey was conducted in Viti Levu. Soil samples were randomly collected from diverse habitats from March 2012 until July 2013 covering all the eight provinces (Rewa, Ba, Tailevu, Ra, Nadroga-Navosa, Namosi, Serua and Naitasiri) of Viti Levu. In total, 478 sites were sampled. In each province, the samples were collected from coastline, lowland (cultivated and natural habitats), and highland areas representing different habitat types. Viti Levu has a very steep mountainous terrain and the locations for sampling were also chosen based on the road accessibility and reachability. The approximate distance between two sampling sites was 3 to 4 km. At each sampling site (≈100 m2), 12 to 15 soil samples were taken from surface up to the depth of 20 to 25 cm using a soil corer with a bore size 3.2 cm. The samples were pooled together and thoroughly mixed to make a final composite site sample of approximately 2 kg. GARMIN eTrex Vista GPS unit (global positioning system) was used to record the sampling site positions. Each composite soil sample was placed in a zip lock plastic bag and labeled for site name and date of collection. Notes on the surrounding vegetation at the sampling site were also taken. The environmental habitat immediately surrounding each sampling site was recorded as one of the following categories: Grassland, Garden/Park, Farmland, Forest, Riverside, Coastline/Dunes and Roadside verge. To our knowledge, no EPN based products were ever released at any of the 478 sites sampled. Site locations were plotted on base map using software ArcMap version 10.4.1. The soil sampler was sterilized with 70% ethanol before leaving the sampling site.
Isolation of entomopathogenic nematodes
The soil samples were processed on the site to isolate native EPNs using wax moth Galleria mellonella (Lepidoptera: Pyralidae) larvae as the insect bait (Bedding and Akhurst, 1975). Freshly harvested G. mellonella larvae (last instar) which were immersed in hot water (60°C) for 20 sec to prevent them from forming a cocoon were used as bait. Immediately after collecting, each soil sample was placed in a 250 ml plastic container with a lid, in which six G. mellonella larvae were added in the field. Three larvae were placed at the bottom and three in the middle of the soil. This was replicated three times. Therefore, in total for each site 750 ml of soil was baited with 18 larvae. When needed, the soil samples were moistened with distilled water to facilitate the movement of IJs (Nielsen et al., 2004). The plastic containers (with soil and bait) and leftover soil were placed in an insulated container and transported to laboratory. In laboratory, the plastic containers were placed upside down and incubated at room temperature (≈25°C). After 48 hr of incubation, the containers were checked daily for two weeks and any dead larvae were removed from the soil, and the color of the cadaver was recorded. Dead larvae were thoroughly rinsed with distilled water and transferred to modified White Traps (White, 1927). White traps were kept at room temperature (≈25°C) until the emergence of the IJs and were tested for Koch’s postulates. The emerging IJs were collected in sterile deionized water and stored in a 750 ml tissue culture flask at 15°C for morphological and molecular characterization. The EPN laboratory populations were maintained by passing through the host G. mellonella larvae every 3 to 4 months’ interval.
Identification of nematodes
To identify isolates of EPN at species level both morphometric and molecular examinations were made. Molecular analysis was considered as the primary approach. Molecular characterization of the isolates was performed by analysis of the ITS rDNA sequences.
Molecular characterization
Individual adult nematodes were dissected from infected G. mellonella cadavers. Total genomic DNA was extracted from a single hermaphroditic female as described by Kaspi et al. (2010). DNA samples were stored at −20°C until the next stage of processing. Polymerase chain reaction (PCR) was used to amplify the region of nuclear rDNA. The targeted segment which included: partial 18 S 3´ end, ITS1, ITS2, 5.8 S subunit, and partial 28 S 5´ end were amplified using primers no. 93, 5´ TTGAACCGGGTAAAAGTCG (forward primer) and no. 94, 5´ TTAGTTTCTTTTCCTCCGCT (reverse primer) designed by Nadler et al. (2000). The PCR-product was purified using ExoSAP-IT kit (Affymetric, Inc.). The purified products were sent to a sequencing service in Seoul, Korea (Macrogen, Korea). The sequencing raw data were visualized, edited and assembled by using DNABaser Sequence Assembler software version 3.5.4.2 (http://www.dnabaser.com/index.html). The full length sequence of native isolates was confirmed to comprise of ITS1, 5.8 S and ITS2 region by alignment with the corresponding sequence of C. elegans (Ellis et al., 1986). The consensus sequences obtained were deposited in GenBank. For species identification, the obtained sequences were used for a Basic Local Alignment Search Tool (BLAST) search at National Center for Biotechnology Information website http://blast.ncbi.nlm.nih.gov/Blast.cgi and were compared with the sequences of the species already deposited in international GenBank database. Multiple alignments of sequences obtained with GenBank ITS sequences from Heterorhabditis species gene sequences were obtained using Clustal X (version 1.83) (Larkin et al., 2007). Maximum parsimony analysis was conducted in MEGA 6.06 (Tamura et al., 2013). Bootstrap analysis was carried out with 1,000 data sets. The phylogenetic analyses provided further support for species identification. The genetic variability among Fiji populations was also analyzed using ITS1 and ITS2 regions.
Morphometric characterization (light microscopy)
Based on the result of molecular analyses, selected isolates RATA, SSSX and DUNF were subjected to morphometric examination. Nematodes were reared in last instar of G. mellonella larvae as described by Nguyen (2007). For each isolates to be examined, 20 specimens from each stage were randomly collected from different G. mellonella cadavers. First generation hermaphrodites, and second generation males and females were heat killed at 60°C in normal saline and fixed in triethanolamine formalin (TAF) as described by Hominick et al. (1997). Once fixed, nematodes were then processed to anhydrous glycerin as per Seinhorst (1959). The nematodes were mounted in desiccated glycerin on glass slides. IJs were examined live by placing on glass slide in a drop of water and covered with a coverslip. The slides were examined after a few minutes when the IJs became motionless. The live IJs were directly used for microscopic observations as key characteristics such as “excretory pore” and “base of esophagus” were clearly visible as opposed to in heat killed and TAF fixed IJs. All measurements were made using compound light microscope Olympus BX51 equipped with digital image software. The following morphometric characters were analyzed: total body length, greatest body width, distance from anterior end to excretory pore, distance from anterior end to nerve ring, distance from anterior end to base of esophagus, tail length, anal body width, spicule length, gubernaculum length, testis reflexion, values of ratio a, ratio b, ratio c, V%, D%, E%, SW% and GS%.
Soil characterization
Soil parameters like temperature and pH were recorded in situ at the depth of 10 to 12 cm during soil sample collection by using Hanna HI 99121 pH meter. Soil volumetric moisture (%) was recorded in situ by using soil moisture meter LT Tutron PMS-714 EZTECH PMS-714. Facilities at Fiji Agricultural Chemistry Laboratory, Koronivia Research Station, Nausori were used for measurement of soil particle size and measurement of soil organic content. Soil particle size analysis was performed to calculate the % of sand, silt and clay in soil sample and to determine the overall soil texture at each sample site. The method adapted from the New Zealand Standard NZS4402 (Standards Association of New Zealand, 1980) along with the method described by Claydon (1989) was used to calculate Sand/ silt/clay percentages each sample. The New Zealand classification system was followed to classify soil particle as: clay (<0.002 mm), silt (0.002-0.06 mm) and sand (0.06-2.0 mm) (Hewitt, 1992). The New Zealand soil triangle and soil texture class (clay, clay loam, fine sand, loam, loamy fine sand, sandy clay, sandy clay loam, sandy loam, silt loam, silt clay and silty clay loam) as defined by Milne (1995) was used to determine the texture of the sampled site. Total organic matter for each soil sample was determined by wet oxidation as described by Walkley and Black (1934).
Meteorological data
The long-term mean annual rainfall, long-term mean annual maximum air temperature and minimum air temperature data of the different localities from 1971 to 2000 were obtained from 11 weather stations closest to the sampling sites with the help of Nadi center of Fiji Meteorological service. The data from 11 weather stations (Laucala Bay, Tamavua, Nausori, Koronivia, Nadi Airport, Rarawai, Penang, Nacocolevu, Lautoka, Navua and Monasavu) in Viti Levu were used in current study.
Data analysis
The percentage occurrence of EPNs is reported in terms of recovery frequency (number of positive samples/number of total samples). The occurrence of EPNs was then plotted against habitat type, soil characters, geographical location and environmental variables. Relationships between the occurrence of EPNs and categorical variables (i.e. climatic zone, habitat type, province, and soil texture) were statistically determined using Crosstabs and Pearson’s χ2 test of Independence at α = 5% level of significance (Agresti, 1996). For continuous variables like soil parameters (soil moisture, soil pH, soil organic content and soil temperature) and environmental variables (average annual rainfall, average annual temperature max. and min.), a test for normality was performed to see if test assumptions are not violated. All the continuous variables violated the normality assumptions and hence, non-parametric Mann–Whitney Test was used to study any relationships between the occurrence of EPN and the continuous variables. Statistical analysis was performed using SPSS 21.0 software for Windows XP.
Results
Occurrence of entomopathogenic nematodes by province
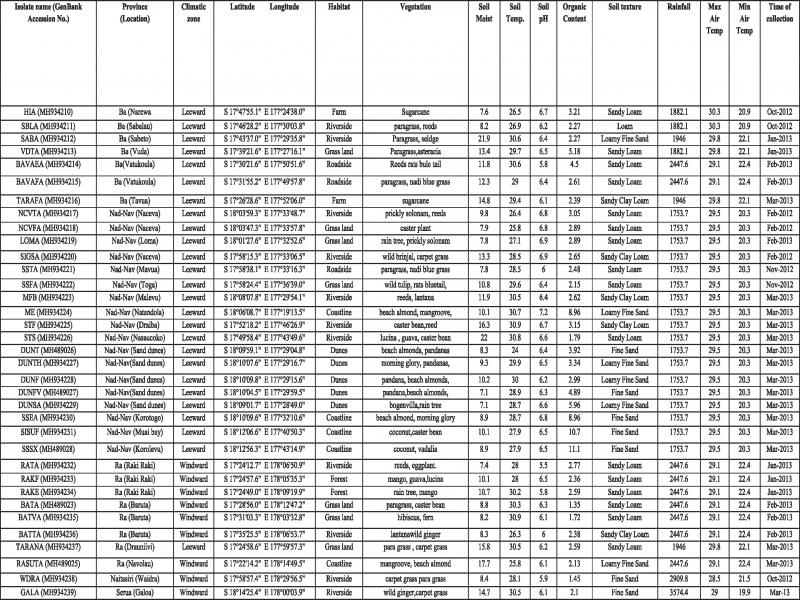
EPNs were isolated from 35 of 478 (7.3%) sites sampled around Viti Levu (Fig. 2). All the 35 sites were positive for the presence of the Heterorhabditis species. None of the sites was positive for Steinernema. The highest number of positive samples was recorded from the Nadroga-Navosa province (18.2%), followed by Ra (12.3%) and Ba (4.5%). Soil samples collected from Namosi, Rewa and Tailevu were negative for EPN (Table 3).
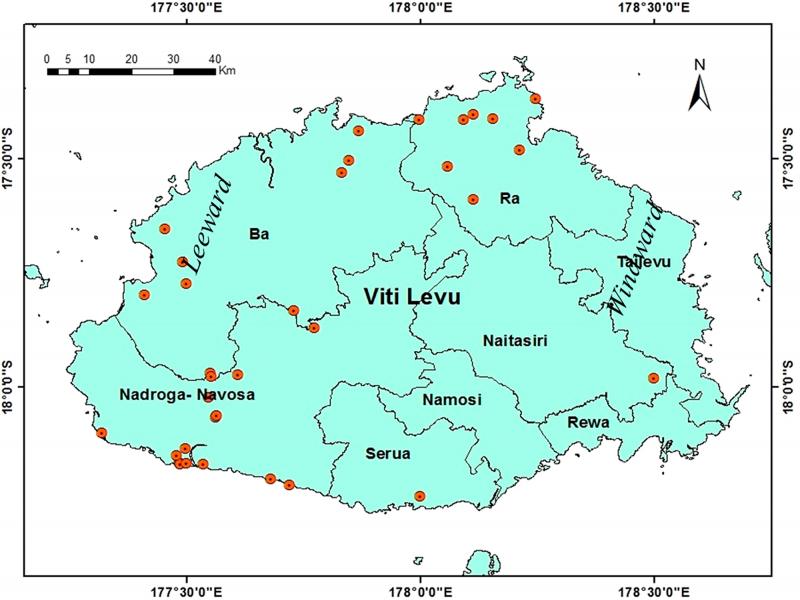
Figure 2:
Map of Viti Levu showing sites where entomopathogenic nematodes were found.
Molecular characterization
PCR of the entire ITS region amplified a single band composed of the partial 18 S, ITS1, 5.8 S, ITS2 and partial 28 S. The sequence length of ITS region of native isolates from Viti Levu varied from 771 to 989 base pairs. A BLAST search of GenBank database using ITS region of native isolates indicated that all isolates belong to the genus Heterorhabditis and showing 100 to 99% similarity with the Heterorhabditis indica species isolated from different geographical regions of the world. The next closest species is H. neonieputensis (#JN620538), with 98% sequences identity. Phylogenetic analysis grouped native isolates with H. indica and confirms the identity of native isolates (Fig. 3). Comparison between sequence of native isolates and H. indica (AY321483) shows that native isolates differ from each other and H. indica (AY321483) by eight base pair difference; one transition (A-G) at position 45 and one transversion at position 329 in ITS1 region; two transversion (T-A) at position 586 and 587, three transition (G-A) at position 589, 629 and 718 and a gap at 629 in ITS2 region. The difference in the ITS region for native isolate and H. indica (AY321483) has been highlighted in Table 1.
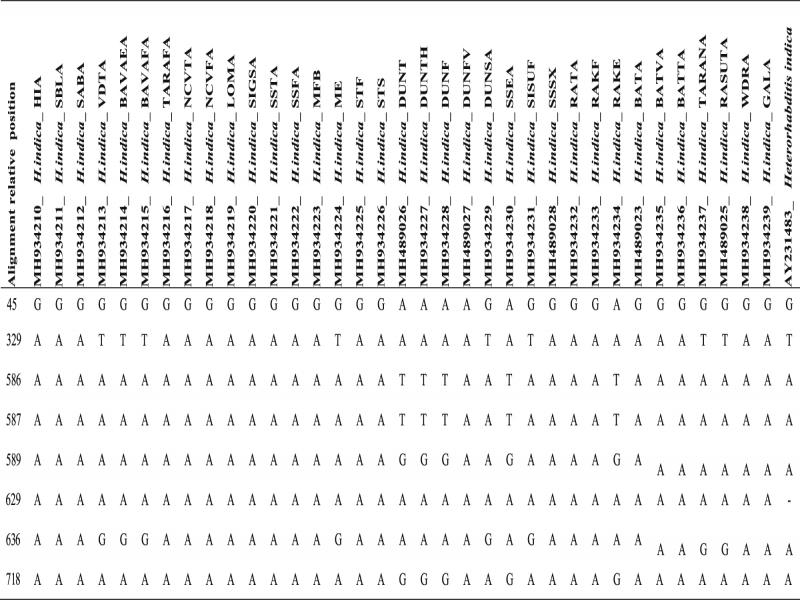
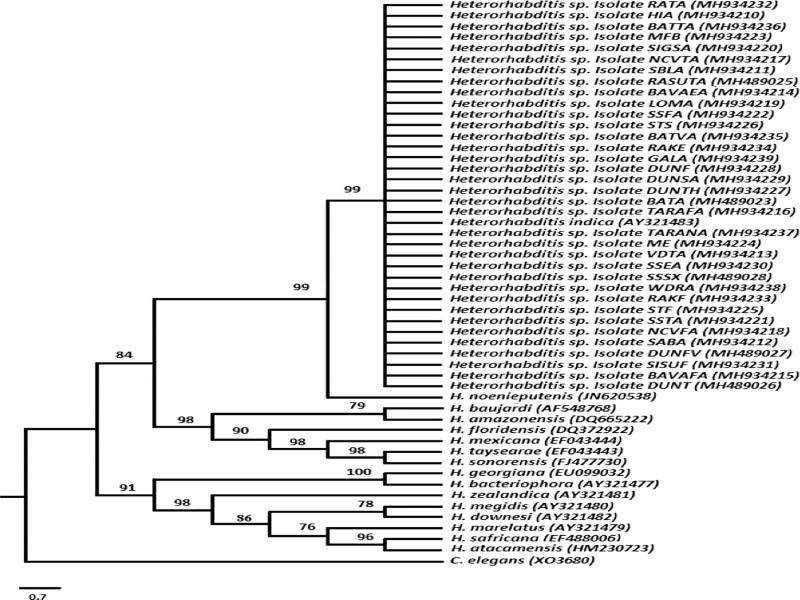
Figure 3:
Maximum parsimony tree inferred from sequence of ITS rDNA regions in 17 known Heterorhabditis species and native isolates of Heterorhabditis spp., with C. elegans as out group. Numbers at the nodes represent bootstrap values.
Morphometric characterization
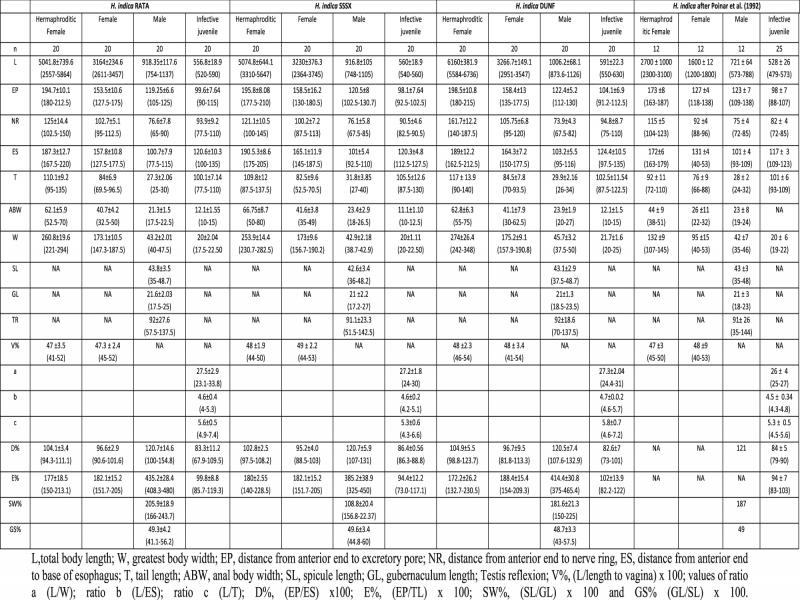
Body length of IJ is from 520 to 630 μm with long tail (77.5-130 μm). Except for isolate DUNF, value for EP (98.1-99.6 μm) is like type species H. indica. Ratio c is also comparable to the range of H. indica. Male body measured from 748 to 1,137 μm which is longer than the length given for type species H. indica. Testis reflexion measured from 91 to 92, like type species H. indica. Similarly, the both female and hermaphrodite of native isolates were much bigger in size for type species H. indica. The comparison of the measurements of the native isolates with that of the type population of H. indica are given in Table 2.
H. indica occurrence and habitat type
Coastline and sand dunes were most H. indica rich habitats (25%), followed by river banks (15.1%). Gardens and parks were negative for H. indica (Table 3). In Viti Levu, habitat type had significant association with H. indica presence, (χ 2 (6, N = 478) = 36.01, p < 0.001).
Table 3.
Occurrence of entomopathogenic nematodes in different province and habitat types.
| Categories | Total samples | Positive samples | Recovery frequency (%) |
|---|---|---|---|
| Province | |||
| Ba | 154 | 7 | 4.5 |
| Nadroga-Navosa | 99 | 18 | 18.2 |
| Naitisiri | 43 | 1 | 2.3 |
| Namosi | 19 | 0 | 0 |
| Ra | 65 | 8 | 12.3 |
| Rewa | 33 | 0 | 0 |
| Serua | 27 | 1 | 3.7 |
| Tailevu | 38 | 0 | 0 |
| Habitat type | |||
| Coastline/Dunes | 40 | 10 | 25 |
| Farm | 71 | 2 | 2.81 |
| Forest | 125 | 2 | 1.6 |
| Gardens/Park | 10 | 0 | 0 |
| Grassland | 136 | 7 | 5.14 |
| Riverside | 79 | 12 | 15.1 |
| Roadside verge | 17 | 2 | 11.7 |
| Categories | Total samples | Positive samples | Recovery frequency (%) |
|---|---|---|---|
| Sand content (%) | |||
| <30 | 142 | 0 | 0 |
| 30-45 | 132 | 1 | 0.75 |
| 45-60 | 87 | 5 | 5.7 |
| 60-75 | 67 | 15 | 22.3 |
| 75-90 | 41 | 8 | 19.5 |
| >90 | 9 | 6 | 66.6 |
| Silt content (%) | |||
| <20 | 177 | 26 | 14.6 |
| 20-30 | 150 | 7 | 4.6 |
| 30-40 | 92 | 0 | 0 |
| 40-50 | 43 | 2 | 4.6 |
| 50-60 | 12 | 0 | 0 |
| >60 | 4 | 0 | 0 |
| Clay content (%) | |||
| <20 | 126 | 31 | 24.6 |
| 20-30 | 114 | 4 | 3.5 |
| 30-40 | 137 | 0 | 0 |
| 40-50 | 60 | 0 | 0 |
| 50-60 | 29 | 0 | 0 |
| 60-70 | 11 | 0 | 0 |
| >70 | 1 | 0 | 0 |
| Soil texture | |||
| Clay | 96 | 0 | 0 |
| Clay loam | 124 | 0 | 0 |
| Fine sand | 12 | 7 | 58.3 |
| Loam | 27 | 1 | 3.7 |
| Loamy fine sand | 25 | 6 | 24 |
| Sandy clay | 9 | 0 | 0 |
| Sandy clay loam | 83 | 5 | 6 |
| Sandy loam | 69 | 16 | 23.2 |
| Silt loam | 10 | 0 | 0 |
| Silty clay | 12 | 0 | 0 |
| Silty clay loam | 11 | 0 | 0 |
| Soil pH | |||
| 4.0-4.5 | 7 | 0 | 0 |
| 4.5-5.0 | 22 | 0 | 0 |
| 5.0-5.5 | 58 | 1 | 1.74 |
| 5.5-6.0 | 104 | 5 | 4.8 |
| 6.0-6.5 | 153 | 19 | 12.4 |
| 6.5-7.0 | 89 | 9 | 10.11 |
| 7.0-7.5 | 37 | 1 | 2.7 |
| >7.5 | 8 | 0 | 0 |
| Soil organic content | |||
| <3% | 236 | 22 | 9.3 |
| 3-5% | 156 | 7 | 4.4 |
| 5-7% | 73 | 2 | 2.7 |
| 7-9% | 9 | 2 | 22.2 |
| >9% | 4 | 2 | 50 |
| Soil moisture | |||
| 3-6% | 1 | 0 | 0 |
| 6-9% | 11 | 0 | 0 |
| 9-12% | 189 | 15 | 7.9 |
| 12-15% | 154 | 10 | 6.4 |
| 15-18% | 76 | 5 | 6.5 |
| 18-21% | 36 | 3 | 8.3 |
| >21% | 11 | 2 | 18.1 |
| Soil temperature | |||
| <26°C | 68 | 3 | 4.41 |
| 26-27°C | 78 | 4 | 5.12 |
| 27-28°C | 78 | 5 | 6.41 |
| 28-29°C | 80 | 7 | 8.7 |
| 29-30°C | 66 | 5 | 7.5 |
| 30-31°C | 62 | 11 | 17.7 |
| >31°C | 46 | 0 | 0 |
| Categories | Total samples | Positive samples | Recovery frequency (%)a |
|---|---|---|---|
| Climatic zone | |||
| Leeward | 255 | 26 | 10.1 |
| Windward | 223 | 9 | 4.0 |
| Mean annual rainfall (mm) | |||
| <2,300 | 218 | 24 | 11 |
| 2,300-2,900 | 99 | 9 | 9 |
| 2,900-3,500 | 91 | 1 | 1 |
| 3,500-4,100 | 52 | 1 | 1.9 |
| >4,100 | 18 | 0 | 0 |
| Av annual max air temp (°C) | |||
| <28.0 | 18 | 0 | 0 |
| 28.0-28.5 | 70 | 1 | 1.4 |
| 28.5-29.0 | 73 | 1 | 1.3 |
| 29.0-29.5 | 175 | 27 | 15.4 |
| 29.5-30.0 | 49 | 4 | 8.1 |
| 30.0-30.5 | 72 | 2 | 2.7 |
| >30.5 | 21 | 0 | 0 |
| Av annual min air temp (°C) | |||
| <19 | 18 | 0 | 0 |
| 19-20 | 73 | 1 | 1.3 |
| 20-21 | 148 | 20 | 13.5 |
| 21-22 | 80 | 1 | 1.25 |
| >22 | 159 | 13 | 8.1 |