
Table 1.
Litylenchus crenatae specimens from American beech trees (Fagus grandifolia) with BLD tested in this study.
| Specimens | Locality | Part | Session |
|---|---|---|---|
| 104H78, 104H81, 104H82, 104H83, 104H84, 104H85, 104H86, 104H87, 104H88, 104H89 and 104H90 | Lake County, Ohio | Leaf | Fall (November, 2017) |
| 104J54, 104J55, 104J56 and 104J57 | Cuyahoga County, Ohio | Leaf | Summer (May, 2018) |
| 104K17, 104K18, 104K19 and 104K20 | The Holden Arboretum, Kirtland, Ohio | Leaf | Summer (August, 2018) |
| 104K25, 104K26, 104K27, 104K28, 104K29, 104K30 and 104K31 | Potter County, Pennsylvania | Leaf | Summer (August, 2018) |
| 104K37, 104K38 and 104K39 | Crawford County, Pennsylvania | Leaf | Summer (August, 2018) |
| 104N95, 104N96 and 104N97 | The Holden Arboretum, Kirtland, Ohio | Bud | Spring (March, 2019) |
Table 2.
PCR components and setup.
| Platinum™ Taq (10 units/μl) | Taq2000™ (5 units/μl) | DreamTaq™ (5 units/μl) | TaKaRa Ex Taq™ (5 units/μl) or combined with DreamTaq™ (5 units/μl) | PicoMaxx™ System (5 units/μl) or combined with DreamTaq™ (5 units/μl) | pfu DNA polymerase (2.5 units/μl) or combined with DreamTaq™ (5 units/μl) | Herculase® II Fusion DNA polymerase | Phusion™ High-Fidelity DNA Polymerase (2 units/μl) | Pwo DNA polymerase (5 units/μl) or combined with DreamTaq™ (5 units/μl) | |
|---|---|---|---|---|---|---|---|---|---|
| Water (μl) | Mixture A: 7.6 | ||||||||
| Water (μl) | 15.375 | 16 | 16.375/16.25 | 15.875 or 15.75 | 17.3 or 17.175 | 17.05/17.55 or 16.925/17.425 | 16 | 14.5 | Mixture B: 9.875 (or 9.75) |
| 10 or 5x proprietary buffer (μl) | 2.5 | 2.5 | 2.5 | 2.5 | 2.5 | 2.5 | 5 | 5 | Mixture A: 2.5 |
| 50 mM MgCl2 (μl) | 1 | 0.25 | |||||||
| 100 mM dNTP (25 mM each) (μl) | 0.2 | 0.2 | 0.25 | Mixture B: 0.4 | |||||
| 10 mM dNTP (2.5 mM each) (μl) | 2 | 0.5 | |||||||
| 8 mM dNTP (2 mM each) (μl) | 2.5 | 2.5 | 2.5 | ||||||
| 10 μm Forward primer (μl) | 0.75 | 0.75 | 0.75 | 1.25 | 1.25 | 1.25 | 0.625 | 1.25 | Mixture B: 1.25 |
| 10 μm Reverse primer (μl) | 0.75 | 0.75 | 0.75 | 1.25 | 1.25 | 1.25 | 0.625 | 1.25 | Mixture B: 1.25 |
| DMSO | 0.25 | ||||||||
| DNA template (μl) | 2 | 2 | 2 | 2 | 2 | 2 | 2 | 2 | Mixture B: 2 |
| Proprietary DNA polymerase(s) (μl) | 0.125 | 0.25 | 0.125/0.25 | 0.125 or plus DreamTaq™: 0.125 | 0.5 or plus DreamTaq™: 0.125 | 0.75/0.25 or plus DreamTaq™: 0.125 | 0.5 | 0.25 | Mixture A: 0.125 or plus DreamTaq™: 0.125 |
| Total reaction volume (μl) | 25 | 25 | 25 | 25 | 25 | 25 | 25 | 25 | 12.5 each mixture |
Table 3.
PCR cycling conditions.
| Platinum™ Taq | Taq2000™ | DreamTaq™ | TaKaRa Ex Taq™ or combined with DreamTaq™ | PicoMaxx™ System or combined with DreamTaq™ | ||||||
|---|---|---|---|---|---|---|---|---|---|---|
| 1. Initial denaturation | 95°C for 3 min | Sep 1: 1 cycle | 95°C for 3 min | Step 1: 1 cycle | 95°C for 3 min | Step 1: 1 cycle | 98°C for 30 sec | Step 1: 1 cycle | 95°C for 2 min | Step 1: 1 cycle |
| 2. Denaturation | 95°C for 30 sec | Step 2, 3 and 4: 36 cycles | 95°C for 30 sec | Step 2, 3 and 4: 36 cycles | 95°C for 30 sec | Step 2, 3 and 4: 36 cycles | 98°C for 10 sec | Step 2 and 4: 36 cycles | 95°C for 30 sec | Step 2, 3 and 4: 36 cycles |
| 3. Annealing | 50°C for 45 sec | 50°C for 45 sec | 50°C for 45 sec | 55°C for 45 sec | ||||||
| 4. Extension | 72°C for 3 min | 72°C for 3 min | 72°C for 3 min | 68°C for 5 min | 72°C for 5 min | |||||
| 5. Final extension | 72°C for 7 min | Step 5: 1 cycle | 72°C for 7 min | Step 5: 1 cycle | 72°C for 7 min | Step 5: 1 cycle | 72°C for 7 min | Step 5: 1 cycle | 72°C for 7 min | Step 5: 1 cycle |
Table 4.
PCR cycling conditions.
| No. Step | pfu or combined with DreamTaq™ | Herculase® II | Phusion™ | Pwo or combined with DreamTaq™ | ||||
|---|---|---|---|---|---|---|---|---|
| 1. Initial denaturation | 95°C for 2 min | Step 1: 1 cycle | 95°C for 2 min | Step 1: 1 cycle | 95°C for 2 min | Step 1: 1 cycle | 95°C for 2 min | Step 1: 1 cycle |
| 2. Denaturation | 95°C for 30 sec | Step 2, 3 and 4: 36 cycles | 95°C for 20 sec | Step 2, 3 and 4: 36 cycles | 95°C for 20 sec | Step 2, 3 and 4: 36 cycles | 95°C for 30 sec | Step 2, 3 and 4: 36 cycles |
| 3. Annealling | 55°C for 45 sec | 55°C for 20 sec | 55°C for 20 sec | 57°C for 45 sec | ||||
| 4. Extension | 72°C for 5 min | 72°C for 2 min 15 sec | 72°C for 2 min 15 sec | 72°C for 5 min | ||||
| 5. Final extension | 72°C for 7 min | Step 5: 1 cycle | 72°C for 7 min | Step 5: 1 cycle | 72°C for 7 min | Step 5: 1 cycle | 72°C for 7 min | Step 5: 1 cycle |
Table 5.
Summary of PCR performance of Individual DNA polymerases (systems) tested in this study.
| Platinum™ Taq | Taq2000™ | DreamTaq™ | TaKaRa Ex Taq™ | PicoMaxx™ System | pfu | Pwo | Herculase® II | Phusion™ | |
|---|---|---|---|---|---|---|---|---|---|
| Spring specimens | 3.5 kb: X; 1.9 kb: √/X | 3.5 kb: X; 1.9 kb: √√√√/X | 3.5 kb: X; 1.9 kb: √√√√ | na | na | na | na | na | na |
| Summer specimens | na | 3.5 kb: X (DNS); 1.9 kb: √√√ (DNS) | 3.5 kb: X or X/√ (DNS); 1.7Kb: √√√√/X; 1.9 kb: √√√√/X | 3.5 kb: √√/X or X | 3.5 kb: √√/X or X | 3.5 kb: X (DNS) | 3.5 kb: X (DNS) | 3.5 kb: X | 3.5 kb: X |
| Fall specimens | na | na | 3.5 kb: √√√/X; 1.9 kb: NA | na | na | na | na | na | na |
1 Notes: DNS, data not shown. The middle segments, 1.7 and 1.9 kb were not tested in all specimens, unless otherwise noted. X: An unsuccessful PCR amplification. It was defined practically as: weak or no target PCR bands (yields) on the Lonza gels. For example, weak target PCR bands shown Lane 1 and 2 in Figure 7B, which could not provide sufficient templates for downstream direct DNA sequencing. √: A successful PCR amplification. It was defined practically based on the observations from our routine direct DNA sequencing as: the amount of resulting target amplicon in the 25 μl of PCR reaction is good for at least 6 sequencing reactions (√) in downstream direct DNA sequencing, for example, the target PCR band shown on the Lonza gel on lane 11, in Figure 1 is good for at least 6 sequencing reactions (√), while each of the strong target PCR bands shown on the Lonza gel on lane 1 to 7 and 9 in Figure 1 is good for at least 18 sequencing reactions (√√√). /X: In a test or repeating tests, most PCR amplifications were successful and only one or few were unsuccessful. /√: In a test or repeating tests, most PCR amplifications were unsuccessful and only one or few were successful
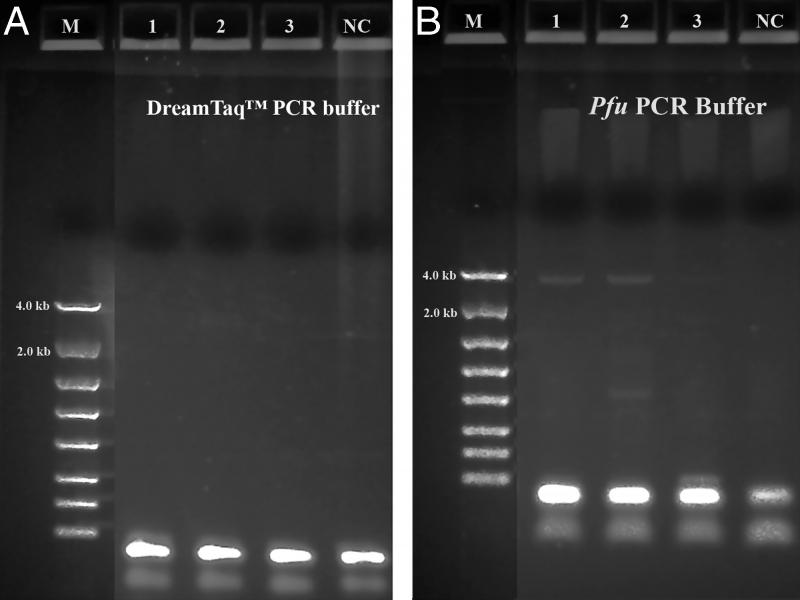
Figure 7:
Long range ribosomal PCR Amplifications of the 3.5 kb target from Summer specimens with both DreamTaq™ and Pfu in manufacturer’s PCR buffers. M: DNA markers; 1: 104K29; 2: 104K30; 3: 104K31; NC: negative control, respectively. A: DreamTaq™ PCR buffer; B: Pfu PCR buffer.
Table 6.
Summary of PCR performance of blended DNA polymerases (systems) tested in this study.
| TaKaRa Ex Taq™ combined with DreamTaq™ in TaKaRa Ex buffer | PicoMaxx™ System combined with DreamTaq™ in PicoMaxx™ buffer | DreamTaq™ in PicoMaxx™ buffer | pfu in PicoMaxx™ buffer | Pfu combined with DreamTaq™ in PicoMaxx™ buffer | pfu combined with DreamTaq™ in DreamTaq™ buffer | pfu combined with DreamTaq™ in pfu buffer | Pwo in PicoMaxx™ buffer | Pwo combined with DreamTaq™ in Pwo buffer | Pwo combined with DreamTaq™ in PicoMaxx buffer | |
|---|---|---|---|---|---|---|---|---|---|---|
| Spring specimens | na | na | na | na | na | na | na | na | na | na |
| Summer specimens | 3.5 kb: X | 3.5 kb: √√√/X | 3.5 kb: √/X or X | 3.5 kb: X | 3.5 kb: √√√√ or √√ | 3.5 kb: X | 3.5 kb: X | 3.5 kb: X | 3.5 kb: X (DNS) | 3.5 kb: √/X |
| Fall specimens | na | na | na | na | na | na | na | na | na | na |
1 Note: See the notes in Table 5.
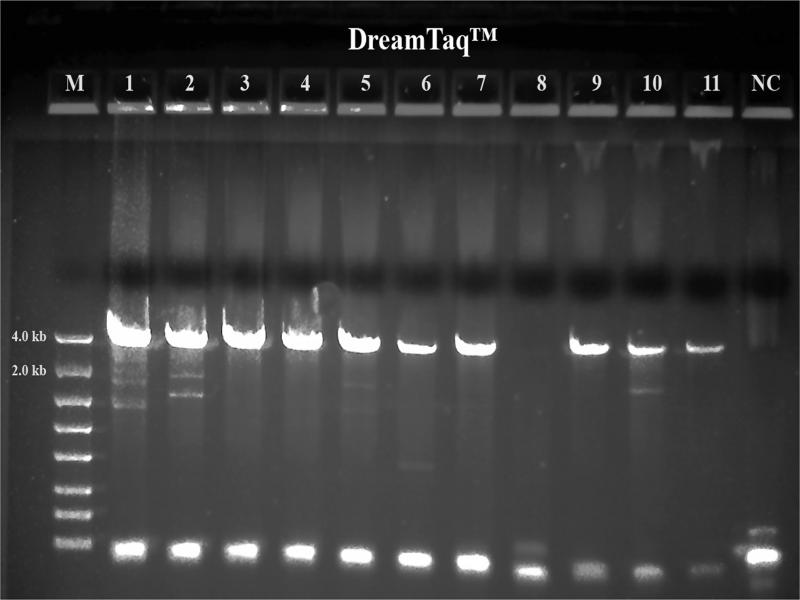
Figure 1:
Long range ribosomal PCR Amplifications of the 3.5 kb target from Fall specimens with DreamTaq™. M: DNA markers; 1: 104H78; 2: 104H81; 3: 104H82; 4: 104H83; 5: 104H84; 6: 104H85; 7: 104H86; 8: 104H87; 9: 104H88; 10: 104H89; 11: 104H90; NC: negative control. 1-7: Female; 8-11: Male.
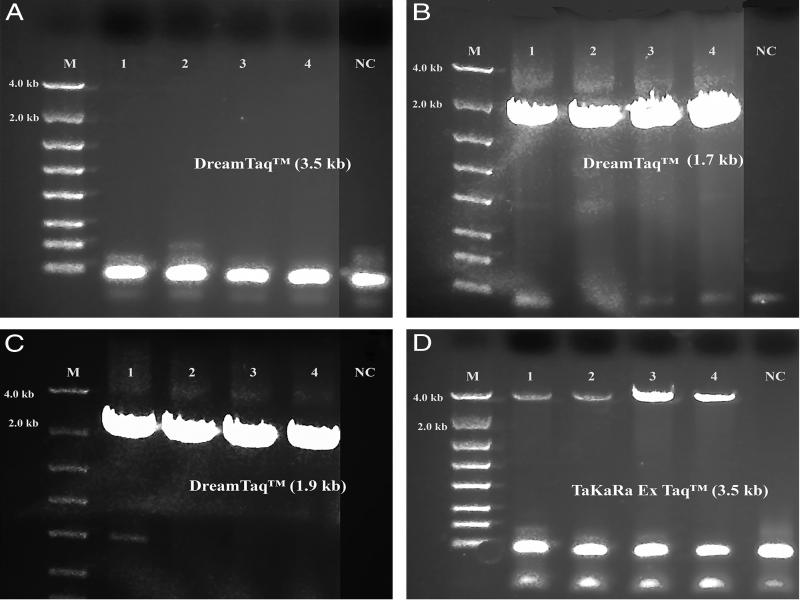
Figure 2:
Long range ribosomal PCR Amplifications of the 3.5 kb target from Summer specimens with TaKaRa Ex Taq® system. M: DNA markers; 1: 104J54; 2: 104J55; 3: 104J58; 4: 104J59; NC: negative control, respectively. A: DreamTaq™; B: 18 S locus (1.7 kb) by DreamTaq™, C: ITS and 28 S loci (1.9 kb) by DreamTaq™; D: TaKaRa Ex Taq® system.
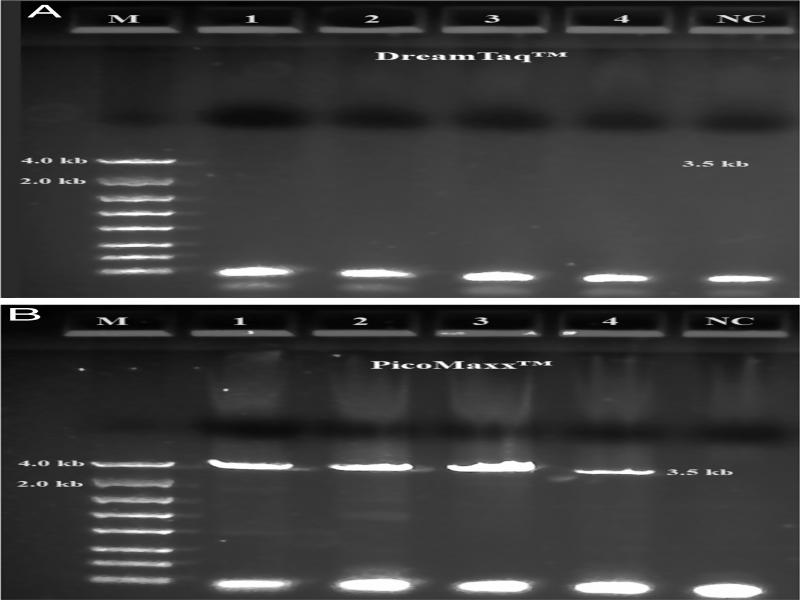
Figure 3:
Long range ribosomal PCR Amplifications of the 3.5 kb target from Summer specimens with PicoMaxx™ High Fidelity PCR System. M: DNA markers; 1: 104K17; 2: 104K18; 3: 104K19; 4: 104K20; NC: negative control, respectively. A: DreamTaq™; B: PicoMaxx™ High Fidelity PCR System.
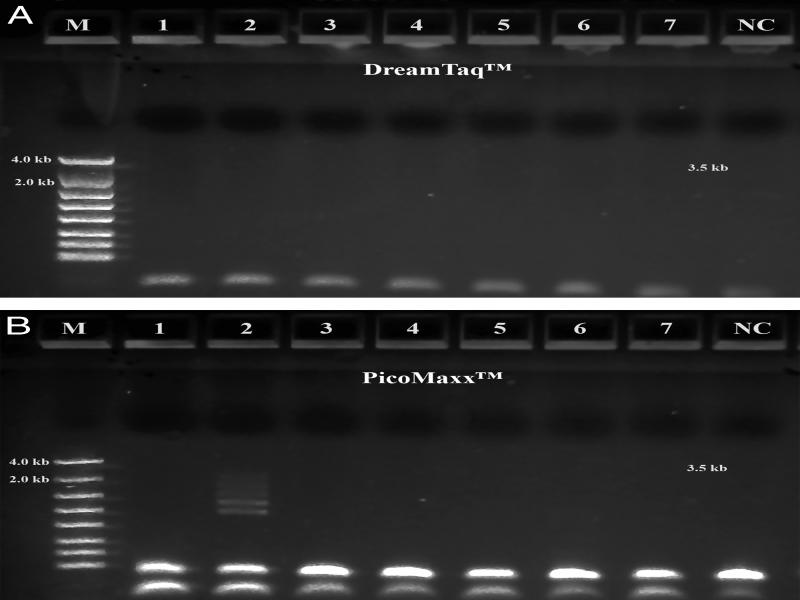
Figure 4:
Long range ribosomal PCR Amplifications of the 3.5 kb target from Summer specimens with PicoMaxx™ High Fidelity PCR System. M: DNA markers; 1: 104K25; 2: 104K26; 3: 104K27; 4: 104K28; 5: 104K29; 6: 104K30; 7: 104K31; NC: negative control, respectively. A: DreamTaq™; B: PicoMaxx™ High Fidelity PCR System.
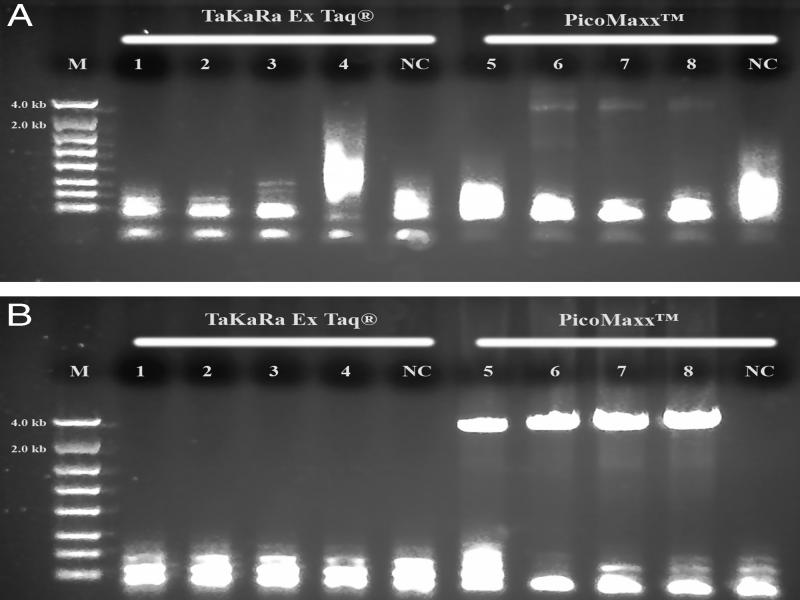
Figure 9:
PCR performance of TaKaRa Ex Taq® system and PicoMaxx™ High Fidelity PCR System. M: DNA markers; 1 and 5: 104K37; 2 and 6: 104K38; 3 and 7: 104K39; 4 and 8: 104K40. A: 1, 2, 3 and 4: TaKaRa Ex Taq® system; 5, 6, 7 and 8: PicoMaxx™ High Fidelity PCR System; B: 1, 2, 3 and 4: TaKaRa Ex Taq® system and DreamTaq™; 5, 6, 7 and 8: PicoMaxx™ High Fidelity PCR System. NC: negative control, respectively.
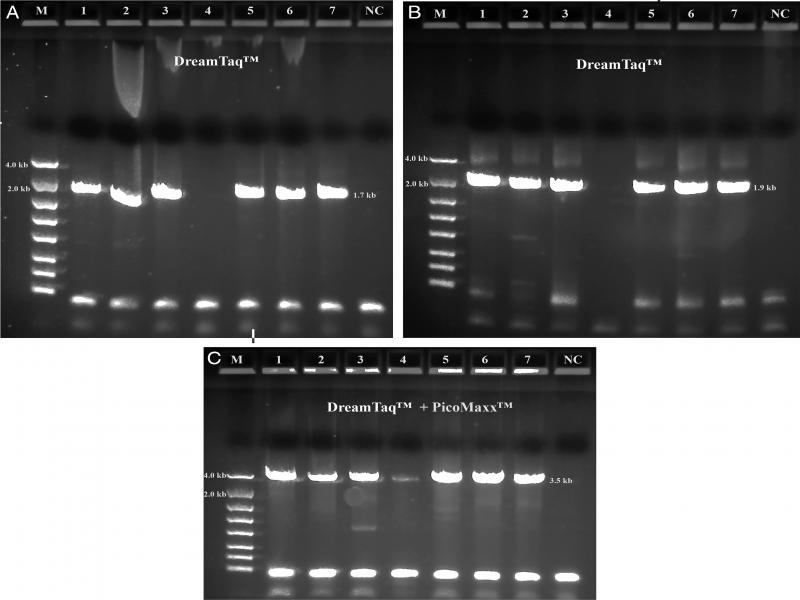
Figure 5:
Long range ribosomal PCR Amplifications of the 3.5 kb target from Summer specimens with DreamTaq™ and PicoMaxx™ High Fidelity PCR System. M: DNA markers; 1: 104K25; 2: 104K26; 3: 104K27; 4: 104K28; 5: 104K29; 6: 104K30; 7: 104K31; NC: negative control, respectively. A: 18 S locus (1.7 kb) by DreamTaq™, B: ITS and 28 S loci (1.9 kb) by DreamTaq™; C: DreamTaq™ and PicoMaxx™ High Fidelity PCR System combined.
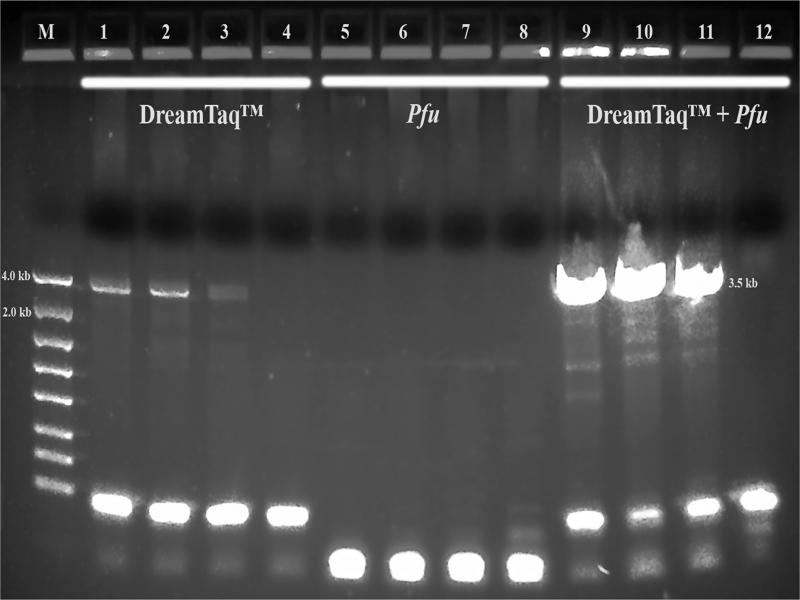
Figure 6:
Long range ribosomal PCR Amplifications of the 3.5 kb target from Summer specimens with DreamTaq™ or/and Pfu in PicoMaxx™ buffer. M: DNA markers; 1, 2, 3 and 4: DreamTaq™; 5, 6, 7 and 8: Pfu; 9, 10, 11and 12: DreamTaq™ and Pfu combined; 1, 5 and 9: 104K29; 2, 6 and 10: 104K30; 3, 7 and 11: 104K31; 4, 8 and 12: negative control (NC), respectively.
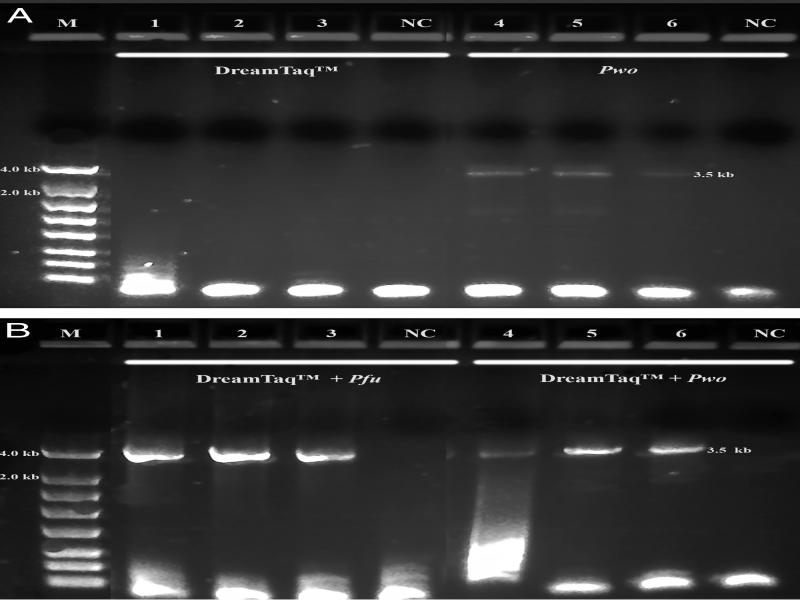
Figure 8:
PCR performance of Pfu and Pwo in PicoMaxx™ buffer. M: DNA markers; 1 and 4: 104K37; 2 and 5: 104K38; 3 and 6: 104K39. A: 1, 2 and 3: DreamTaq™; 4, 5 and 6: Pwo (0.125 μl per reaction). B: 1, 2 and 3: DreamTaq™ and Pfu; 4, 5 and 6: DreamTaq™ and Pwo (0.125 μl per reaction). NC: negative control, respectively. Note: final concentration of Pfu in each reaction was aligned with Pwo and DreamTaq™ in 0.625 units.
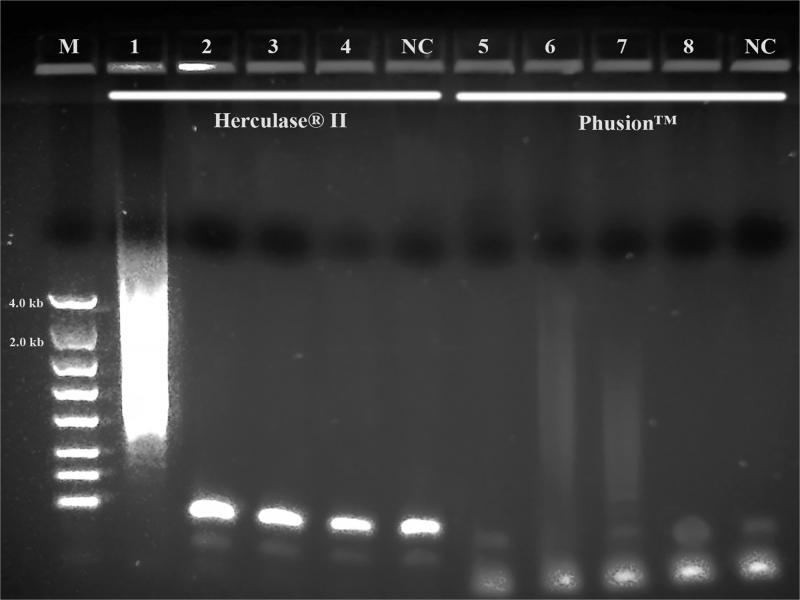
Figure 10:
PCR performance of Herculase® II Fusion DNA polymerase and Phusion™ High-Fidelity DNA Polymerase. M: DNA markers; 1 and 5: 104K37; 2 and 6: 104K38; 3 and 7: 104K39; 4 and 8: 104K40. 1, 2, 3 and 4: Herculase® II Fusion DNA polymerase; 5, 6, 7 and 8: Phusion™ High Fidelity PCR System; NC: negative control, respectively.
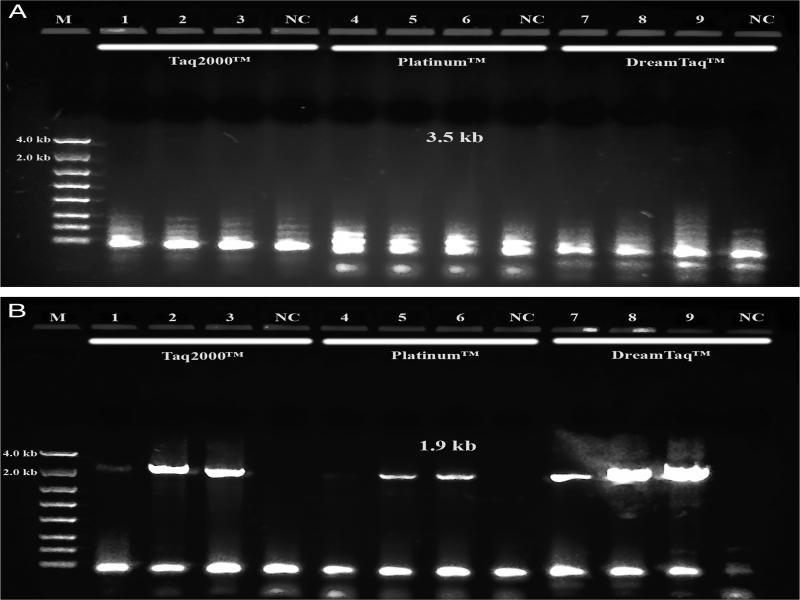
Figure 11:
PCR performance of Taq2000™, Platinum™ Taq and DreamTaq™. M: DNA markers; 1, 4 and 7: 104N95; 2, 5 and 8: 104N96; 3, 6 and 9: 104N97. 1, 2, 3 and NC by Taq2000™; 4, 5, 6 and NC by Platinum™ Taq; 7, 8, 9 and NC by DreamTaq™, NC: negative control, respectively. A: 3.5 kb target; B: 1.9 kb ITS and 28 S target. Note: final concentration of either Taq2000™ or DreamTaq™ in each reaction was aligned with Platinum™ Taq in 1.25 units.