
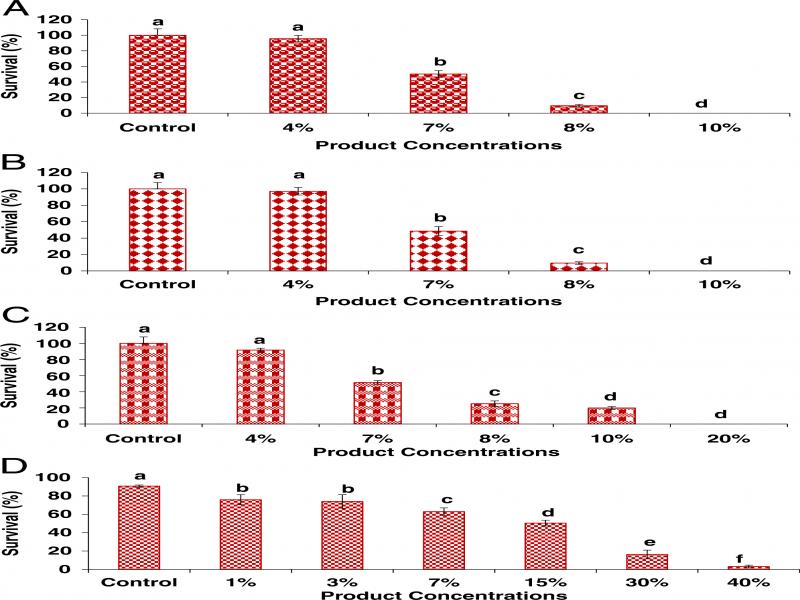
Figure 1:
The impact of varying concentration of Alltech ACS 5075 on viability of EPN species in vitro (A) S. feltiae (SB 12(1)), (B) S. feltiae (e-nema), (C) S. carpocapsae, (D) H. bacteriophora survival. Data were analyzed using one-way ANOVA with significant difference compared to the control (n = 10). Values represented by similar letters are not significantly different from each other (p ≤ 0.05).
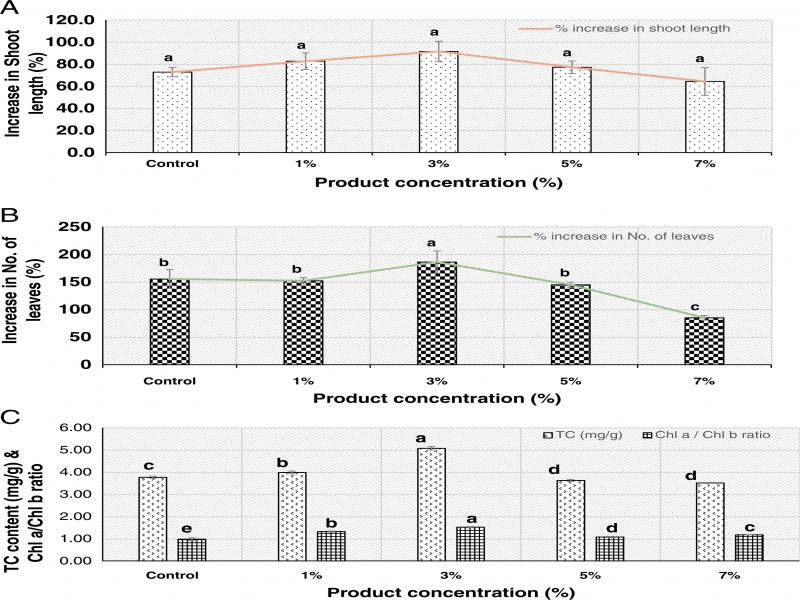
Figure 2:
Effect of ACS 5075 on: (A) percentage increase in shoot length of tomato plants, (B) percentage increase in number of leaves, and (C) chlorophyll content. Data were presented as mean ± SEM (n = 3). Values represented by similar letters are not significantly different from each other (p ≤ 0.05).
Table 1.
RKN egg hatching and juvenile survival following exposure to ACS 5075.
| M. javanica | M. incognita | |||
|---|---|---|---|---|
| Product concentration (%) | No. of juveniles hatched (J2 juveniles/ml) | Survival (%) | No. of juveniles hatched (J2 juveniles/ml) | Survival (%) |
| Control | 220 ± 10 a | 100 ± 0.8 a | 200 ± 12 a | 100 ± 9 a |
| 0.5 | 23 ± 5 b | 10 ± 0.5 b | 0 ± 0 b | 0 ± 0 b |
| 1 | 5 ± 0.5 c | 0 ± 0 c | 0 ± 0 b | 0 ± 0 b |
| 2 | 0 ± 0 d | 0 ± 0 c | 0 ± 0 b | 0 ± 0 b |
| 3 | 0 ± 0 d | 0 ± 0 c | 0 ± 0 b | 0 ± 0 b |
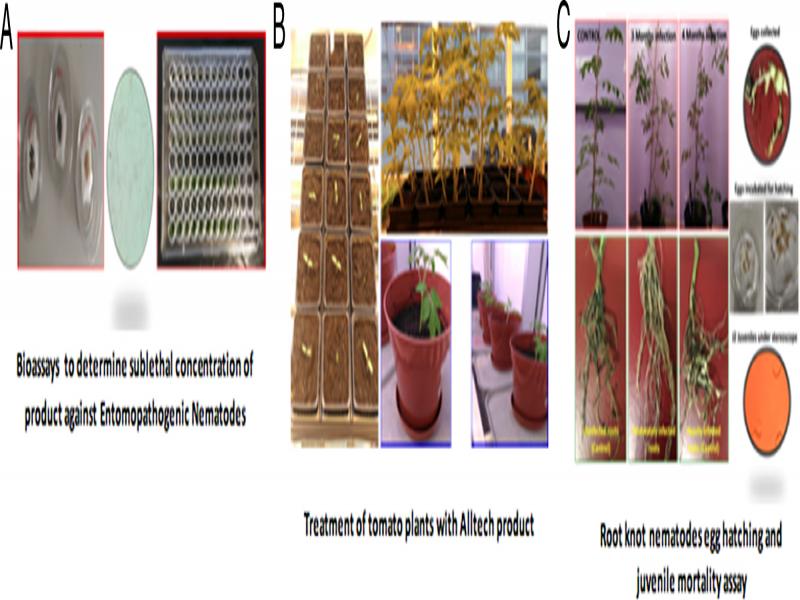
Figure 3:
(A-C) Outline of Experiments.