Edamame, also known as vegetable soybean, is a high-fiber, low-sugar snack that has gained popularity in the USA in recent years. Not only does edamame have a high protein content but it also contains all the essential amino acids the human body requires for proper nutrition (Dixit et al., 2011). Compared to traditional soybeans grown for oil or grain production that are harvested at reproductive maturity, edamame is a shorter-season crop that is harvested before the seed is mature. Edamame is harvested when the pods at the upper nodes are filled with green seeds, before the pods start to turn yellow and senesce. Because edamame is most commonly marketed in the pod, the condition and quality of both the pods and seeds is of major importance. Although edamame has been grown in the USA since the late 1800s (Conlon, 2009), its popularity has recently increased because it is a high protein, vegetable-based, healthy food. From 2003 to 2007, US gross sales of edamame increased from $18m to $30m (Bernick, 2009), with the majority of the product purchased frozen, either in-pod or shelled.
Soybean protein is comparable to animal-sourced protein and contains all the amino acids necessary for a complete human diet with less cholesterol and saturated fats than animal protein (Dixit et al., 2011). On average, a dry traditional soybean contains 35 to 40% protein. By contrast, edamame contains 33 to 36% protein on a dry weight basis (Rao et al., 2002). Edamame has about 56% more protein and higher levels of calcium and iron than green peas (Masuda, 1991). The lipid content in vegetable soybean ranges from 13 to 16% of the dry weight (Rao et al., 2002). In addition to protein and oil content, a number of other health-related parameters are linked to quality edamame such as isoflavone, fiber and vitamin E (Johnson et al., 1999; Young et al., 2000). Important edamame appearance parameters include large beans, bean color, pod pubescence color and average number of beans per pod (Johnson et al., 1999). Flavor characteristics include components of sweetness, aftertaste, nuttiness and oiliness (Young et al., 2000).
Because edamame is harvested in the pods prior to complete seed maturation, pest management concerns and strategies are different from those routinely used in traditional soybean production systems. Plant-parasitic nematodes are a significant pest concern to the profitability of soybean production in the state of Arkansas (Kirkpatrick et al., 2014), and in the southern USA (Wrather and Koenning, 2003, 2006). Two nematodes of major concern for soybean production in Arkansas include the soybean cyst nematode (Heterodera glycines, Ichinoe) and the southern root-knot nematode (Meloidogyne incognita, Kofoid & White, Chitwood). Both nematodes have been historically present in Arkansas soybean and cotton fields (Kirkpatrick et al., 1992; Bateman et al., 2000; Walter and Barker, 1994; Tylka and Marett, 2014). A survey from 2018 identified that soybean cyst and root-knot nematode combined attributed to an average of 2.5% out of the 7.77% of total soybean yield loss due to disease in the Southern USA (Allen et al., 2018). From 2003 to 2005, the number one leading pathogen in soybean grown in the southern USA was the soybean cyst nematode (Koenning and Wrather, 2010). Currently, there is effort to actively monitor and manage soybean cyst nematode populations across the USA with The SCN CoalitionTM, particularly as resistant varieties of soybean begin to lose their efficacy (Yan and Baidoo, 2018).
Although there have been studies on quality components of edamame (Li et al., 2012; Zeipina et al., 2017), the effect of nematodes on these quality traits has not be examined. A direct and widely used method of observing effects of nematode infection on a host is by identifying the nematode reproduction index (rate of initial to final nematode population densities (RI = Pi/Pf)) and relate the RI to the impact of plant yield. A similar approach can be taken to observe effects of RI on the quality of a plant host. Model systems have been used to describe the impact of nematodes on plant growth and yield (Seinhorst, 1988; Van de Berg, 2012). One of the most useful aspects of a disease-pressure model system is the estimation of a point at which the yield is threatened, also known as the damage threshold. Understanding the damage threshold of a specific host and cultivar allows growers or crop advisors to assess properly the nematode-associated risks and aid in determining when nematode management is needed. Many factors, in addition to nematode population density, play a role in determining the threshold including soil type, temperature, time, and host (McSorely and Duncan, 1995).
The goals of this study were to document the nematodes that were present in Arkansas edamame fields and determine the effect of two major nematode species on edamame yield and quality. The objectives were to: survey edamame production areas in Arkansas for plant-parasitic nematodes, determine the effects of root-knot and soybean cyst nematode initial population densities on the yield and food quality of edamame in microplots and evaluate edamame breeding lines from the University of Arkansas soybean breeding program for host suitability to M. incognita, host race 3, and H. glycines, race 5 (HG type 2.5.7), independently.
Materials and methods
Survey of nematodes in edamame production fields
Commercial edamame fields under contract with the American Vegetable Soybean and Edamame, Inc. (33 fields in 2013 and 31 fields in 2014) were surveyed for the presence and density of plant-parasitic nematodes. All sites were sampled within three weeks after edamame harvest. Samples were collected using a 2.5-cm-diameter soil probe (Soil Sampler, Step Made, USA) to a depth of 15 to 20 cm. Six cores were collected for each individual sample along the rows where the soybean stalks remained using a zig-zag pattern (Van Bezooijen, 2006) with one site representing 4 to 8 hectares, averaging a total of 500−600 cm3 of soil. Samples were placed in plastic bags, labeled with field name and location within field, transported to the laboratory in an insulated ice chest and stored in a cooler at 10−13°C (Barker et al., 1969). Soil samples were processed within two weeks of collection date. For each sample, a 100-cm3 aliquot from the mixed composite sample was assayed using a semi-automatic elutriator (Byrd et al., 1976) equipped with 40-mesh (0.4 mm) sieve over a 400-mesh (0.037 mm) final collection sieve. Soil collected on the 400-mesh sieve was processed using centrifugation flotation (Jenkins, 1964) and nematodes were identified to genus using a dissecting microscope at 60−80×.
Impact of H. glycines and M. incognita on edamame yield and quality in microplots
Field microplot experiments were conducted at two locations in 2014 to examine the effect of M. incognita and H. glycines on edamame yield and food quality. Each location included independent microplot experiments of M. incognita and H. glycines. Both experiments were arranged in a complete randomized block design with six replications of four levels of initial population densities.
Location 1 was at the University of Arkansas Southwest Research and Extension Center near Hope, AR. Microplots were made from square clay flue tiles (37.5 cm×37.5 cm) buried 122 cm deep in a grid pattern of 5×10 and spaced 91 cm apart. Each microplot was filled with a mixture of silt loam topsoil (48% sand, 50% silt, 2% clay) mixed 50:50 (v/v) with coarse sand to a volume of 21,093.75 cm3. Prior to filling the plots, the soil mix was steam pasteurized for 30 min at 70°C. The entire block was enclosed in metal fencing to deter pests. During the first month after seeding, the block was covered with nylon netting to deter birds. Location 2 of this study was a previously established plot on the Arkansas Agricultural Research and Extension Center in Fayetteville, AR. At this site, the microplots were of the same size and material as in Location 1. Existing soil from each plot was removed with a shovel and the inside surface of each tile was drenched with a 10% chlorine bleach (NaOCl) solution two months prior to refilling and planting. The microplots were filled with soil (86% sand, 11% silt, 3% clay, bulk density of 1.2 g/cm3) obtained from the Arkansas River Valley near Van Buren, AR, that had been pasteurized as described above. The site was fenced to deter pests.
Inoculum of M. incognita for both locations was prepared by collecting nematode eggs and second-stage juveniles from 60-day-old greenhouse stock cultures on tomato (Solanum lycopersicum L. cv “Rutgers”). The culture was originally collected in 2006 on cotton in Desha County, AR. Inoculum for the microplots was prepared as follows: tomato plants growing in 60-cm-diameter clay pots were removed and the above-ground vegetation discarded. Galled roots were separated from the soil and cut into 2 to 3 cm segments and mixed back into the soil from the pots, creating a soil inoculate densely populated with M. incognita. The population density of the soil inoculate was determined by collecting 100 cm3 core samples and using a semi-automatic elutriator to collect root pieces and second-stage juveniles. Root pieces collected on the 40-mesh sieve were processed using NaOCl (Hussey and Barker, 1973) to quantify eggs. This process of sampling was repeated three times, mixing in between sampling, to estimate nematode population density of the prepared soil inoculate. Nematode treatments consisting of varying initial population density (Pi) were: 0 (control), 1,000, 10,000 and 100,000 M. incognita eggs and juveniles per microplot or 0, 70, 700 and 7,000 infective units per 100-cm3 soil in each microplot. The amount of soil inoculate needed for treatment of each plot was measured and bagged, adding pasteurized soil to the lower treatments to reach a uniform volume of 704 cm3 for each treatment. Treatments were applied to each plot by incorporating the measured soil inoculate into the upper 10 cm of soil in each microplot with a shovel and rake.
Inoculum for H. glycines (Race 5, HG type 2.5.7) for both locations was obtained from a stock culture maintained by Dr R.T. Robbins, University of Arkansas. Cysts were extracted from susceptible soybeans grown for 40 days after inoculation in a greenhouse and stored in moist sand at 4°C. Race 5 (HG type 2.5.7) was chosen for this experiment since it has been recorded frequently in Arkansas fields (Bateman and Kirkpatrick, 2010). Cysts were extracted by mixing the soil in a bucket of water and pouring the suspension through 30-mesh (0.595 mm) over 60-mesh (0.25 mm) nested sieves. The number of eggs per cyst was estimated by crushing a known number of cysts and counting the eggs released. Based on the average egg count per cyst, the number of cysts needed for each plot treatment was calculated. Cysts were placed into a 500-mL bottle with 100 mL of tap water and poured into the assigned microplots. An additional 500 mL of clean tap water was used to rinse out the bottle and poured into the respective microplot. The added cysts were incorporated into the upper 10 cm of soil in each microplot using a shovel and rake as described above for the root-knot inoculation. Initial population densities were 0, 1000, 10,000 and 100,000 eggs per microplot as with the M. incognita treatments.
Immediately after inoculation, six seeds of the edamame cultivar “8080”, which was the most common cultivar grown by Arkansas growers, were planted in each plot about 7 cm apart. At 18 days after seedling emergence, the plant population was adjusted to four plants per plot. Plots were treated with a mild insecticidal soap to discourage an aphid infestation (“Bug B Gon”, Ortho®) two weeks after seedling emergence. A complete fertilizer (Scott’s Osmocote® 14-14-14) was applied as directed in label one week after seedling emergence as suggested by soil test results. All plots were hand-watered as necessary throughout the study.
Nematode sampling and evaluation
The nematode population density from all plots at both locations was assayed four weeks after planting to monitor populations halfway through the season. Soil samples from each microplot were obtained by collecting six individual cores using a soil probe (2.5-cm-diameter) 15 cm deep. To avoid contamination between plots, the soil probe was washed and sterilized with 10% chlorine bleach after each plot was sampled. The risk of significant contamination was further minimized by first taking the samples from the nematode-free control plots and then sampling each treatment separately from low to high population density. The cores were bulked for each plot and a 100-cm3 subsample was assayed using a semi-automatic elutriator followed by centrifugal flotation. Juvenile and egg counts were recorded for each plot. Soil was sampled from each plot again on the same day as harvest before the plants were removed from the plots to quantify nematode densities at time of harvest. Cross contamination was prevented in the same manner as described above. The roots from M. incognita-infested plots were scored for galling severity using a 0–10 severity scale (Barker, 1982), and the roots were placed in a paper bag, and transported to the laboratory. Nematode eggs were extracted from roots from each plot using NaOCl as described previously. The average number of eggs per root system in each plot was recorded (Table 2).
Microplot harvest
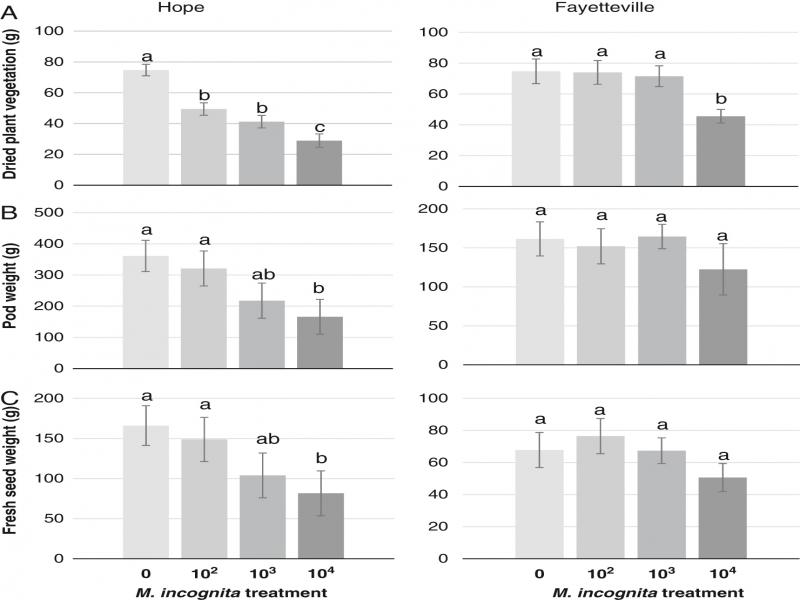
Soybeans in the microplots were harvested by hand-picking all pods from each plant at soybean growth stage R6 (Fehr, 1971) that occurred 73 days after planting (Location 1) and 75 days after planting (Location 2). The number of pods per plant was recorded, and all pods from each plot were bulked, placed into a paper bag and labeled. The number of pods containing one, two and three seed and total weight of all pods were recorded per plot. All pods were hand-shelled, and the beans were bulked for each plot. The total fresh seed weight was recorded.
The fresh seeds from all pods were arranged in foil boats by plot and put in a blast freezer (Air-O-Chill, Elextrolux Professional SpA, Pordenone, Italy) at −25°C for 20 min. The seeds were then placed in a freeze dryer (Virtis Genesis, SP Scientific, PA, USA) at −45°C for a total of 120 hr (Rayaprolu et al., 2015). The moisture content was calculated as the weight difference before and after freeze drying. The freeze-dried seeds were ground using an electric coffee bean grinder for approximately 30 sec and sieved through a 30-mesh (0.595 mm) sieve. The sieved flour was used for analysis of protein (AOAC 990.03), lipid (AACC 30-26) and starch (Megazyme kit, AACC 76-13.01, 1995) as follows: the total amount of protein in each sample was measured using the nitrogen combustion methodology (CLG-PRO4.03) (AOAC method 992.23, AOAC, 1990). The lipid extraction protocol was modified from the AACC method, “Crude Fat in Soy Flours” (AACC method 30-26, AACC, 1995). Filter paper (WhatmanTM 4, 150 mm, Cat No 1004 150) was folded, weighed, and a 2-gram sample of the flour was wrapped in the filter paper. The wrapped sampled was inserted into a paper tube and placed in a soxhlet apparatus placed under an enclosed vent hood. The system included condensers, filter tubes and 500-mL glass collection beakers on a series of hot plates (AACC method 30-26). Approximately 150 mL of petroleum ether was added to each sample via the condensers, and the samples were run through a 5-hour cycle to ensure removal of all soluble lipids. The samples wrapped in filter paper were then aired dried for a minimum of 8 hr and weighed. The amount of lipid in each sample was calculated by the change in sample flour weight to four decimal places. The starch content was analyzed using a Megazyme©, 2011 Total Starch kit (amyloglucosidase/α-amylase method, Megazyme, Bray Business Park, Bray, Co. Wicklow, A98 YV29, Ireland) to quantify the total starch in each sample as directed, corresponding to the AACC Method 76-13.01. Light absorption from each sample was measured using a spectrophotometer (Shimadzu UV160 UV-Vis, Dual Beam) at a wavelength of 500 nm.
All collected data were analyzed using general linear models (SAS Institute, Inc., 2014). Differences among treatments were compared using least significant difference (LSD) at p ≤ 0.05.
Host suitability of edamame breeding lines
In total, 24 advanced breeding lines of edamame from the University of Arkansas, Division of Agriculture soybean breeding program were obtained from Dr Pengyin Chen, Department of Crops, Soils, and Environmental Sciences, University of Arkansas, Fayetteville, AR. Three seeds of each line were planted in 10-cm-diameter clay pots filled with pasteurized sandy loam soil (86% sand, 11% silt, 3% clay, bulk density of 1.2 g/cm3). One week after planting, plant populations were adjusted to one plant per pot. In all trials, the pots were arranged in a randomized complete block design to account for possible variability in environmental conditions at different positions on the greenhouse bench. Five replications of each line were infested with nematodes as described below. Plants were watered and fertilized with Scott’s Osmocote® 14-14-14 (Scott’s MiracleGroTM) as needed for active growth. Greenhouse temperatures ranged from 26–29 °C for the trials conducted in June–July, 2013, and 24–27°C for the trial repeated in October–December, 2013. All lines were evaluated in a third trial May–June, 2014.
Meloidogyne incognita
A population of M. incognita that was originally collected from soybean in Drew County, AR, and maintained on tomato, cv “Rutgers” was used for evaluation of suitability of the lines as hosts for root-knot nematodes. Eggs were collected from 60-day-old, greenhouse-grown plants using the following methodology: galled roots were removed from pots, rinsed thoroughly to remove soil, placed in a blender with 100-cm3 water, and pulsed for three, 1-second cycles. The root pieces were then placed in an Erlenmeyer flask and extracted by shaking in a 0.5% solution of NaOCl for 2.5 min to free eggs from egg masses (Hussey and Barker, 1973). The eggs were collected on a 500-mesh (0.025 mm) sieve and rinsed thoroughly with tap water. Each pot was inoculated by pipetting 4,500 eggs in 5 mL water in two 1-cm diameter holes near the base of the plant at true leaf stage. Plants were grown in a greenhouse for the duration of the experiment. The edamame cultivar, “8080”, was the susceptible check used in all trials.
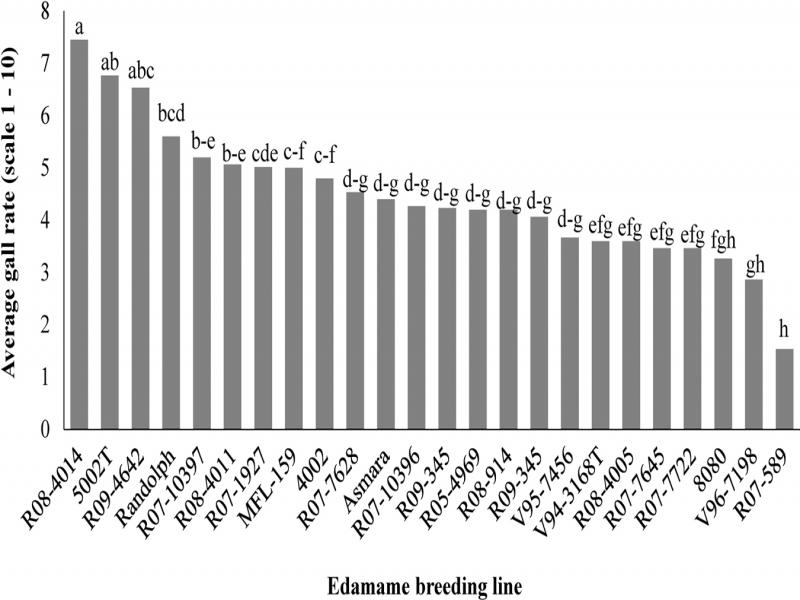
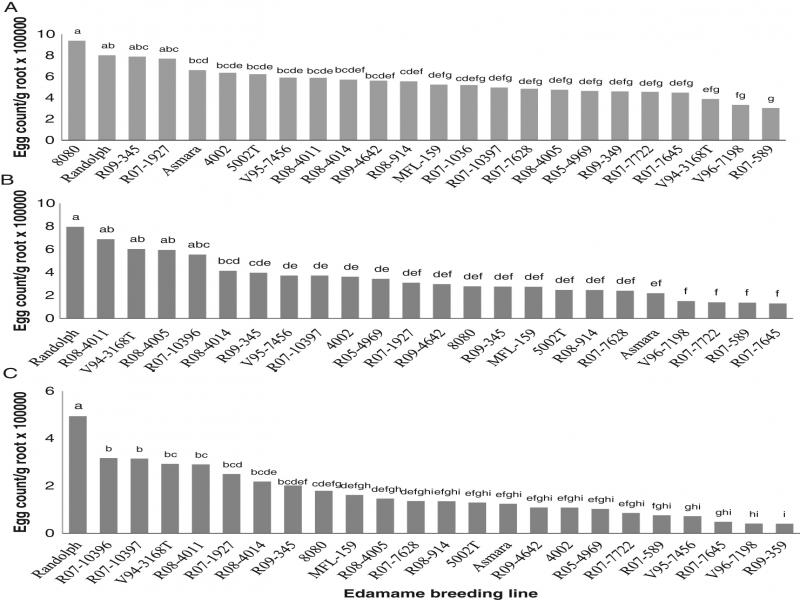
After 45 days, the plants were cut at the soil line and the stem and root tissue was weighed for fresh weight. The roots were then rated for root galling severity on a 0–10 scale where 0=no galls, and 10=100% of the roots covered with galls (Barker, 1982). Following gall ratings, roots were placed whole into a 500-mL wide-mouth Erlenmeyer beaker and stirred with an electric mixer in 0.5% NaOCl for 4 min. The solution and roots were poured through a 100-mesh (0.149 mm) over 500-mesh (0.025 mm) stacked sieves and rinsed with tap water. The eggs collected on the 500-mesh sieve were quantified at 60× magnification. The roots were then dried for 48 hr at 60°C in a plant drier and weighed. Root weights were used to calculate the nematode reproduction per gram of dry root tissue.
Heterodera glycines
The same stock culture of H. glycines (HG type 2.5.7) that was used in the microplot studies was also used for the host suitability trial. Cysts that had previously been extracted from greenhouse-grown soybean plants and stored in 4°C in sterile soil were obtained from Dr R.T. Robbins (University of Arkansas, Fayetteville, AR). Cysts were separated from the soil by rinsing on stacked 30-mesh (0.595 mm) over 60-mesh (0.25 mm) sieves. The cysts collected on the 60-mesh sieve were transferred into a glass tissue grinder and lightly ground to free the eggs, and the eggs were collected on a 500-mesh (0.025 mm) sieve. The inoculation procedure was performed in a manner identical to the root-knot procedure above at a rate of 4,500 eggs per pot.
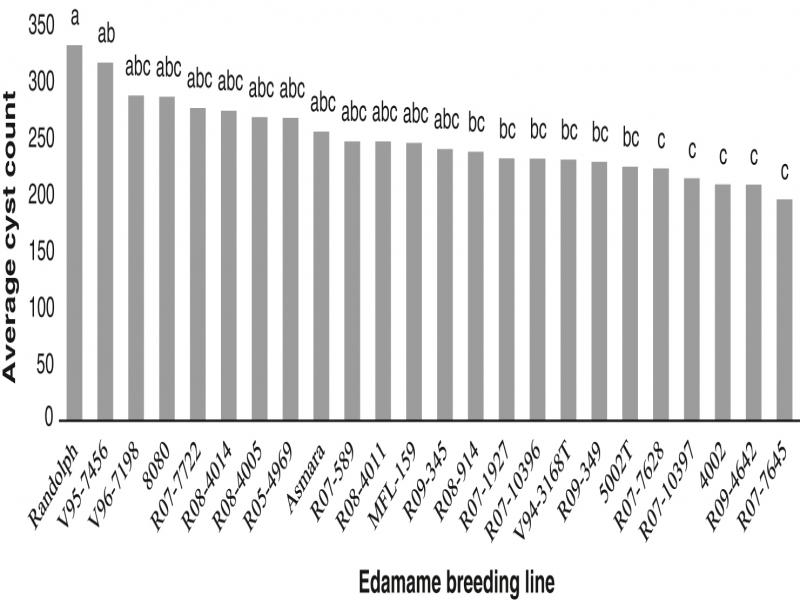
After 30 days, plants were cut at the soil line and each pot was extracted separately by placing the roots and soil into a 4.7-liter bucket. Water was added at high pressure, and the soil and roots were mixed vigorously and poured through 30 over 60-mesh nested sieves with each sieve rinsed thoroughly (Hussey et al., 1991). Cysts were collected from the 60-mesh sieve in 100-mL beakers and stored at 4°C until quantified. The contents of the beaker were poured into a counting dish, and cysts were counted. After extraction, the roots of each plant were dried for 48hr in a large plant drier at 60°C and weighed.
The five replications within each trial were analyzed in an ANOVA using JMP ® 14.1.0 (SAS Institute Inc., 2018) for both root-knot and soybean cyst nematode trials, independently.
Data for the three root-not trials were recorded as gall rating and average egg count per gram of root tissue across all five replicates. For the cyst trials, the average number of cysts collected from the five replicates was calculated for each trial and an ANOVA was used for each trial independently. Lines that performed significantly different within each trial were identified using LSD analysis (α=0.05).
Results
Survey of plant-parasitic nematodes in Arkansas edamame production fields
A total of 203 soil samples were collected and processed from edamame fields in two years. The nematode genera found in both years of the survey were Meloidogyne, Heterodera, Pratylenchus, Helicotylenchus, Tylenchorhynchus, Paratrichodorus and Hoplolaimus (Table 1). Other plant-parasitic nematodes identified in low levels in only one or two fields include Xiphinema and Criconemoides (data not shown). Meloidogyne and Heterodera, both of which are economically significant nematodes in traditional soybean production systems, were found in edamame fields both years of the survey. In 2013, Meloidogyne was found in 12 (of 33) fields and Heterodera was found in 13 fields. In 2014, Meloidogyne was present in fewer fields (7 fields out of 31 sampled) and Heterodera was found in 12 fields. Meloidogyne was found in the highest abundance in individual fields in both 2013 and 2014 in Lonoke, Johnson, and Yell counties (Table 1). Meloidogyne was not detected in Faulkner, Pulaski or Logan counties in 2013, nor in Logan and White counties in 2014. Heterodera was common both years although they were not detected in Faulkner and Yell County in 2013 nor in Logan County in 2014. Heterodera was found in highest numbers in Lonoke County both years. Other less economically important parasitic species, such as Helicotylenchus and Pratylenchus were detected in more fields (higher prevalence) for both years.
Table 1.
Average population density of nematode genera (when present) identified in Arkansas edamame fields.
| County | No. of fields | Meloidogyne | Heterodera | Pratylenchus | Helicotylenchus | Tylenchorhynchus | Paratrichodorus | Hoplolaimus |
|---|---|---|---|---|---|---|---|---|
| 2013 | ||||||||
| Faulkner | 1 | 0 a | 0 | 94 | 42 | 83 | 42 | 0 |
| Johnson | 1 | 42 | 83 | 83 | 42 | 0 | 0 | 0 |
| Logan | 10 | 0 | 42 | 50 | 42 | 80 | 42 | 0 |
| Lonoke | 9 | 278 | 54 | 77 | 88 | 236 | 125 | 125 |
| Pulaski | 1 | 0 | 125 | 83 | 250 | 167 | 125 | 0 |
| White | 7 | 42 | 52 | 0 | 0 | 0 | 42 | 0 |
| Yell | 4 | 339 | 0 | 369 | 42 | 83 | 42 | 0 |
| Percent prevalent b | 36.36 | 39.39 | 57.58 | 39.39 | 30.3 | 21.21 | 3.03 | |
| 2014 | ||||||||
| Johnson | 7 | 2731 | 38 | 51 | 142 | 50 | 38 | 0 |
| Logan | 3 | 0 | 0 | 38 | 102 | 128 | 0 | 0 |
| Lonoke | 7 | 637 | 346 | 66 | 109 | 99 | 38 | 0 |
| White | 8 | 0 | 61.2 | 38 | 67 | 66 | 154 | 77 |
| Yell | 6 | 38 | 58 | 53 | 84 | 38 | 0 | 0 |
| Percent prevalent | 22.58 | 38.71 | 48.39 | 80.65 | 58.06 | 19.35 | 3.23 | |
| Initial infestation density (eggs per microplot) | M. incognita juveniles (J2) per 100 cm3 soil | Gall ratinga | Average number of eggs from one root ball | |
|---|---|---|---|---|
| Hope | ||||
| 0 | 0 a,b | 0 a | 0 a | |
| 1,000 | 92 b | 6.2 b | 1,681,720 b | |
| 10,000 | 79 b | 8.3 c | 1,510,267 b | |
| 100,000 | 110 b | 9.1 c | 682,973 a,b | |
| Fayetteville | ||||
| 0 | 0 a | 0 a | 0 a | |
| 1,000 | 2 a | 5.2 b | 200,720 b | |
| 10,000 | 297 b | 7.0 b | 859,840 b | |
| 100,000 | 1,018 c | 9.7 c | 1,559,313 c | |
| Initial infection level (eggs per microplot) | H. glycines juveniles (J2) per 100 cm3 soil | Cysts per 100 cm3 soil | Cysts from roots in microplots at harvest | |
|---|---|---|---|---|
| Hope | ||||
| 0 | 0 a | 0 a | 0 a | |
| 1,000 | 2 a | 8 a | 97 a | |
| 10,000 | 26 a | 67 a | 745 a | |
| 100,000 | 199 b | 850 b | 7,674 b | |
| Fayetteville | ||||
| 0 | 176 a | 14 a | 240 a | |
| 1,000 | 102 a | 12 a | 220 a | |
| 10,000 | 531 a | 36 a | 774 a | |
| 100,000 | 2,068 b | 254 b | 3,923 b | |
| Treatment (eggs per plot) | Moisture | Protein | Lipid | Starch |
|---|---|---|---|---|
| Hope | ||||
| 0 | 71.37 a | 38.24 a | 11.16 a | 10.29 a |
| 1,000 | 70.37 a | 38.23 a | 12.83 a | 10.56 a |
| 10,000 | 68.04 b | 36.89 b | 14.58 a | 10.08 a |
| 100,000 | 68.83 b | 36.46 b | 14.66 a | 10.06 a |
| Fayetteville | ||||
| 0 | 76.04 a | 36.53 a | 10.02 a | 9.27 a |
| 1,000 | 75.41 a | 36.44 a | 10.27 a | 9.56 a |
| 10,000 | 76.19 a | 36.92 a | 12.10 a | 9.43 a |
| 100,000 | 75.75 a | 36.47 a | 10.40 a | 9.58 a |
| Treatment (eggs per plot) | Moisture | Protein | Lipid | Starch |
|---|---|---|---|---|
| Hope | ||||
| 0 | 70.15 a,b | 37.57 a | 10.14 a | 10.73 a |
| 1,000 | 70.61 a | 37.57 a | 10.85 a | 10.46 a |
| 10,000 | 69.59 a,b | 36.86 a,b | 10.38 a | 10.91 a |
| 100,000 | 66.24 b | 36.18 b | 11.66 a | 10.94 a |
| Fayetteville | ||||
| 0 | 74.87 a | 35.86 a | 8.03 a | 12.62 a |
| 1,000 | 75.33 a | 36.37 a | 7.82 a | 12.39 a |
| 10,000 | 74.82 a,b | 35.71 a | 8.87 a,b | 13.01 a |
| 100,000 | 74.46 b | 34.66 b | 9.62 b | 13.25 a |