
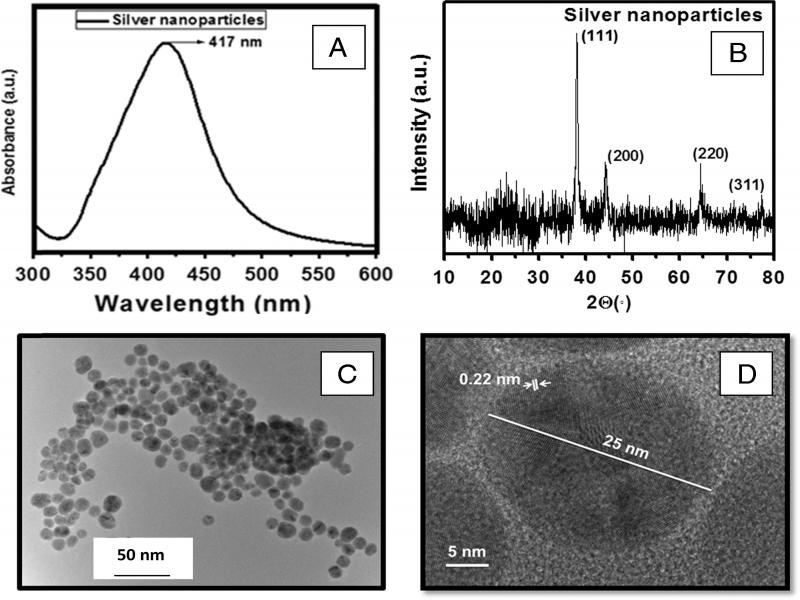
Figure 1:
Silver nanoparticles (AgNP) characterization (A) ultra violet-visible (UV–Vis) absorption spectra exhibiting 417 nm absorbance related to surface plasmon resonance of AgNP, (B) X-ray diffractogram showing the different reflections from crystalline planes of AgNP, indicating the formation of face-centered cubic (FCC) structure of AgNP, (C) transmission electron microscopy (TEM) image showing the formation of poly-dispersed spherical AgNP with average size of 20 nm, and (D) high resolution TEM image of single AgNP of 25 nm showing characteristic inter-planar spacing of silver (Ag).
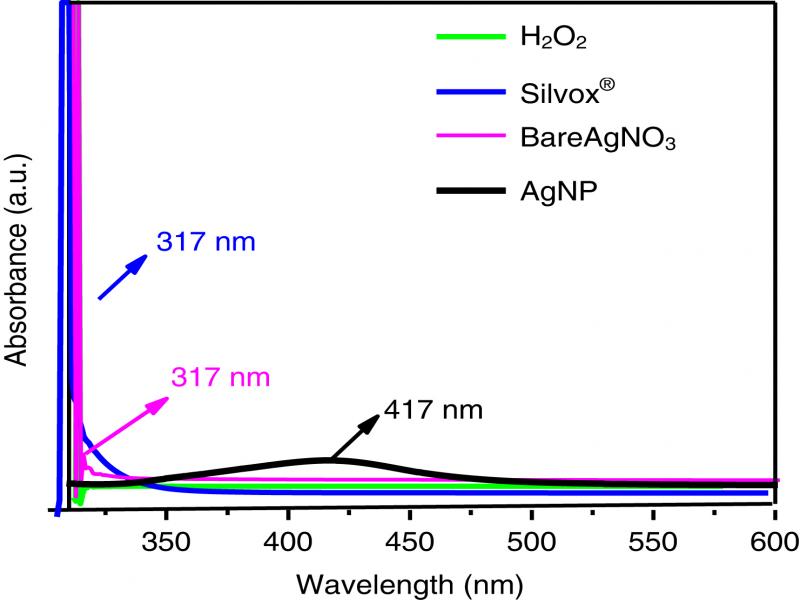
Figure 2:
Ultra violet-visible (UV–Vis) spectra of silver nanoparticles (AgNP), AgNO3, H2O2, and commercial Silvox 500® showing the distinctive features of AgNP which is absent in Silvox 500®.
Table 1.
Percentage mortality of Meloidogyne graminicola J2 as affected by concentrations of silver nanoparticles (AgNP) in lab assays using sand as the medium.
| Percent juvenile mortality after | |||
|---|---|---|---|
| AgNP conc. (µg/ml) | 24 hr | 48 hr | 72 hr |
| 0a | 0 | 0 | 0 |
| 0.1 | 0 | 0 | 0 |
| 0.2 | 13.3 | 6.7 | 16.3 |
| 0.3 | 36.7 | 30 | 55 |
| 0.4 | 43.3 | 46.7 | 68.3 |
| 0.5 | 60 | 83.3 | 80 |
| 1.0 | 73.3 | 96.7 | 93.3 |
| 2.0 | 100 | 100 | 100 |
| 3.0 | 100 | 100 | 100 |
1 Notes: aControl (no AgNP, water alone). Means are averages of three replications. Data were subjected to 9 × 3 (AgNP concentration × incubation time) factorial analysis of variance (ANOVA), critical difference (CD) for incubation time is 0.027, CD for AgNP concentrations is 0.468, and that for time × concentrations is 0.81.
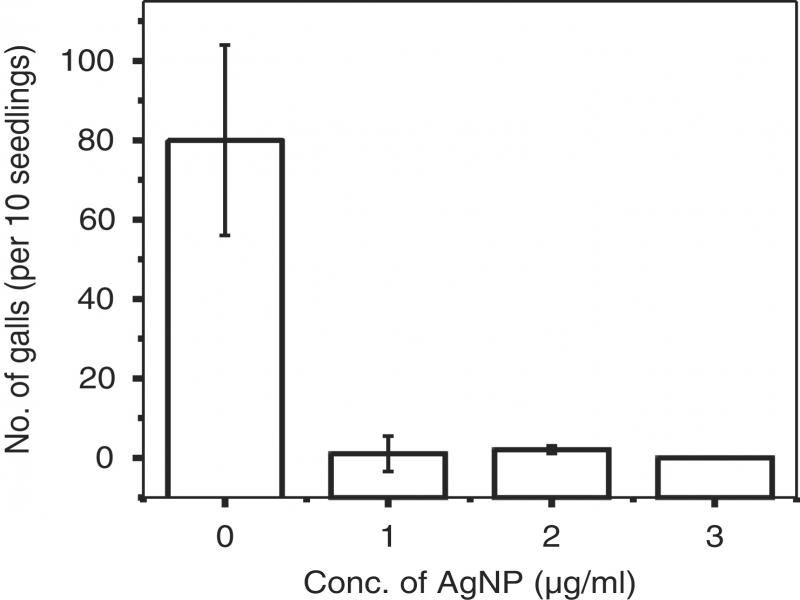
Figure 3:
Effect of silver nanoparticles (AgNP) on root galling by Meloidogyne graminicola on rice seedlings in soilless system. The experiment was repeated, the Trial×Treatment interaction was not significant (p>0.05). Data are means of two trials. All treatments had 10 replications randomized completely.
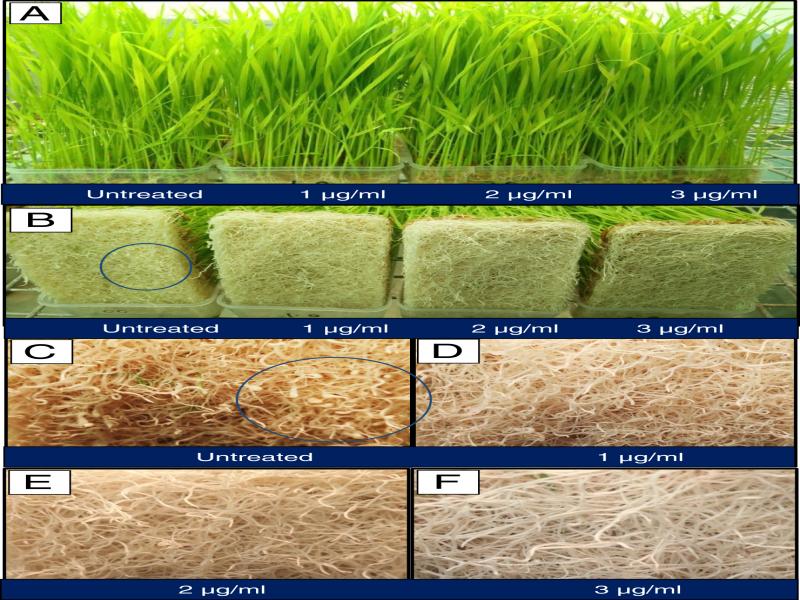
Figure 4:
(A) Rice seedlings grown in soilless medium, (B) root mats of different treatments showing galls, and (C-F) magnified view of root mats showing galls.
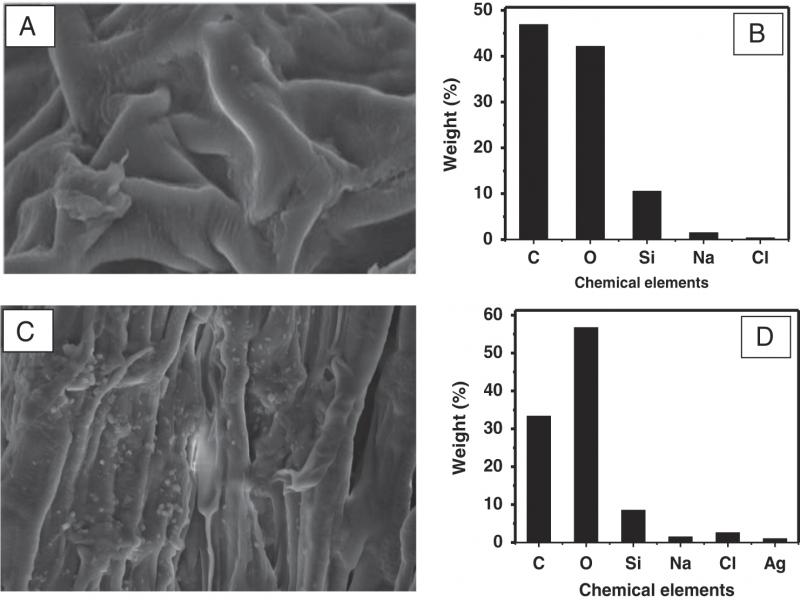
Figure 5:
(A) Scanning electron microscope (SEM) micrographs of rice roots without silver nanoparticles (AgNP) treatment, (B) energy-dispersive X-ray spectroscopic elemental analysis of rice roots without AgNP, (C) SEM micrographs of rice roots with AgNP, and (D) energy-dispersive X-ray spectroscopic elemental analysis of rice roots with AgNP.
Table 2.
Effect of silver nanoparticles (AgNP) as seed soak or soil drench on rice seedling growth and root galling by Meloidogyne graminicola in glasshouse trial using autoclaved soil.
| AgNP conc. | Fresh weight of 10 seedlings (g) | No. of galls/seedling |
|---|---|---|
| Seed soaking for 12 h | ||
| 1 µg/ml | 1.411a | 4.96ab |
| 2 µg/ml | 1.649a | 3.33b |
| 3 µg/ml | 1.291a | 2.33c |
| Soil drenching at 100 ml/pot | ||
| 1 µg/ml | 1.334a | 6.03a |
| 2 µg/ml | 1.402a | 3.70bc |
| 3 µg/ml | 1.457a | 2.23c |
| Untreated control | 1.277a | 7.20a |
1 Notes: The experiment was repeated, the Trial × Treatment interaction was not significant (p > 0.05). Data are means of two trials. All treatments had four replications randomized completely. Values with same letters in a column denote non-significant differences according to test of significance (p ≤ 0.05) in a completely randomized design.
Table 3.
Effect of silver nanoparticles (AgNP) as soil drench on rice seedling growth and root galling by Meloidogyne graminicola in nematode-infested field soil.
| AgNP conc. | Fresh weight of 10 seedlings (g) | No. of galls/seedling |
|---|---|---|
| 3 µg/ml | 1.637a | 4.9bc |
| 6 µg/ml | 1.365a | 4.3bc |
| 9 µg/ml | 1.679a | 3.9bc |
| 12 µg/ml | 1.318a | 2.8c |
| Silvox® solution | 1.567a | 5.4ab |
| Untreated control | 1.600a | 7.5a |
1 Notes: Drenching at 100 ml per pot. Initial nematode population = 1 J2 per g soil. The experiment was repeated, the Trial × Treatment interaction was not significant (p > 0.05). Data are means of two trials. All treatments had four replications randomized completely. Values with same letters in a column denote non-significant differences according to test of significance (p ≤ 0.05) in a completely randomized design.