
Table 1.
Effects of nitrogen (N, as urea) input and irrigation frequency on grapevine petiole N concentrations (% dry weight) determined at full bloom.
| Irrigation frequency | ||
|---|---|---|
| Fertilizer N input | Daily (% N) | Low frequency (% N) |
| 0 kg N ha−1 year−1 | 0.91 (0.02) | 0.89 (0.02) |
| 16.6 kg N ha−1 year−1 | 0.91 (0.02) | 0.94 (0.04) |
| 33.2 kg N ha−1 year−1 | 1.01 (0.05) | 0.94 (0.04) |
| 66.4 kg N ha−1 year−1 | 1.12 (0.06) | 1.11 (0.06) |
| ANOVA table | Pr > F | |
| Irrigation frequency | 0.63 | |
| N fertilization | < 0.0001 | |
| Irrigation × N fert | 0.61 | |
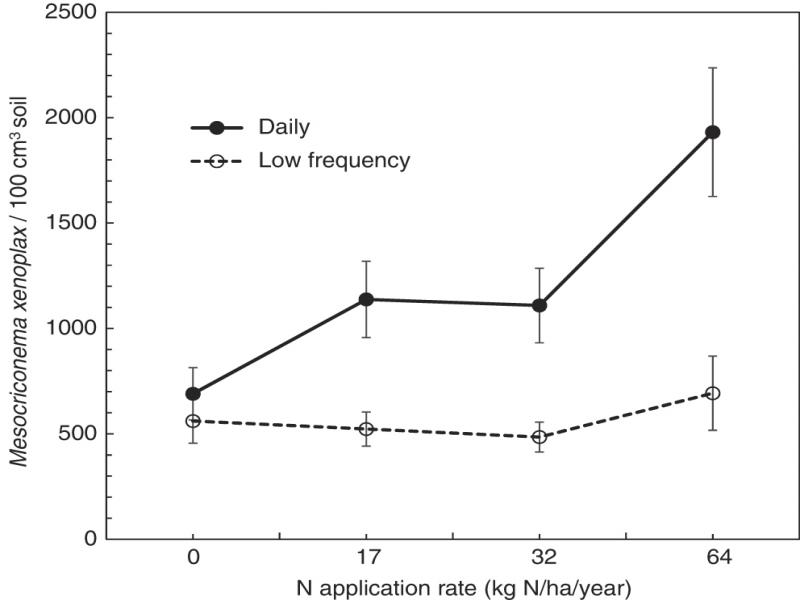
Figure 1:
Effects of nitrogen (N, as urea) input and irrigation frequency on population densities of the ring nematode, Mesocriconema xenoplax, in root zone soils of wine-grape. Values are averages, (+/-) standard errors of means, from six blocks and six sample dates during 2010–2011 (n = 36).
Table 2.
Effects of daily and low frequency irrigation treatments (irrigated to replace evapotranspiration loss) on volumetric soil moisture content of the top 20 cm of soil.
| Irrigation frequency | ||
|---|---|---|
| Soil moisture | Daily | Low frequency |
| Mean (cm3/cm3) | 14.25 (0.62) | 11.39 (0.76) |
| CVa | 0.11 | 0.16 |
| Maximum (cm3/cm3) | 17.81 | 16.30 |
| Minimum (cm3/cm3) | 11.37 | 8.03 |